
Abstract
The role of microRNAs in brain cancer is still naive. Some act as oncogene and others as tumor suppressors. Discovery of efficient biomarkers is mandatory to debate that aggressive disease. Bioinformatically selected microRNAs and their targets were investigated to evaluate their putative signature as diagnostic and prognostic biomarkers in primary glioblastoma multiforme. Expression of a panel of seven microRNAs (hsa-miR-34a, hsa-miR-16, hsa-miR-17, hsa-miR-21, hsa-miR-221, hsa-miR-326, and hsa-miR-375) and seven target genes (E2F3, PI3KCA, TOM34, WNT5A, PDCD4, DFFA, and EGFR) in 43 glioblastoma multiforme specimens were profiled compared to non-cancer tissues via quantitative reverse transcription–polymerase chain reaction. Immunohistochemistry staining for three proteins (VEGFA, BAX, and BCL2) was performed. Gene enrichment analysis identified the biological regulatory functions of the gene panel in glioma pathway. MGMT (O-6-methylguanine-DNA methyltransferase) promoter methylation was analyzed for molecular subtyping of tumor specimens. Our data demonstrated a significant upregulation of five microRNAs (hsa-miR-16, hsa-miR-17, hsa-miR-21, hsa-miR-221, and hsa-miR-375), three genes (E2F3, PI3KCA, and Wnt5a), two proteins (VEGFA and BCL2), and downregulation of hsa-miR-34a and three other genes (DFFA, PDCD4, and EGFR) in brain cancer tissues. Receiver operating characteristic analysis revealed that miR-34a (area under the curve = 0.927) and miR-17 (area under the curve = 0.900) had the highest diagnostic performance, followed by miR-221 (area under the curve = 0.845), miR-21 (area under the curve = 0.836), WNT5A (area under the curve = 0.809), PDCD4 (area under the curve = 0.809), and PI3KCA (area under the curve = 0.800). MGMT promoter methylation status was associated with high miR-221 levels. Moreover, patients with VEGFA overexpression and downregulation of TOM34 and BAX had poor overall survival. Nevertheless, miR-17, miR-221, and miR-326 downregulation were significantly associated with high recurrence rate. Multivariate analysis by hierarchical clustering classified patients into four distinct groups based on gene panel signature. In conclusion, the explored microRNA–target dysregulation could pave the road toward developing potential therapeutic strategies for glioblastoma multiforme. Future translational and functional studies are highly recommended to better understand the complex bio-molecular signature of this difficult-to-treat tumor.
Introduction
Glioblastoma multiforme (GBM; astrocytomas, World Health Organization (WHO) grade IV) is the most common and most aggressive primary brain tumors, characterized by excessive invasion, metastasis, and angiogenesis.1,2 It has an overall median survival of only 15 months. 3 Apart from some environmental factors that are known to be associated with brain tumors,4–8 mutations or silencing of tumor suppressor genes represented major genetic alterations and syndromes in glioblastoma tumors.9,10 According to these genetic and epigenetic aberrations, The Cancer Genome Atlas (TCGA) and other research groups have identified at least four molecular subtypes of glioblastoma: classical, proneural, mesenchymal, and neural.11,12 Understanding the molecular mechanisms of these genetic deregulations is mandatory for designing more efficient diagnostic modalities and targeted therapeutic strategies for glioblastoma patients.
MicroRNAs (miRNAs) are small noncoding RNAs, about 19–24 nucleotides in length, involved in silencing of genes via translational repression and/or messenger RNAs’ (mRNAs) degradation. 13 They act as maestros, fine-tuning hundreds of targets simultaneously involved in various cellular biological processes and pathways, such as cell cycle, apoptosis, differentiation, invasion, and metastasis. 14 They can act as tumor suppressors that prevent cancer development by negatively inhibiting oncogenes and/or cell differentiation genes or may function as oncogenic miRNAs (oncomiRs) targeting several apoptotic and tumor suppressor genes. 15 Each miRNA is predicted to regulate many targets, and each target mRNA can be controlled by multiple miRNAs and, accordingly, the co-regulation of these molecules through complex regulatory networks could have a great impact on gene expression and almost every cellular process. 16 The miRNAs’ aberrant signature has been reported in diverse human cancers 13 including brain tumors.2,3 In GBM, several isolated and clustered miRNAs have been found to be differentially expressed between tumor and normal tissues, and some of them have also been associated with disease progression and outcome. In this study, we hypothesized that the analysis of the expression profile and correlation with patients’ clinical outcome and survival of most significantly bioinformatically detected and previously experimentally validated panel of different miRNAs and some of their putative target genes in glioblastoma specimens could provide relevant information about these miRNAs as genetic biomarkers, particularly in our population and could also provide new insights for future miRNA-based therapy.
The selected panel included miRNAs (hsa-miR-34a, hsa-miR-16, hsa-miR-17, hsa-miR-21, hsa-miR-221, hsa-miR-326, and hsa-miR-375), some functionally validated target genes of these miRNAs that were implicated in cancer-related processes such as cell-cycle regulation (eukaryotic transcription Factor 3 (E2F3)), 17 cancer cells’ progression (phosphatidylinositol-4,5-bisphosphate 3-kinase catalytic subunit alpha (PI3KCA) 18 and translocase of outer mitochondrial membrane 34 (TOM34)), 19 cell migration (wingless-type family member 5A (WNT5A)), 20 apoptosis regulation (programmed cell death protein 4 (PDCD4) 21 and DNA fragmentation factor subunit alpha (DFFA)), 22 tumor invasion (epidermal growth factor receptor (EGFR)), 23 and three proteins either related to angiogenesis (vascular endothelial growth factor (VEGF)) 24 or involved in apoptosis (B-cell CLL/lymphoma 2 (BCL2) and BCL2-associated X protein (BAX)) 25 (Figure 1).

The cross-talk between the bioinformatically selected microRNAs and target genes. MicroRNAs are in pink, target genes in blue, and target proteins in green.
Materials and methods
miRNAs’ panel selection by bioinformatics tools
Several computational web servers were used to identify the curated miRNAs involved in glioblastoma disease—(1) DIANA-miRPath v3.0 software (http://www.microrna.gr/miRPathv2): pathway analysis was performed using KEGG Reverse Search and DIANA-TarBase v7.0 pipelines for retrieving experimentally validated miRNAs targeting glioma pathway (KEGG hsa05214), 26 via applying default settings at microT threshold of 0.8, p-value threshold of 0.05, and enrichment analysis method using Fisher’s exact test (hypergeometric distribution), and (2) miRTarBase database Release 6.0 (http://mirtarbase.mbc.nctu.edu.tw/) that contains the largest amount of experimentally validated miRNA–target interactions (MTIs) tested by reporter assay, western blot, northern blot, quantitative reverse transcription (qRT)-polymerase chain reaction (PCR), microarray, and next-generation sequencing experiments (CLP-seq, Degradome-seq, and CLASH-seq) was used to check the selected miRNAs’ panel.27,28 The following seven miRNAs were selected: hsa-miR-34a-5p, hsa-miR-16-5p, hsa-miR-17-5p, hsa-miR-21-5p, hsa-miR-221-3p, hsa-miR-375-3p, and hsa-miR-326-3p (Table 1).
Bioinformatically selected microRNA panel.
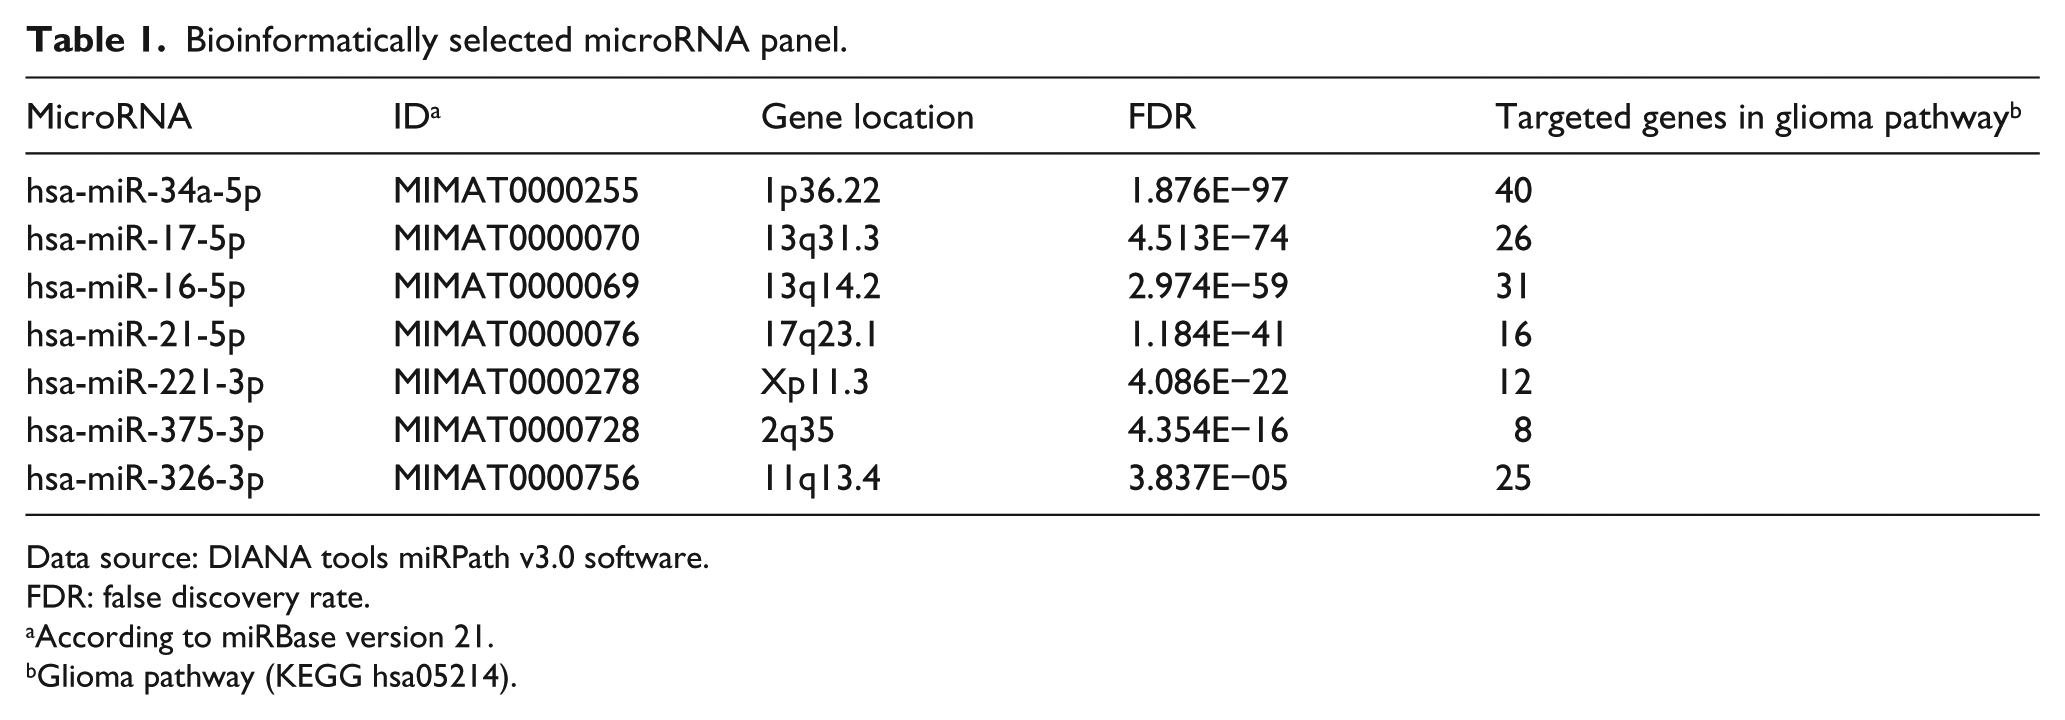
Data source: DIANA tools miRPath v3.0 software.
FDR: false discovery rate.
According to miRBase version 21.
Glioma pathway (KEGG hsa05214).
Exploring miRNA–disease interactions
To limit the false-positive recall of each computational algorithm, various web-based miRNA-related database systems have been used to identify putative predictive and experimentally verified targets for the selected miRNAs’ panel, such as (1) microRNA.org, 29 (2) miRDB, 30 (3) miRNAMap version 2.0, 31 (4) miRGator version 3.0, 32 (5) DIANA-TarBase, 26 (6) human microRNA disease database (HMDD) version 2.0, 33 and (7) miRGate. 34 We confirmed that each selected target was predicted by two different algorithms or more. 35 Other integrated databases were used for identifying MTIs and miRNA expression pattern in glioma and glioblastoma including (1) miRCancer Database (updated on 22 March 2016; http://mircancer.ecu.edu/): a miRNA–cancer association database constructed by text mining on literature and illustrating the expression pattern of each miRNA, 36 (2) miR2disease database (http://www.miR2Disease.org), 37 (3) OncomiRDB database for identifying oncogenic and tumor-suppressive miRNAs in glioblastoma (http://bioinfo.au.tsinghua.edu.cn/oncomirdb/), 38 and (4) HMDD v2.0 (http://cmbi.bjmu.edu.cn/hmdd) for exploring miRNA–glioma network from the evidence of genetics, epigenetics, circulating miRNAs, and MTIs. 33 The selected seven genes, targeted by the miRNA panel, were E2F3, PI3KCA, TOM34, WNT5A, PDCD4, DFFA, and EGFR.
Enrichment pathway analysis and functional annotations of selected miRNAs
Gene enrichment in the KEGG glioma pathway (hsa05214) was performed via (1) miRTar human database (http://mirtar.mbc.nctu.edu.tw/human/index.php): identify the biological functions and regulatory relationships between a group of putative miRNAs and protein coding genes in glioma pathway. The following parameters were used: minimal free energy of ≤−10 kcal/mol, alignment score of ≥140, and binding at 3′-untranslated region (UTR), 5′-UTR, and coding sequence (CDS) regions. (2) DIANA-miRPath with the following criteria: genes’ intersection method, p-value threshold of 0.05, microT threshold of 0.8, enrichment analysis method using Fisher’s exact test (hypergeometric distribution), and false discovery rate (FDR) correction pathways’ union method. 26
Study participants
This study included 43 formalin-fixed paraffin-embedded (FFPE) specimens of GBM patients (12 females and 31 males, age 38–62 years old) and 10 FFPE non-neoplastic brain tissues assessed retrospectively from the archive of the Pathology Departments, Mansoura University, and Suez Canal University Hospitals, Egypt, from 2010 to 2013. Detailed patients’ data were retrieved from their follow-up records. They had primary GBM grade IV, undergone surgical removal and post-operative irradiation, and followed-up for more than 36 months. There was no any evidence of association with other malignancies. Patient data and samples were treated according to ethical and legal standards adopted by the Declaration of Helsinki 2013. This work was approved by the Medical Research Ethics Committee of Faculty of Medicine, Suez Canal University. All patients gave written informed consent, except for deceased individuals or patients who provided archived tissue samples and cannot be traced.
Histopathology and immunohistochemistry
Histological sections of normal brain and tumor FFPE tissues were examined via a pathologist by light microscopy using hematoxylin and eosin preparation. Tumor sections of grade IV GBM were selected. Paraffin sections (4–5 µm) from tumor tissue and control samples were collected in sterile Eppendorf tubes for molecular analysis, and other sections were mounted on positively charged slides for immunohistochemistry (IHC). The following apoptotic and angiogenic markers were examined: BCL2, Bax, and vascular endothelial growth factor A (VEGFA), respectively. They are targeted by miR-34a, miR-17, miR-16, and miR-375 (Figure 1).
In brief, following deparaffinization in xylene and alcohol, antigen retrieval was performed in Tris-ethylenediaminetetraacetic acid (EDTA; pH 9.0) in a microwave oven at 800 W for 20 min and then cooled at room temperature. After rinsing and blocking with peroxidase for 10 min, rabbit polyclonal IgG antibodies to VEGFA (GeneTex; GTX102643; diluted at 1:300), Bax (GeneTex; GTX109683; diluted at 1:300), and BCL2 (GeneTex; GTX100064; diluted ats 1:200) were applied. Incubations were carried out in a humidity chamber overnight at 4°C, followed by washes with phosphate buffer saline (PBS) buffer (pH 7.6) three times for 2 min each. The biotinylated secondary antibodies were applied and then washed with PBS solution. Slides were further incubated with poly horseradish peroxidase (HRP; Genemed Biotechnologies, USA; cat no. 54-0017) for 15 min and rinsed as before. Finally, 3,3-diaminobenzidine (DAB; 1:1 DAB chromogen and DAB buffer) was used as a chromogenic substrate. Slides were lightly counterstained with hematoxylin, dehydrated in ethanol, cleared in xylene, and mounted with DPX. Negative controls were performed using PBS in place of the primary antibody. Brain tumor samples previously characterized for overexpression of IHC markers were used as positive tissue controls. 39
For the IHC assessment, examination of all prepared slides from each specimen was done with an Olympus CX31 light microscope. Photographs were obtained from a PC-driven digital camera (Olympus E-620) and analyzed by Cell (Olympus Soft Imaging Solution GmbH). Cytoplasmic expression of BCL2, Bax, and VEGFA in brain and tumor cells was recorded. In addition, the expression of VEGF was observed in blood vessels. The average number of cells with positive immunostaining was counted, and the percentage of cells was calculated. 40 For overall positivity, immunostaining in >5% of cells was considered positive, and ≤5% positive cells was considered negative. The semi-quantitative scoring method that evaluates the percentage of positive cells was categorized into weak (6%–30%), moderate (31%–70%), and strong staining (71%–100% of positive cells) by two independent investigators with discrepancies agreed upon by consensus.
RNA extraction
Total RNA, including small RNAs, was extracted from sections of FFPE specimens using the Qiagen miRNeasy FFPE Kit (Qiagen, Hilden, Germany; 217504) according to the manufacturer’s protocol. RNA quality measurements have been followed as described previously, 41 and its concentration and purity were assessed with NanoDrop ND-1000 spectrophotometer (NanoDrop Tech., Inc. Wilmington, DE, USA).
Reverse transcription
Total RNA was converted into complementary DNA (cDNA) using both high-capacity cDNA Reverse Transcription (RT) Kit (Applied Biosystems, Foster City, CA, USA; P/N 4368814) with RT random primers and TaqMan™ MicroRNA RT Kit (P/N 4366596; Applied Biosystems) with miRNA-specific stem–loop primers and the endogenous control primer of small nuclear RNA 6B (RNU6B). RT was carried out in a TProfessional Basic, Biometra PCR System (Biometra, Goettingen, Germany) as previously described.13,42 Appropriate controls were included in each experiment.
miRNA and gene expression profiling
The real-time PCRs were performed in accordance with the Minimum Information for Publication of Quantitative Real-Time PCR Experiments (MIQE) guidelines. Expression of gene panel was quantified using the TaqMan® assays (Applied Biosystems; assay ID Hs00605457_m1 for E2F3, Hs00904054_m1 for PI3KCA, Hs00998537_m1 for WNT5A, Hs00899477_m1 for TOM34, Hs00189336_m1 for DFFA, Hs00377253_m1 for PDCD4, Hs01076090_m1 for EGFR) and TaqMan Universal PCR master mix II, No UNG (2×; Applied Biosystems; P/N 4440043). 42 The PCRs were carried out in the final volumes of 20 µL, including 1.33 µL RT product, 2× TaqMan Universal PCR Master Mix, and 1 µL TaqMan assays. For miRNA quantitation, a final volume of 20 µL was adjusted in duplicate, including 1.33 µL specific RT products, 2× TaqMan Universal PCR Master Mix with UNG, and 20× of 1 µL specific TaqMan RNA assay (assay ID 000426 for hsa-miR-34a-5p, 000391 for hsa-miR-16-5p, 002308 for hsa-miR-17-5p, 000397 for hsa-miR-21-5p, 000524 for hsa-miR-221-3p, 000564 for hsa-miR-375-3p, and 000542 for hsa-miR-326-3p). 13 A total of four TaqMan endogenous control assays were used in the experiments: TATA box binding protein (TBP; assay ID Hs00427620_m1), beta actin (ACTB; Hs02758991_g1), glyceraldehyde-3-phosphate dehydrogenase (GAPDH; Hs99999903_m1), and RNU6B (Hs001093), respectively.43,44 Appropriate negative and positive controls were used. The PCR was carried out using StepOne™ Real-Time PCR System (Applied Biosystem) and incubated as follows: 95°C for 10 min followed by 40 cycles of 92°C for 15 sec and 60°C for 1 min. 14
DNA extraction
DNA extraction from the FFPE sections was done using QIAamp DNA FFPE Tissue Kit (Qiagen; 56404). DNA concentration and purity were then assessed as mentioned in previous RNA extraction section.
Methylation-specific PCR of O-6-methylguanine-DNA methyltransferase promoter
Extracted DNA was subjected to bisulfite treatment using EpiTect Fast DNA Bisulfite Conversion Kit (Qiagen; 59824), resulting in conversion of unmethylated cytosine residues into uracil and leaving the methylated cytosines unchanged. Bisulfite conversion thermal cycler conditions were run according to the manufacturer’s protocol: three steps of denaturation each for 5 min at 95°C, separated by incubation for 25, 85, and 175 min at 60°C in between consecutively and final hold at 20°C. Cleanup of bisulfite-converted DNA was performed according to the Bisulfite Conversion Kit manual, followed by methylation-specific PCR (MSP) using HotStarTaq d-Tect Polymerase (Qiagen), and control reactions in the form of methylated bisulfite-converted DNA, unmethylated bisulfite-converted DNA, and genomic DNA were used in each run to ensure that the PCR primers are specific for the detection of methylated or unmethylated DNA using the following PCR conditions; initial activation step for 10 min at 95°C followed by denaturation for 15 s at 94°C, annealing for 30 s at 59°C, extension for 30 s at 72°C for 30–40 cycles, and final extension for 10 min at 72°C. Gel electrophoresis was run on 3% agarose gel using Tris/borate/EDTA (TBE) buffer, visualized by ethidium bromide staining and photographed by the gel documentation-imaging system with digital camera (Biometra, Göttingen, Germany).
Statistical analysis
R software version 3.3.2 and Statistical Package for the Social Sciences (SPSS) for windows software (version 22.0; IBM SPSS Statistics, USA) were used for data analysis. The software package named PC-ORD version 5 45 was used to run different multivariate analyses. Chi-square (χ2), Fisher’s exact, and Mann–Whitney U (MW) tests were used for comparison. A two-tailed p-value of <0.05 was considered statistically significant. Fold change values of miRNA and gene expression in cancer compared to non-cancer tissues were calculated using delta delta quantitation cycle (Cq). 46
The fold change in mRNA and miRNA expression in each sample was calculated based on the quantitation cycle (Cq) value using the equation of relative quantity = 2−ΔΔCT method, where ΔΔCq = (Cq target gene − Cq TBP)cancer − (Cq target gene − Cq TBP)mean control. 14 As the data did not fit a Gaussian distribution, therefore, expression levels were characterized by their median and ranges from the 25th to the 75th percentile, rather than their mean and coefficient of variation, and nonparametric tests were used for comparisons. The area under the curve (AUC) of receiver operating characteristic (ROC) was used to evaluate the diagnostic performance of miRNA and gene panels under the nonparametric assumption.
Correlation analysis between the variables and panels was performed via Pearson’s and Spearman’s correlation coefficient, respectively. Stepwise multiple linear regression analysis was executed to identify which of the predictors are significantly contributing to GBM disease. The Kaplan–Meier estimator was generated in survival analysis, and log-rank test was used to compare different Kaplan–Meier curves stratified by clinico-pathological features.
For multivariate analysis, data profile was checked for outliers and no transformation was required. Two-way agglomerative hierarchical clustering was performed for combining samples with gene clustering to identify which genes are the most important for classifying GBM patients.
Results
In silico data analysis
DIANA-miRPath v3.0 demonstrated 640 experimentally validated miRNAs’ interaction targeting glioma pathway. Searching in the miRTarBase database by disease-related miRNAs and disease-related MTIs revealed the presence of 118 and 84 miRNAs associated with glioblastoma and glioma, respectively. The selected miRNA panel can target 57 of 132 genes in the glioma pathway (KEGG hsa05214; Supplementary Table S1), in addition to other cancer-related pathways. Mature sequence of miRNAs was retrieved from miRDB and checked for complementary base pairing via microRNA.org.
Characteristics of the study population
Forty-three samples of GBM patients were enrolled in the study. Their age ranged from 38 to 62 years old with mean and standard deviation of 52.1 ± 6.08. Two-thirds of them were males. The most prevalent tumor site was in the frontal lobe representing 48.8% of the study population, whereas temporo-parietal site was the second most common site representing 32.6%. Most patients (86%) did not show recurrence of brain tumors during their lifetime. Nevertheless, 14% of the study population showed recurrence of the tumor at variable intervals. Molecular subtyping of FFPE specimens revealed that only 30.2% of tumors had classic subtype with overexpression of EGFR gene and two-thirds of patients had methylated (O-6-methylguanine-DNA methyltransferase (MGMT) promoter. The average life expectancy was 17.8 ± 5.71 months, ranging from 8 to 29 months. The overall 2-year survival rate for GBM patients was 18.6%. The mean disease-free survival (DFS) of patients was 16.7 ± 5.82 months. Patients’ overall survival (OS) did not show a significant association with other clinico-pathological characteristics (Table 2).
Baseline characteristics of glioblastoma multiforme patients.

Data are shown as number (percentage) or mean ± standard deviation. Molecular subtyping by assessment of EGFR expression. Chi-square test was used. Bold values are considered statistically significant p-Values <0.05.
OS: overall survival; OR: odds ratio; CI: confidence interval; MGMT: O-6-methylguanine-DNA methyltransferase; DFS: disease-free survival.
However, Pearson’s correlation analysis elucidated that tumor site was correlated with gender, OS, and DFS (Supplementary Table S2). Almost all patients with frontal lobe lesions (95.2%) were males; while fronto-temporal brain tumor patients were more abundant among females (62.5%; χ2 = 11.9, p = 0.003), had a shorter DFS (r = 0.316, p = 0.039), and poor OS (r = 0.339, 0.026). Moreover, two-thirds of frontal lesions and all fronto-temporal lesions had methylated MGMT promoter (χ2 = 7.362, p = 0.025).
Analysis of differentially expressed miRNAs and target genes
There was a significant variation in endogenous controls’ expression between cancerous and non-cancerous tissues except for the TBP, thus it was used in the calculations of expression levels (Figure 2). Five miRNAs were found to be significantly overexpressed (notably, hsa-miR-16, hsa-miR-17, hsa-miR-21, hsa-miR-221, and hsa-miR-375) and only hsa-miR-34a was significantly downregulated in brain cancer specimens compared to non-cancer brain tissues. Interestingly, miR-21 and miR-221 had the most upregulated levels of expression (Figure 3(a)–(g)). Regarding target gene expression profile, E2F3, PI3KCA, and WNT5A genes were overexpressed in cancer tissues. In contrast, there was significant downregulation of DFFA, PDCD4, and EGFR in brain cancer tissues (Figure 3(h)–(n)).

Expression levels of candidate housekeeping genes in glioblastoma and non-neoplastic tissues. Values are presented as medians of the quantitative cycle (Cq). The box defines upper and lower quartiles (25% and 75%, respectively) and the error bars indicate upper and lower adjacent limits. Blue and pink boxes represent non-neoplastic and tumor samples, respectively. Mann–Whitney U test was used.
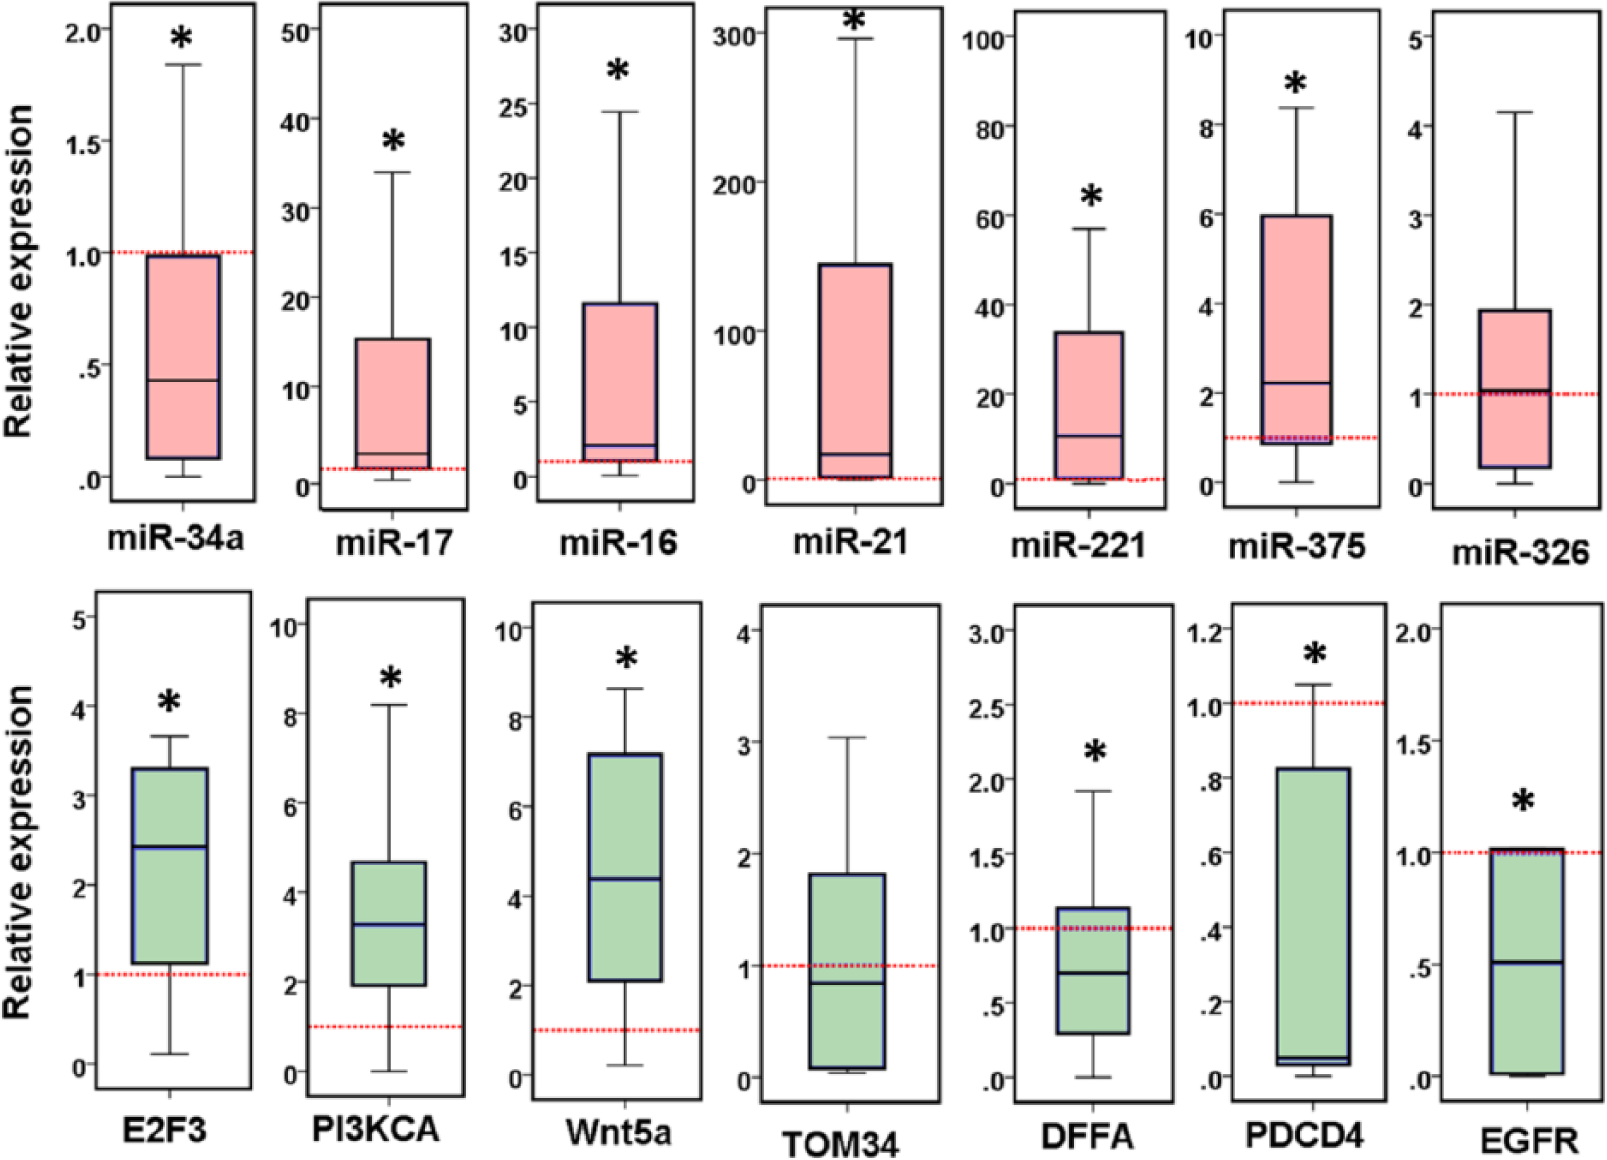
Differential expression of microRNA and gene panel in glioblastoma multiforme patients. Values are presented as medians and quartiles of fold change relative to controls. The box defines upper and lower quartiles (25% and 75%, respectively), and the error bars indicate upper and lower adjacent limits. Fold change was calculated by delta delta threshold cycle method. TATA box binding protein (TBP) was used as an internal control. Non-cancer tissues were set to have a relative expression value of 1.0. Pink box for miRNA panel and green box for mRNA targets. Mann–Whitney U test was used for comparison. *p-Values <0.05 were considered statistically significant.
ROC analysis was used to compare the assay diagnostic performance and to assess the accuracy of the prognostic signature of GBM tumors. In this study, most miRNAs and some target genes showed a highly significant diagnostic value in discriminating between cancer and non-cancerous tissues (Table 3). In brief, it has been revealed that miR-34a (AUC = 0.927) and miR-17 (AUC = 0.900) had the highest diagnostic performance, followed by miR-221 (AUC = 0.845) and miR-21 (AUC = 0.836). However, using a combined panel of the seven miRNAs decreased the diagnostic accuracy (AUC = 0.748) due to the low value of miR-326. On the other hand, despite the high diagnostic performance of three genes, namely, PI3KCA, WNT5A, and PDCD4 to identify GBM disease, multiple gene assays showed lower overall accuracy (AUC = 0.587). Nevertheless, analysis based on both combined miRNA and target gene profiling has suggested a relative improvement of the diagnostic accuracy (AUC = 0.694; Supplementary Figure S2). ROC analysis for predicting OS in GBM patients was executed. As a result, none of the biomarkers used in the study was identified to be a potential prognostic indicator for poor OS (Supplementary Table S3).
The predictive performance of combined miRNA and gene panels for discriminating cancer and non-cancer tissues by ROC analysis.

miRNA: microRNA; E2F3: eukaryotic transcription Factor 3; PI3KCA: phosphatidylinositol-4,5-bisphosphate 3-kinase catalytic subunit alpha; WNT5A: wingless-type family member 5A; TOM34: translocase of outer mitochondrial membrane 34; DFFA: DNA fragmentation factor subunit alpha; PDCD4: programmed cell death protein 4; EGFR: epidermal growth factor receptor.
Correlation analysis between miRNAs and putative targets is shown in Supplementary Table S4. Although complementary base pairing between miRNAs and their predicted targets has been detected by computational tools, none of miRNAs was negatively correlated with their targets. In contrast, there was moderate positive correlation between E2F3 gene and all miRNA panels except miR-16. Additionally, miR-17 was also positively correlated to all studied miRNAs except miR-16.
IHC analysis
Cytoplasmic positivity for VEGFA, BAX, and BCL2 was evaluated in normal and cancer brain tissues (Figure 4). In normal tissue specimens, VEGFA antibody was not detected in 80% of samples and was weakly expressed in one-fifth of them. Nevertheless, moderate to strong expression was observed in two-thirds of tumor GBM samples, and only 6 of 43 samples were not detected. Similarly, the apoptotic regulator BCL2 cytoplasmic staining was absent in normal tissues and significantly highly expressed in brain tumors. In contrast, considerable variable expression of BAX antibody was noted in normal specimens, with no significant difference from that in cancer tissues (Figure 5).

Immunohistochemical staining of paraffin-embedded glioblastoma multiforme. VEGF: negative staining in normal brain tissue (×200; photograph 1) while mild to moderate cytoplasmic staining in glioblastoma ((×200; photograph 2), (×400; photograph 3), and (×400; photograph 4)). Bax staining showed scattered cells with positive cytoplasmic staining in normal brain (×200; photograph 5), negative staining in glioblastoma (×200; photograph 6), and mild cytoplasmic staining in glioblastoma (×400; photograph 7) and gliosarcoma (×200; photograph 8). BCL2: low-grade astrocytoma with weak expression of BCL2 (×200; photograph 9), in contrast to strong diffuse cytoplasmic expressions in glioblastoma (×200; photograph 10 and ×400; photograph 11) and gliosarcoma (×200; photograph 12).

Expression levels of protein panel in normal brain and glioblastoma samples. Chi-square test was used for comparison. *p-Values <0.05 were considered statistically significant.
Association between expression profile and patient characteristics
Univariate association analysis revealed a higher expression profile of miR-17, miR-221, and E2F3 in elder GBM patients (p = 0.011, 0.024, and 0.003, respectively). Additionally, miR-34a and its target PI3KCA were significantly associated with gender and classical molecular subtype of brain cancer (all p < 0.05). Likewise, these same two genes along with miR-375 and WNT5A were differentially expressed according to the tumor site (all p < 0.05). Moreover, overexpression of VEGFA and downregulation of TOM34 and BAX were associated with poor OS (all p < 0.05). Patients with lower expression of TOM34 and BAX had shorter DFS (p = 0.016). Nevertheless, miR-17, miR-221, and miR-326 downregulation were significantly associated with high recurrence rate (p = 0.003, 0.020, and 0.017, respectively). In contrast, MGMT promoter methylation status was associated with high miR-221 levels (p = 0.050; Figure 6). Correlation analysis between both miRNAs and putative targets and clinical characteristics of glioblastoma patients are shown in Table 4.

Association analysis of miRNA and gene panels and clinico-pathological characteristics. Values are presented as medians and quartiles of fold change relative to controls. The box defines upper and lower quartiles (25% and 75%, respectively), and the error bars indicate upper and lower adjacent limits. Fold change was calculated by delta delta threshold cycle method. Pink box for miRNA panel, green box for mRNA targets, and blue box for protein panel. #Versus first group. Kruskal–Wallis and Mann–Whitney U tests were used. Post hoc test (Bonferroni test) was performed for comparison. Low overall survival, ≤15 months; short disease-free survival, ≤15 months; tumor site, F for frontal, FT for fronto-temporal, and TP for temporo-parietal; NR, non-recurrent; R, recurrent.
Correlation analysis between microRNA–target expression profile and clinico-pathological parameters.
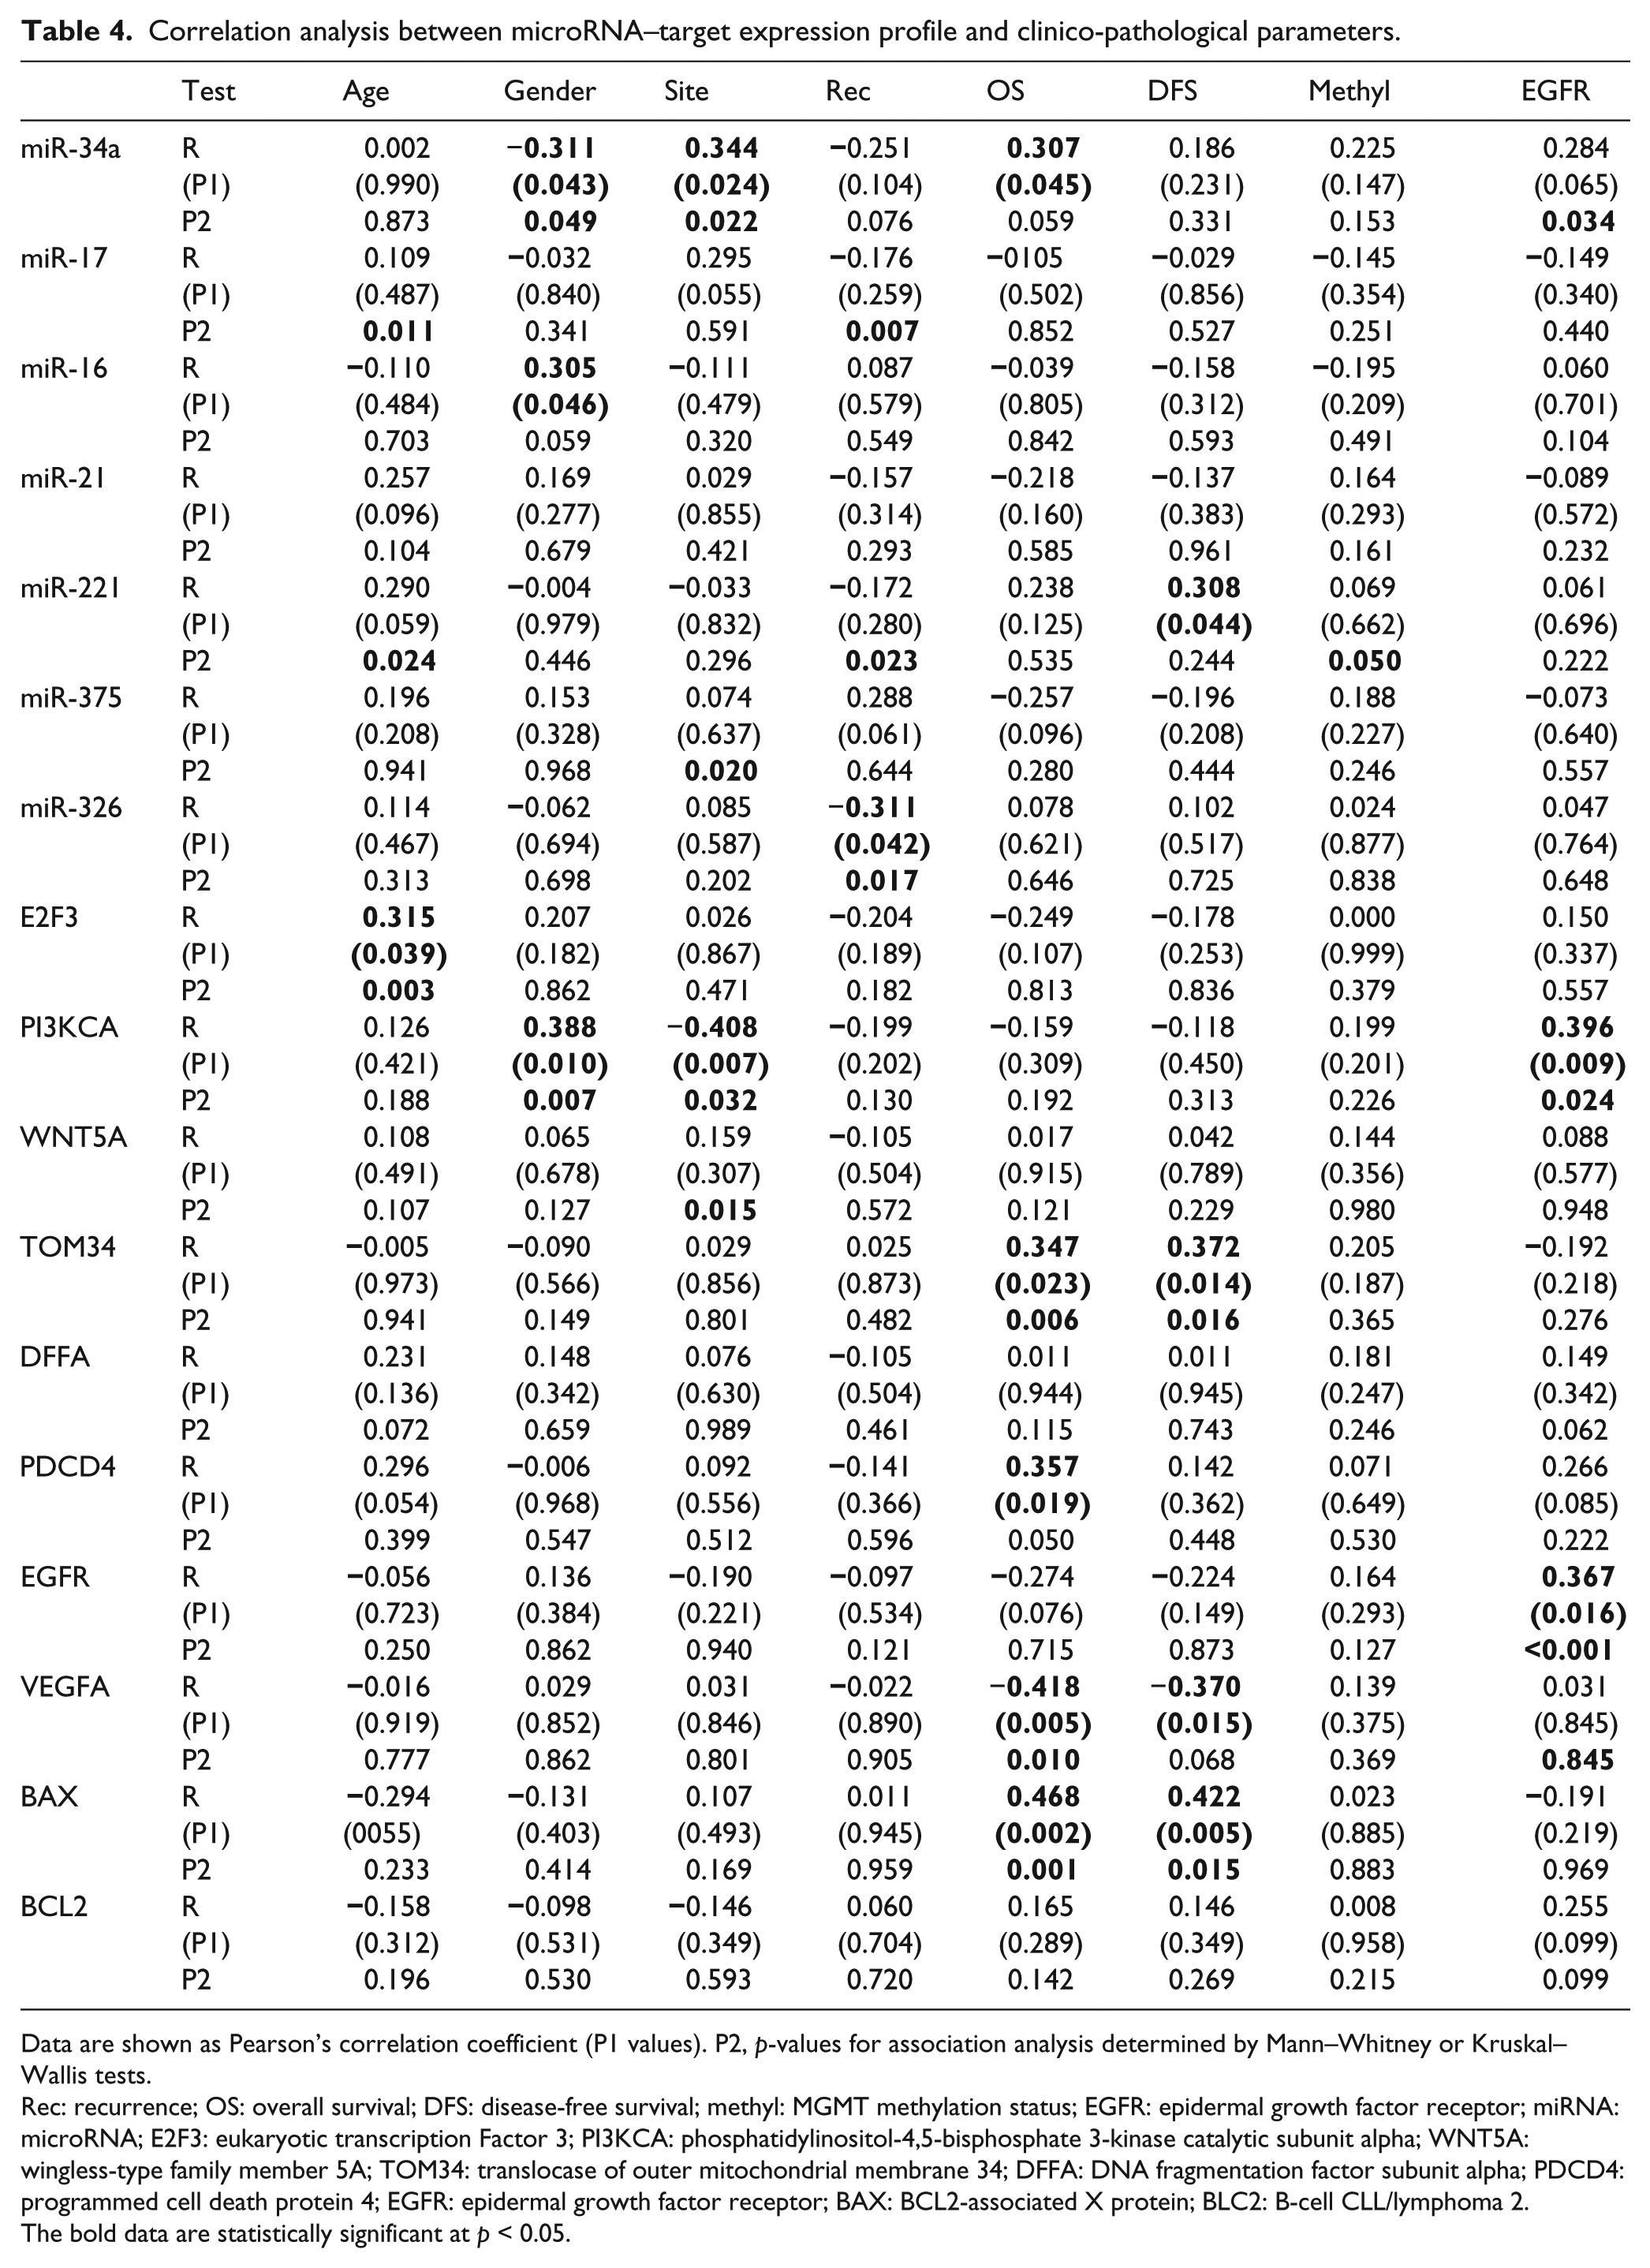
Data are shown as Pearson’s correlation coefficient (P1 values). P2, p-values for association analysis determined by Mann–Whitney or Kruskal–Wallis tests.
Rec: recurrence; OS: overall survival; DFS: disease-free survival; methyl: MGMT methylation status; EGFR: epidermal growth factor receptor; miRNA: microRNA; E2F3: eukaryotic transcription Factor 3; PI3KCA: phosphatidylinositol-4,5-bisphosphate 3-kinase catalytic subunit alpha; WNT5A: wingless-type family member 5A; TOM34: translocase of outer mitochondrial membrane 34; DFFA: DNA fragmentation factor subunit alpha; PDCD4: programmed cell death protein 4; EGFR: epidermal growth factor receptor; BAX: BCL2-associated X protein; BLC2: B-cell CLL/lymphoma 2. The bold data are statistically significant at p < 0.05.
According to the stepwise linear regression analysis, all clinico-pathological parameters and expression panels were included; TOM34 and VEGFA levels and tumor site were independent predictors of poor OS in GBM disease (Table 5). This was consistent with survival analysis results (Supplementary Table 4). Kaplan–Meier survival plot demonstrated poor OS in GBM patients with downregulated TOM34 and PDCD4 gene expression and overexpressed VEGFA protein (Figure 7).
Multivariable regression analysis to identify predictors for poor overall survival.

Dependent variable: overall survival.
TOM34: translocase of outer mitochondrial membrane 34.
Predictors: (Constant), TOM34.
Predictors: (Constant), TOM34, VEGFA.
Predictors: (Constant), TOM34, VEGFA, site.

Kaplan–Meier analyses of estimated overall survival (OS) and disease-free survival (DFS) in relation to (a) TOM34, (b) PDCD4, and (c) VEGFA expression in glioblastoma brain tumors. Values are represented as medians. The log-rank test was used for comparison.
Multivariate cluster analysis
Hierarchical clustering technique was run. Dendrogram in Figure 8 represented the relationship between GBM patients to measure their similarity with each other according to their expression profile. At the first glance, patients were clustered into four distinct groups; Group 1 (green clade) attained lower expression levels for most genes and miRNAs; in contrast, the other three groups had upregulated expression profile for both panels. In Group 2 (red clade), almost all genes and miRNAs were overexpressed; in Group 3 (orange), miR-34a and miR-326 in addition to the two apoptotic genes PDCD4 and DFFA were downregulated, whereas Group 4 (blue) patients showed similar pattern to Group 3 except for the consistent upregulated miR-326 levels.

Hierarchical clustering classifies glioblastoma patients according to their expression signature. Two-way agglomerative hierarchical clustering was done. Patients were clustered into four distinct groups: Group 1 (green clade) attained lower expression levels for most genes and miRNAs; while the other three groups had upregulated expression profile for both panels. In Group 2 (red clade), almost all genes and miRNAs were overexpressed; in Group 3 (orange), miR-34a and miR-326 in addition to the two apoptotic genes PDCD4 and DFFA were downregulated, whereas Group 4 (blue clade) patients showed similar pattern to Group 3 except for the consistent upregulated miR-326 levels.
Discussion
Molecular phenotyping of GBM has recently attracted much attention in an attempt to identify new targets for diagnostic, prognostic, and therapeutic strategies. This has resulted in growing interest in miRNAs due to their potential regulatory roles in both normal development and pathological conditions such as cancer. 3
In this study, significant upregulation of 5/7 miRNAs (hsa-miR-16, hsa-miR-17, hsa-miR-21, hsa-miR-221, and hsa-miR-375) has been observed in GBM tissues compared to non-cancer tissues. This trend of upregulation for most of the studied miRNAs was in line with Møller et al., 47 findings that the most common aberration in miRNA expression with GBM is upregulation. LeBlanc and Morin, 48 in addition, have confirmed the differential expression of miRNAs in GBM which mediate different cell outcomes. Generally, miRNA expression alterations can be mediated by several mechanisms, including transcriptional regulation variations, miRNA processing abnormalities, miRNA localization impairments, gene mutations, chromosomal aberrations, epigenetic changes, and miRNA biogenesis machinery alterations 49 leading to oncomiRs’ inhibition or tumor suppressor miRNAs’ activation that supports tumorigenesis and/or cancer progression. 3
In this study, miR-17 upregulation showed the highest diagnostic performance in our GBM samples. It has been considered as an important component of the miR-17–92 cluster (including miR17-3p, miR-17-5p, miR-18a, miR-19a, miR-19b, miR-20a, and miR-92a) whose upregulation was evident in GBM tumor samples and cell lines versus normal brain by previous studies.50–58 The miR-17–92 cluster has been shown to possess a variety of tumorigenic properties, mediated through direct targeting of antiproliferative genes as transforming growth factor beta receptor 2 (TGFBRII), mothers against DPP homolog 4 (SMAD4), and calmodulin binding transcription activator 1 (CAMTA1) as well as regulators of angiogenesis and DNA repair connective tissue growth factor (CTGF) and DNA polymerase delta 2, accessory subunit (POLD2). Therefore, inhibition of specific miR-17–92 cluster members decreases viability and increases apoptosis in vitro.54–56 Upregulation of entire miR-17–92 cluster in Myc-induced cancers may increase tumor angiogenesis by a paracrine mechanism. 59 This proangiogenic function has been attributed, in part, to the downregulation of the antiangiogenic molecules. 60 Several studies have indicated that miR-17 could function as an oncogene or tumor suppressor in different cancer types or even in different stages of the same tumor type. Reduced expression of miR-17 was reported in secondary gliomas (Grade IV) compared to the corresponding primary gliomas (Grade II). 54 This observation did not contradict our findings, as all this study’s specimens were primary malignant grade IV gliomas (GBM). In congruence with the miR-17 oncogenic role, inhibition of its upregulation in colon cancer cells could reduce cell proliferation, induce arrest of cells in the G1/S stage, and suppress tumor growth by regulating RND3, a negative regulator of cell proliferation and cell-cycle progression. 61
The oncomiR miR-221 was the second most discriminator upregulated oncomiR in our samples that could discriminate between GBM tissues versus non-cancer tissues. This observation was in line with the miR-221 role in GBM that has been displayed previously by several investigators, especially its effect on G1/S progression through targeting important cell-cycle regulator, namely, p27 and alteration of p53 upregulated modulator of apoptosis (PUMA), a pro-apoptotic protein in glioma.62–67 Recently, it has been suggested to promote human glioma cell invasion and angiogenesis by targeting tissue inhibitor of metalloproteinase-2 (TIMP2), 68 and its knockdown has been reported to inhibit cell proliferation and invasion through Semaphorin 3B (SEMA3B), which acts as a tumor suppressor in glioma. 69 Interestingly, we found that high miR-221 levels were associated with MGMT (coding for a DNA repair enzyme ubiquitously expressed in normal tissues and works alone without other DNA repair systems) 70 promoter methylation status. This finding was consistent with Quintavalle et al. 71 who showed that upregulated miR-221/222 in their GBM patients were targeting MGMT mRNA and rendered cancer cells unable to repair the genetic damage and the chromosomal rearrangements induced by miR-221/222 high levels, contributing to the oncogenic features of these miRNAs to glioma cells. Nevertheless, we found that miR-221 downregulation was significantly associated with high recurrence rate. This could be explained by that re-expression of MGMT mRNA renders the cancer cells more resistant to alkylatig agents as they have the ability to repair the induced base mismatch implemented by these agents and thus increase the opportunity of recurrence.
MiR-21 was also one of the most widely investigated miRNAs that could be a promising biomarker in glioma diagnosis and prognosis.72–74 Our finding of significant miR-21 upregulation with high diagnostic ability in the study samples adds up to the results of the preceding studies which demonstrated a constant pattern of upregulation in GBM.52,57,75–79 It has been found that the tumorigenic property of GBM cell lines was decreased after forced downregulation of miR-21. This could be partly mediated by cessation of miR-21 inhibition on its potential target genes: acidic nuclear phosphoprotein 32 family member A (ANP32A); SWI/SNF-related, matrix-associated, actin-dependent regulator of chromatin, subfamily A, member 4 (SMARCA4); phosphatase and tensin homolog (PTEN); Sprouty RTK signaling antagonist 2 (SPRY2); and Leucine rich repeat binding FLII interacting protein 1 (LRRFIP1).80–83 In addition, this reduction was reported to be associated with a decrease in the protein levels of key components of proliferation-linked signaling pathways (e.g. NF-κB and Ras). 82 These observations were further validated by decreased tumor growth in immunodeficient mice.81,84,85 miR-21 inhibition causes significantly increased levels of caspases, leading to a rise in apoptosis, mediated by decreased targeting of heterogeneous nuclear ribonucleoprotein K (HNRNPK), tumor protein P63 (TAp63), and PDCD4.81,85,86 Moreover, transfection with antisense-miR-21 has been shown to significantly increase GBM cell line sensitivity to both radio- and chemotherapy.87,88 Other researchers, in addition, have reported further cancer-related targets for miR-21, including stromal antigen 2 (STAG2) which is cleaved at the transition from metaphase-to-anaphase of the cell cycle to enable chromosomes’ segregation and encode one subunit of a cohesion protein that is required for sister chromatids’ cohesion after DNA replication, CDC25A (cell division cycle 25A), which has been speculated to be an emerging therapeutic target in GBM as it correlated with Ki-67 labeling index, serine- and arginine-rich splicing factor 3 (SFRS3) which is involved in ribosomal RNA (rRNA) and mRNA processing, and CCR4-Not transcription complex subunit 6 (CNOT6) which implicated in cell-cycle arrest and relates miR-21 to p53-dependent pathway.57,89
MiR-375 is a widely prevalent miRNA in various tissues, and in contrary to our observation, it has been reported to be significantly decreased in many cancer types (e.g. hepatocellular carcinoma, esophageal carcinoma, gastric cancer, head and neck cancer, melanoma and glioma).90–94 However, it has been reported to be upregulated in estrogen receptor α–positive breast cancer cell lines, 95 lymph node–negative breast cancer tissues, 96 and primary prostate carcinoma. 97 This latter oncogenic role of miR-375 could support its upregulation in the current GBM samples and confirm the fact that miRNA function may vary in some cancers depending on the cellular context and transcriptomes’ cross-talk.
The miRNA which showed high connectivity with the predicted targets in this study was miR-16. It has been shown to potentially target 6/7 of quantified mRNA targets and 1/3 of IHC-detected proteins. Although our results did not recapitulate Li et al.’s 98 and Yang et al.’s 99 findings who have shown lower miR-16 expression in human glioma cell lines and brain glioma tissues than in non-cancerous brain tissues, respectively, an accumulating evidence showed that upregulated miR-16 could have a role in glioma progression as evidenced by Malzkorn et al., 54 who identified 12 upregulated miRNAs including miR-16 among 157 miRNAs’ expression profiles of four secondary glioma patients studied, and Dong et al. 100 who identified miR-16 as one of their top 19 differentially expressed miRNAs with the largest damage values in their constructed miRNA co-expression network. Furthermore, Rao et al. 53 reported miR-16 as one of the most discriminatory 23-miRNA expression signatures detected by their prediction analysis of microarray which precisely distinguished glioblastoma from anaplastic astrocytoma with an accuracy of 95%. Interestingly, they found miR-16 to be downregulated in all investigated glioma cell lines they tested unlike its expression in tumor samples. It is worth to confirm that miRNA expressions are highly variable; especially findings obtained in cell lines could provide results far away from those obtained on tissues. This could be inferred from changes in the cancer cell microenvironment that differ from that of cultured cells.
Applied genetic analyses including gene ontology and pathway enrichment analysis revealed that miR-16 could be involved in the regulation of neurotransmitter transport and levels, long-term potentiation, synaptic transmission, neurotransmitter secretion, nervous system development, nerve impulse transmission, and several neurological system process. 100 The potential role of miR-16 in these cancer-related signaling pathways and nervous system process has been linked to its modulating effects on several experimentally verified targets in human cancers such as CCNE1 (Cyclin E1), “a positive regulator of the cell cycle;” 101 RTN4 that encodes a neuronal protein Nogo-A “which is involved in several processes ranges from axonal fasciculation to apoptosis;” SLC25A22, “solute carrier family 25 (mitochondrial carrier, glutamate), member 22;” and VTI1B, “vesicle transport through interaction with t-SNAREs 1B.” 102
Despite a significant downregulation of miR-326 not evident in GBM tissues relative to non-cancerous tissues, its downregulation was associated significantly with high recurrence rate. This finding is consistent with the suggestive role of miR-326 that could affect the clinical outcome of glioblastoma. Qiu et al. 103 and Wang et al. 104 reported miR-326 upregulation to be significantly associated with long OS and progression-free survival (PFS), especially in high-grade gliomas (III and IV). MiR-326 was initially reported by Kim et al. 105 as one of the neuronal expressed miRNAs and it has been suggested to be a tumor suppressor miR. 106 Kefas et al. 107 found that Notch pathway, which plays key roles in nervous system development and in brain tumors, could interplay with miR-326 in a feedback loop; their partial effect was mediated by inhibition of the other. In addition, mir-326 has been suggested to have a key role in regulation of pyruvate kinase type M2 (PKM2) pathway that affects the metabolism of cancer cells. 108 Glioma cells that exhibited PKM2 high levels have been found to express miR-326 in lower levels. GBM cell line and cancer stem cells (CSCs) PKM2 also knockdown altered growth, invasion, and metabolic activities of these cell types. 108 Targeting smoothened (SMO) within the hedgehog pathway suggested by Du et al. 109 provided another mechanism by which miR-326 could inhibit proliferation, induce apoptosis, and decrease the gliomas stemness. Recently, Nawaz et al. 110 have found that miR-326 downregulation in GBM could be attributed to the aberrant phosphatidylinositol-3 kinase (PI3K) signaling. Altogether, all these reports support the potential therapeutic role of this type of miRNA in gliomas.
Otherwise, we found only miR-34a among the study miRNAs’ panel being significantly downregulated, nearly in 75% of GBM tissue samples and demonstrated high diagnostic performance in discriminating between cancer and non-cancer tissues by ROC analysis (AUC = 0.927). Consistent with our finding, miR-34a role in brain cancer has been investigated in many tumor tissues and cell lines.111,112 Most of these studies reported miR-34a to have a tumor suppressor activity and it regulates numerous pathways involved in cellular proliferation, cell-cycle progression, DNA repair, epithelial–mesenchymal transitions, invasion, migration, and CSC differentiation.111,113–115 Its growth-suppressive functions are reported in some types of cancer such as neuroblastoma, 116 retinoblastoma, 117 oral squamous cell carcinoma, 118 malignant mesothelioma, 119 and melanoma.120,121 MiR-34a, in addition, has been identified to be a direct target of the tumor suppressor Tp53 protein in human and mouse cells in response to DNA damage and oncogenic stress, mediating some pro-apoptotic biological function of this protein.113,122,123 Downregulation of CCND, CDK6, SIRT1, c-Met, Notch1/2, and MYC has been proposed to contribute to miR-34a tumor-suppressive effects.111,124–129 Vo et al. 130 and Silber et al. 131 have also determined other two targets which are known to be amplified in GBM: Musashi1 and platelet-derived growth factor receptor-α (PDGFRA), respectively, to be added to the miR-34a-target list. Interestingly, a negative feedback mechanism between PDGFRA and miR-34a was discovered, implying that the underlying cause of miR-34a downregulation in GBM might be a result of increased PDGF signaling. 131 Furthermore, when our GBM patients were clustered in this study based on their molecular subtype of EGFR expression, miR-34a was significantly associated with the classical subtype. This finding was consistent with Yin et al., 112 results which suggested the tumor suppressor effect of miR-34a was associated with cell-cycle proteins and EGFR expression moderation. They reported mir-34a targeted “Yin Yang-1 (YY1) transcription factor” that can stimulate the expression of EGFR. Altogether, these findings support a promising role of miR-34a as a therapeutic target for GBM patients.
Deregulation of several tumor-related gene expression is a hallmark of GBM. 24 The results of this study indicated a significant upregulation of E2F3, PI3KCA, and WNT5A in GBM tissues as compared to non-neoplastic tissues. E2F3 belongs to the E2F transcription factor family, which is well conserved and widely known for its role in proliferation and cell-cycle progression. 132 The E2F3 gene, located on chromosome 6p22, was found to be amplified in a subset of retinoblastoma, breast, and urinary bladder carcinomas.133–138 Studies performed on human patients consistently revealed that deregulation of E2F3 protein contributes to tumorigenesis, and E2F3 knockdown led to inhibition of glioma cell invasion and proliferation.17,139 This could support the oncogenic role of E2F3 that has been observed in this study.
PIK3CA, also known as p110a, has been found to play a crucial role in tumorigenesis, including GBM.18,140 PI3K/Akt signaling pathway is aberrantly activated in many cancer types, including human gliomas, 141 and triggering this pathway was associated with a more aggressive behavior in human glial tumors and led to rapid clinical and histological tumor progression in a PDGF-driven mouse glioma model. 142
It has been found that the initiation and progression of cancer in several tissues, including the central nervous system (CNS), were associated with Wnt signaling pathway deregulation.143,144 Various members of the Wnt family can activate β-catenin-dependent intracellular signaling. 145 This takes place through the binding of the four canonical Wnts to specific surface receptor 5 complexes which induces stabilization of cytoplasmic β-catenin and promotes its nuclear entry. In the nucleus, β-catenin stimulates the transcription of target genes which promote predominantly glioma cell proliferation via TCF/LEF family of transcription factors. 146 Blockage of this pathway has been found to trigger an anti-neoplastic response. 147 Deregulation/upregulation of WNT5A, in addition, has been related to cancer invasion and metastasis in several solid tumors,148–152 and its overexpression has been associated with high-grade glioma in several studies, confirming its role in glioma proliferation and migration.153–157 Recently, Binda et al. 158 have demonstrated that WNT5A acts as a master regulator of brain invasion, specifically confining a tumor-promoting stem-like character that could provide a targeted therapeutic rationale for GBM patients.
Overexpression of VEGFA was associated with poor OS in this study. This finding is consistent with the contributing role of VEGFA to the growth potential of tumors by activating the PI3K/Akt pathway. Activation of PI3K generates phosphatidylinositol-3,4,5-triphosphate, which, in turn, activates Akt and then activates mammalian target of rapamycin (mTOR), which affect multiple downstream targets involved in cell proliferation, differentiation, and survival that play crucial roles in the development of GBM. 24 This could explain the identification of VEGF as an independent predictor of poor OS in our GBM cases. Hence, several phase I and II trials were ongoing to further evaluate the efficacy of angiogenesis inhibitors as VEGF monoclonal antibody in the treatment of GBM.159,160
Although TOM34 expression did not show significant difference between GBM tissues and non-neoplastic tissues, which could be in part due to the relative small number of included samples, its downregulation was significantly and independently associated with poor OS and shorter DFS. The cytoplasmic protein encoded by this gene binds to the mature portion of unfolded proteins and aids their import into mitochondria, demonstrating a chaperone-like activity. 161 Aleskandarany et al. 19 found that “TOM34 overexpression was significantly associated with shorter breast cancer-specific survival and metastasis-free survival independent of standard prognostic parameters.” In addition, this gene and its encoding protein have been reported to be upregulated in invasive colorectal cancer. 162 However, its detailed biological role in gliomagenesis and progression has not been identified yet. As the mitochondrial machinery dysfunction has long been reported as a common phenotype of cancer cells’ development and progression, 163 TOM34 dysregulation and contribution to GBM development and progression cannot be excluded. This warrants validated functional studies in prospective large-scale studies to explore the possible mechanisms by which TOM34 could be linked to GBM.
The increased immunohistochemical expression of BAX in the current GBM tumor samples was also associated with poor OS and shorter DFS. This protein is encoded by a gene belonging to the BCL2 family and forms a heterodimer with BCL2. It has been reported to interact with and increase the opening of “the mitochondrial voltage-dependent anion channel (VDAC)” which leads to loss of the membrane potential and the release of cytochrome c, mediating its pro-apoptotic activity. BAX expression is regulated by the tumor suppressor P53 and has been shown to be involved in P53-mediated apoptosis. 164 Previously, it has been described as a tumor suppressor in a transgenic mouse brain tumor that suppresses tumorigenesis and stimulates apoptosis in vivo. 25 The downregulation of this protein is considered an important event in cancer development and progression 165 and could explain its association with poor OS in our GBM cases.
Although we have detected complementary base pairing between the study miRNAs and their potential predicted targets by more than two computational tools, none of the study miRNAs was negatively correlated with their targets. Recently, according to Bosia et al.’s 166 stochastic model, they speculated the increase in transcription of one of the miRNA targets that bind to the specific miRNA response elements (MRE) on miRNA, which could decline the availability of this miRNA for repression of other targets sharing the same MRE. This could explain the discrepancy observed in this work between the expression levels of different mRNAs targets for the same miRNA, as not provided all these targets to be in negative linear correlation with their miRNAs. This also was in line with the previous assumption of Sumazin et al. 167 who reported that miRNA–target genes’ regulation by miRNA activity modulators is extensive in glioma and it could affect variable genes with a proven role in gliomagenesis and tumor-subtype classification. Specifically, they speculated miRNA activity modulator to be sponge modulator (i.e. competitive endogenous RNA (ceRNA)) including both noncoding RNAs (ncRNAs) and mRNAs that share miRNA-binding sites with other miRNA targets. Thus, these modulators act as miRNA sponges that decrease the number of available free miRNAs to repress other targets. Otherwise, non-sponge modulators (i.e. they do not share miRNA-binding sites for their modulated targets), including proteins and other RNAs, work by different molecular mechanisms such as RNA-induced silencing complex (RISC)–mediated target regulation activation or suppression, miRNAs’ degradation protection, or miRNA target binding prevention. Furthermore, Hua et al. 168 had raised the question of “whether two oncomiRs could be functional antagonists by promoting different steps in tumor progression?” They had speculated and identified oncomiRs that functionally act as antagonists; one cluster (the agonists), which has been found to be members of the miR-17 family, correlated with E2F and c-Myc-induced genes, and other antagonistic cluster contains miR-221/222 family. According to their patient data analysis, there was a predominance of agonistic miRNAs in certain patients, whereas in another group of patients, antagonists predominated. It is worth to note that both functionally identified agonists and antagonists were significantly upregulated in GBM tissue samples when compared to normal brain tissues; in other words, this means “the functional antagonism does not necessarily mean that they exhibit inverse expression levels.” 169 These interesting findings as well as the previously mentioned evidences could also explain our patients’ stratifications into four distinct groups by the multivariate cluster analysis for their miR target expressions. The clinical relevance of this heterogeneity in GBM patients has been discussed previously by several investigators.169–171 The use of such stratification is still required to be tested for any meaningful therapeutic advantage to GBM patients.
Conclusion
The study findings confirmed that miRNAs’ expression dysregulation and the complex miRNA–mRNA network could play an integral process in almost all aspects related to GBM. This greatly could be helpful in miRNA-based molecular classification of GBM that aids in diagnosis and prognosis prediction as well as targeted molecular therapy. In-depth and larger scale independent future translational studies are necessary to better understand the complex bio-molecular signature of this difficult-to-treat tumor, to validate experimentally all potential target genes identified by the studied miRNAs, and to assess the applicability of the new emerging miRNA-based therapy.
Footnotes
Acknowledgements
The authors thank the Oncology Diagnostic Unit and the Center of Excellence in Molecular and Cellular Medicine, Suez Canal University, Ismailia, Egypt, for providing the facilities for performing the research work. Eman Ali Toraih and Manal Said Fawzy conceived and designed the experiments; Hoda Y Abdallah and Mohammad Hosny Hussein recruited the study samples and clinical patient data; Eman Ali Toraih, Hoda Y Abdallah, Manal Said Fawzy, Nagwa Mahmoud Aly, SAMA, and Aly AM Shaalan, contributed parts of the experiments; Eman Ali Toraih, contributed to the statistical analysis. All authors contributed the reagents and materials needed for this work, and all authors contributed in writing, reading, and approval of the final article.
Declaration of conflicting interests
The author(s) declared no potential conflicts of interest with respect to the research, authorship, and/or publication of this article.
Funding
The author(s) received no financial support for the research, authorship, and/or publication of this article.
References
Supplementary Material
Please find the following supplemental material available below.
For Open Access articles published under a Creative Commons License, all supplemental material carries the same license as the article it is associated with.
For non-Open Access articles published, all supplemental material carries a non-exclusive license, and permission requests for re-use of supplemental material or any part of supplemental material shall be sent directly to the copyright owner as specified in the copyright notice associated with the article.