
Abstract
It is well established that several forms of cancer associate with significant iron overload. Recent studies have suggested that estrogen (E2) disrupts intracellular iron homeostasis by reducing hepcidin synthesis and maintaining ferroportin integrity. Here, the ability of E2 to alter intracellular iron status and cell growth potential was investigated in MCF-7 cells treated with increasing concentrations of E2. Treated cells were assessed for intracellular iron status, the expression of key proteins involved in iron metabolism, oxidative stress, cell survival, growth, and apoptosis. E2 treatment resulted in a significant reduction in hepcidin expression and a significant increase in hypoxia-inducible factor 1 alpha, ferroportin, transferrin receptor, and ferritin expression; a transient decrease in labile iron pool; and a significant increase in total intracellular iron content mainly at 20 nM/48 h E2 dose. Treated cells also showed increased total glutathione and oxidized glutathione levels, increased superoxide dismutase activity, and increased hemoxygenase 1 expression. Treatment with E2 at 20 nM for 48 h resulted in a significant reduction in cell growth (0.35/1 migration rate) and decreased cell survival (<80%) as compared with controls. Survivin expression significantly increased at 24 h post treatment with 5, 10, or 20 nM; however, that of γ-H2AX increased only after survivin levels dropped and only at the 20 nM E2 dose. Minimal upregulation and splitting of caspase 9 was only evident in cells treated with 20 nM E2; no changes in caspase 3 expression were evident. Although Annexin V staining studies showed that E2 treatment did not induce apoptosis, scanning electron microscopy studies showed marked membrane blebbing at 20 nM/48 h of E2. These findings suggest that estrogen treatment disrupts intracellular iron metabolism and precipitates adverse effects concerning cell viability, membrane integrity, and growth potential.
Introduction
It is well established that estrogen (E2, 17-β estradiol) is a carcinogen and has been listed as such by the National Institute of Environmental Health Sciences (NIEHS) since 2003. 1 However, clinical and experimental evidence that have accumulated over the last 70 years suggest that E2 exerts significant anti-cancer effects. 2 Studies conducted in the 1940s have shown that high-dose E2 treatment results in a positive response rate in about 30% of patients, albeit for a short period (<1 year). 3 Subsequent studies confirmed this and concluded that long-term E2 deprivation (equivalent of 5 years post menopause) is needed for high-dose E2 treatment to be effective against breast cancer.3,4 Diethylstilbestrol (DES) was reported to cause tumor regression in E2 receptor positive (ER+) breast cancers at a frequency similar to that of oophorectomy in premenopausal women. 2 It was the standard of care for such patients in the 1960s and early 1970s. 5 However, introduction of the anti-ER tamoxifen in the late 1970s 6 led to the abandonment of E2-based anti-cancer therapies. 2 These studies conducted during the 1980s and 1990s on the efficacy of tamoxifen versus E2 against metastatic breast cancer in postmenopausal women showed similar rates and durations of responsiveness with patients receiving E2 showing longer survival rates. 7 A double-blind placebo-controlled randomized trial involving 10,739 postmenopausal women with a prior hysterectomy concluded that E2 replacement therapy (ERT) reduced the incidence of invasive breast cancer. 8 Long-term E2-deprived ER+ breast cancers have proven especially vulnerable to E2-induced apoptosis.2,3 E2-induced apoptosis occurs through direct E2–ER interactions with E2 response elements (EREs) in genes that induce the intrinsic apoptotic pathway or though unregulated expression of Fas (CD95) and/or Fas-ligand (CD95L) which engages Bcl-2 interacting domain (BID) and Bcl-2 interacting mediator of cell death (BIM) and activates the extrinsic pathway.9,10
Multiple forms of cancer have been shown to experience disruption in intracellular iron metabolism and in signaling pathways involved in intracellular iron homeostasis. Significant iron overload was reported to occur in various forms of cancer including those of the breast.11–15 Increased levels of hepcidin (HEP), ferritin (FT), and labile (exchangeable) iron, decreased levels of ferroportin (FPN), 15 and increased levels of transferrin receptor (TfR1 (CD71)) 13 are consistent findings in breast cancer. Factors that influence intracellular iron homeostasis relate mainly to changes in demand for iron16–18 and inflammation (interleukin 1 (IL-1) and IL-6 among others).17–21 Besides these factors, there is evidence to suggest that E2 manipulates iron metabolism and disrupts iron homeostasis.22–26 E2 treatment was reported to reduce HEP synthesis by interacting with EREs in the HEP gene. 27 E2 treatment was also shown to reduce HEP synthesis by upregulating the expression of hypoxia-inducible factor 1alpha (HIF-1α) in ovarian cancer cell lines ES-2 and SKOV3 28 or by downregulating IL-1 and IL-6 synthesis. 29 E2-induced reduction in HEP synthesis was recently shown to enhance the expression of the major intracellular iron exporter FPN. 26 It is postulated, therefore, that E2 treatment, by downregulating HEP synthesis and enhancing FPN expression, may enhance intracellular iron efflux and depletion and may therefore minimize the ability of cells to divide and grow. Here, we evaluated this possibility by treating MCF-7 cells with increasing concentrations of E2 and testing for intracellular iron content, the expression of key proteins of intracellular iron metabolism, levels of oxidative stress and cell viability, growth, and apoptosis.
Materials and methods
Cells and treatment protocol
The human breast cancer cell line MCF-7 (American Type Culture Collection (ATCC), Manassas, VA, USA) was used throughout this study. Cells were maintained in Dulbecco’s Modified Eagle’s Medium (DMEM) supplemented with 2 μg/mL of insulin, 1 mM of sodium pyruvate, 1 mM of nonessential amino acids, 4 mM of glutamine, 10% fetal calf serum, and antibiotics (penicillin/streptomycin) at 37°C and 5% CO2. Cells were seeded at 0.5–1 × 10⁵ cells/mL in 25 cm flasks; at ~70% confluency, cells were treated with 17-β estradiol (Oestradiol benzoate [Folone]; MISR Co, Egypt) at 5, 10, or 20 nM dissolved in ethanol or treated with 5 µg/mL of doxorubicin hydrochloride (Dox; Sigma-Aldrich, India). Treated cells were cultured for 6, 12, 24, 48, or 72 h prior to harvesting and assessment. Control cultures were either left untreated or treated with equal volumes of 75% ethanol as vehicle.
Western blotting analysis
Cells were lysed in ice-cold NP-40 lysis buffer (1.0% NP-40, 150 mM of NaCl, 50 mM of Tris-Cl, pH 8.0) containing protease cocktail inhibitor tablets (Cat. No. S8830; Sigma, Germany). Whole cell lysate protein concentrations were quantified using the standard Bradford method (Cat. No. 500-0006; Bio-Rad, Hercules, CA, USA). Lysate aliquots containing 30 µg of protein were separated by 12% sodium dodecyl sulfate–polyacrylamide gel electrophoresis (SDS-PAGE) and transferred onto a nitrocellulose membrane (Cat. No. 1620112; Bio-Rad). The membrane was then blocked by 5% skimmed milk powder for 1 h at room temperature, washed with (TBST), and reacted with primary immunoglobulin G (IgG) unlabeled antibodies (anti-HEP: Cat. No. ab57611; anti-FPN: Cat No ab85370; anti-TfR1: Cat No. ab84036; anti-TfR2: Cat No, ab84287; and anti-Hif1-α: Cat No. ab82832; all from Abcam, UK and anti-γH2AX: Cat No. 05-636 from Millipore, Billerica, MA, USA) at 1:1000 dilution overnight at 4°C. The secondary (anti-mouse and anti-rabbit) antibodies (Cat. No. 7076 and 7074; Cell Signaling Technology, USA) were then reacted with the membrane at 1:1000 dilutions for 1 h at room temperature. For oxidative stress enzymes, we used anti-HO-1 (1:5000; Enzo, Farmingdale, NY, USA), anti-MnSOD (1:5000), and anti-Catalase (1:2000; Millipore). The secondary (anti-IgG) antibody (Cat. No. 97040; Abcam) was reacted with the membrane at 1:5000 dilution for 1 h at room temperature. Chemiluminescence was detected using the ECL kit (Cat. No. 32106; Thermo Scientific Pierce, USA). Protein band quantification was carried out using the Bio-Rad Image Lab software (ChemiDoc™ Touch Gel and Western Blot Imaging System; Bio-Rad). β-actin was used as a normalization control and values of control (untreated) samples were defined as 1.00; values of experimental samples were quantified relative to that of control.
Oxidative stress studies
Activity of antioxidant enzymes in MCF-7 cells was measured using the OxiSelect Catalase Activity Assay Kit (Cell Biolabs, Inc., San Diego, CA, USA) for catalase and SOD Assay Kit-WST (Dojindo Molecular Technologies, Inc., Rockville, MD, USA) for superoxide dismutase (SOD) activity. Oxidized glutathione (GSSG) and reduced glutathione (GSH) were measured using the GSSG/GSH Quantification kit (#G257-10; Dojindo Molecular Technologies) as per manufacturer’s instructions.
Immunofluorescence studies
Cells were seeded at 104/mL on sterile poly-
Flow cytometric assessment of intracellular labile iron
Intracellular (labile) iron content was qualitatively assessed as previously described 30 with a slight modification involving the chelator being deferoxamine (DFO) instead of deferiprone, given the noticeable instability of dissolved deferiprone as we experienced it. 27 Briefly, cells were washed twice with PBS; overall, 0.5 × 10⁶ cells were incubated for 15 min at 37°C in the presence of 0.5 µM of calcein acetoxymethyl ester (CA-AM; Cat. No. 56496, Sigma-Aldrich). Cells were then washed twice and treated with DFO (Novartis, Switzerland) at 100 µM. Cells were analyzed by flow cytometry (Becton Dickinson, USA) at a rate of 1000 events/s applying a 488-nm laser beam for excitation. A minimum of 30,000 events were collected/sample and percentage positive staining was computed to the 99% level of confidence. Mean fluorescence intensity (MFI) as presented here represents the geometric MFI of a log-normal distribution of fluorescence signals. All flow cytometric data were analyzed using the FlowJo software with the Watson pragmatic model (Tree Star, Ashland, OR, USA). Given that MFI increases as free iron content decreases, a qualitative measure of the change in labile iron pool (LIP) is calculated as ΔMFI (MFI CA-AM/DFO – MFICA-AMalone) where ΔMFI > 0 indicates LIP availability, while ΔMFI ≤ 0 indicates LIP depletion.
Cell cycle progression analysis
Cell cycle analysis was performed following the protocol described in Prus and Fibach. 31 Briefly, cells were seeded at a density of 1×10⁶ cells/mL. Cells were harvested, washed twice with PBS, re-suspended in 0.5 mL of ice-cold PBS, and fixed with 4 mL of ice-cold 70% ethanol for 48 h. Cells were then pelleted, washed twice with ice-cold PBS, re-suspended, and incubated at room temperature in 0.2 mL of staining buffer in the dark supplemented with 50 μg of RNase and propidium iodide (PI; 50 μg/mL of final concentration). Distribution of cell cycle phases with different DNA contents is determined by flow cytometry (AccuriTM C6; Becton, Dickinson and Company). Analysis of cell cycle distribution and percentage of cells in sub-G1, G1, S, and G2/M phases of the cell cycle were determined using the cell cycle platform of the FlowJo software with the Watson pragmatic model (Tree Star).
Scanning electron microscopy
MCF-7 cells were treated with E2 (20 nM) and Doxorubicin D1515 (Dox; 1.2 mg/mL stock; Sigma) at 5 µg/µL and incubated for 24 or 48 h. Cell pellets were fixed in 2.5% glutaraldehyde (G5882; Sigma) in 0.1 M of cacodylate buffer (C4945; Sigma) at pH 7.3, supplemented with 2% sucrose (84097; Sigma) for 1 h. Cells were washed once with the same cacodylate buffer. Cells were further fixed with 1% osmium tetroxide in cacodylate buffer for 30 min. Cells were then washed with cacodylate and dehydrated through graded ethanol concentrations. After processing, sample cells were dried using critical point dryer. All cells were coated with gold (SC7620, Sputter Coating System, Mini Sputter Coater; Quorum Technology, UK) and examined by scanning electron microscopy (variable pressure Tescan VEGA XM SEM, Tescan Czech Republic).
3-(4,5-Dimethylthiazol-2-yl)-2,5-diphenyltetrazolium bromide cell viability assay
MTT (3-(4,5-dimethylthiazol-2-yl)-2,5-diphenyltetrazolium bromide; Sigma-Aldrich) was used as a colorimetric assay to assess MCF-7 cell viability following E2 treatment. Overall, 104 cells previously treated with E2 or vehicle were grown in 0.2 mL of growth medium in 96-well plates and cultured for 24 h. MTT salt was then mixed with cells and incubated at 37°C for 2 h in a humidified CO2 incubator at 5% CO2. MTT formazan product was dissolved in dimethyl sulfoxide (DMSO) and absorbance was read at 570 nm on a microplate reader.
Assessment of total cellular iron content in cell lysates
Total iron content in cell lysates of E2-treated and control MCF-7 cells was measured on a COBAS C-311/501 auto-analyzer (COBAS C; Roche Diagnostics GmbH, Germany) using commercially available assay kits (IRON2 ACN 661; Cat No. 03183696 122).
Wound-healing assay
MCF-7 cells were seeded at a density of 5×10⁵ on a six-well plate till confluency; the cultures were disturbed by introducing a straight line scratch using a 20 μL pipette tip. Detached cells were removed by washing twice with PBS. The respective cultures were then treated with 5, 10, or 20 nM of E2 or left untreated in media lacking serum for 0, 6, 24, or 48 h. At each time point, multiple images were acquired using an inverted microscope at 10×. Quantitative analysis of the cell migration was performed using ImageJ software (National Institutes of Health (NIH), USA; http://rsb.info.nih.gov/ij/index.html). Migration rate was calculated as, (mean width at 0 h – mean width at time point)/mean width at 0 h.
Statistical analysis
Cell viability, iron studies, oxidative stress, and wound-healing data were analyzed using GraphPad Prism 5 (GraphPad Software Inc., La Jolla, CA, USA); paired t test was used to generate p values for comparisons between groups in each data set.
Results
Treatment of MCF-7 cells with increasing concentrations of E2 resulted in a significant reduction in HEP synthesis. This was especially true for cells treated with 5 and 20 nM of E2 for 48 h, where cells showed a 40% and 70% reduction in HEP synthesis, respectively (Figure 1, top panel). A similar pattern of reduction in HEP synthesis was noted in cells treated with 5 and 20 nM for 6 h. Concurrent with reduced HEP synthesis, the expression of HIF-1α and FPN significantly increased especially at the 20 nM/48 h of E2 dose (Figure 1; second and third panels from top). The expression of TfR1 also significantly increased in cells treated with 5, 10, or 20 nM of E2 at 24 and 48 h post treatment (Figure 1, fourth panel from top). A similar pattern of increased expression was noted for TfR2 at 48 h.
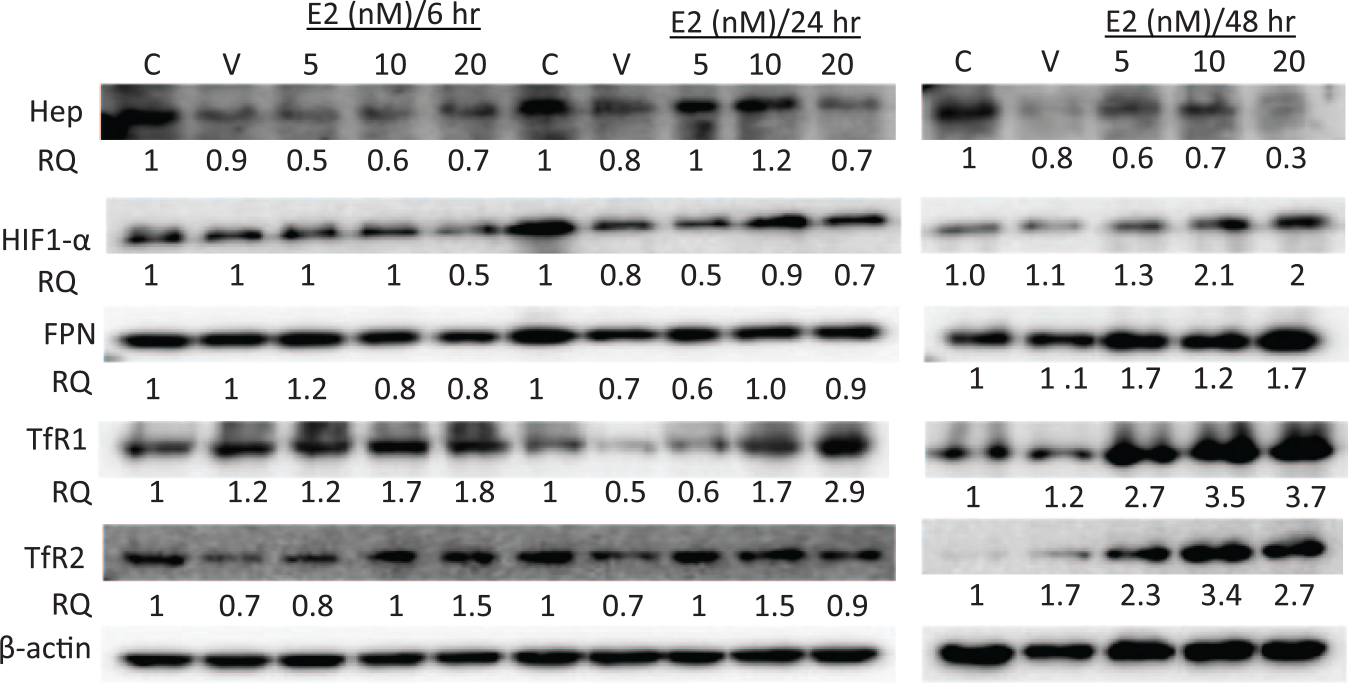
The status of HEP, HIF-1α, FPN, TfR1, and TfR2 in E2-treated MCF-7 cells. Cell lysates were prepared from MCF-7 cells treated with E2 at 5, 10, or 20 nM and cultured for 6, 24, or 48 h. Data shown are representative of four separate experiments; RQ is the relative protein quantity in treated cells as compared to that in untreated controls.
To test whether reduced HEP and increased FPN translated into increased intracellular iron efflux, LIP content was assessed in MCF-7 cells treated with 20 nM of E2 for 24 and 48 h. As shown in Figure 2, labile iron content was depleted following E2 treatment at 24 h (ΔMFI < 0) as compared with untreated cells (ΔMFI > 0). At 48 h however, E2 treatment resulted in increased LIP availability (ΔMFI > 0); ΔMFI for E2-treated cells was much greater than that for controls. Total intracellular iron content and FT expression were also evaluated using lysates obtained from control and treated cells. As shown in Figure 3(a), total iron content was significantly lower in E2-treated cells as compared with untreated cells at 24 h post treatment. The decrease in total iron content in treated cells was dose dependent; in that, the higher the E2 dose, the lower the total iron content. At 48 h post E2 treatment however, treated cells contained significantly higher levels of stored iron as compared with untreated controls; this was especially evident for cells treated with E2 at 5 and 20 nM. Consistent with this finding, significant dose- and time-dependent changes were also observed in intracellular FT content following E2 treatment at 24 and 48 h (Figure 3(b)). In that, cells treated with 5 nM of E2 showed very high levels of FT as compared with that in control cells at 6 h (7/1); FT levels in this group precipitously dropped to levels well below that in control cells (0.3/1) at 48 h. Cells treated with 20 nM of E2 showed higher levels of FT as compared with that in control cells at 6 h (2.4/1), which remained higher than that in controls (1.5/1) at 48 h.

Labile iron pool content in MCF-7 cells following E2 treatment. LIP content in cells treated with 20 nM of E2 was assessed by the calcein-based flow cytometry method. (a) Single-color flow cytometry histogram overlays of unstained controls, calcein stained cells, and calcein stained + chelator (DFO)-treated cells at 24 and 48 h post E2 treatment. (b) Average mean fluorescence intensity (MFI) of histograms obtained from at least five experiments as in (a). The difference in fluorescence intensity when comparing calcein + chelator versus calcein only peaks is indicative of LIP content, the smaller the difference, the lower the amount of LIP. Data presented are the average MFI ± SEM of four separate experiments.

Total intracellular iron content in E2-treated MCF-7 cells. Cell lysates were prepared from untreated control cells or cells treated with 5, 10, or 20 nM of E2 for 24 or 48 h. (a) Total iron content (µg/dL) was measured using commercially available colorimetric kits ran on a COBAS chemistry analyzer. Data shown are the average ± SEM of three separate experiments (duplicate run/experiment). The presence of a significant difference (p <0.05) between the indicated reading and the control reading at the same time point is indicated by *. (b) FT expression was assessed using lysates prepared from untreated cells or cells treated with 5, 10, or 20 nM of E2 for 6, 24, or 48 h; data shown is representative of three separate experiments.
We next addressed the question of whether reduced LIP following E2 treatment altered the redox balance status in treated MCF-7 cells. As shown in Figure 4, E2-treated cells showed a significant increase in total GSH (TGSH) levels especially at 10 nM/24 h dose as compared with untreated cells (p < 0.01; Figure 4(a)). A similar trend was noted for GSSG levels (Figure 4(b)). Catalase activity was significantly lower in E2-treated cells as compared with controls especially at the 10 nM dose (p < 0.01; Figure 4(c)). In contrast, SOD activity was significantly higher in E2-treated cells, mainly at 10 nM (p < 0.01; Figure 4(d)). Furthermore, E2 treatment resulted in a significant upregulation of hemoxygenase 1 (HO-1) protein expression but not that of catalase or SOD (Figure 4(e)).

Oxidative stress levels in MCF-7 cells following E2 treatment. Cells or lysates prepared from untreated controls cells and cells treated with 5, 10, or 20 nM of E2 for 24 h were assayed for (a) total glutathione (tGSH; nM/106 cells), (b) reduced glutathione (GSSH; nM/106 cells), (c) catalase activity (U/mg protein), (d) SOD activity (U/mg protein), and (e) total protein content of HO-1, catalase, and SOD. Data shown are the average ± SEM (for (a), (b), (c), and (d)) of three separate experiments or representative (for (e)) of three separate experiments.
To further investigate the effects of E2-induced oxidative stress and altered redox balance in treated cells, cell viability was assessed by the trypan blue manual counting method (data not shown) and the MTT assay. As shown in Figure 5(a), there was a significant increase in cell survival at 6 h post treatment with 5 (32%), 10 (16%), or 20 nM of E2 (29%). However, a noticeable to significant reduction in cell viability occurred in cultures treated with 5, 10, or 20 nM of E2 for 24, 48, and 72 h, respectively. Notwithstanding the significant reduction in cell viability in cells treated with 20 nM of E2 for 48 (20%) or 72 h (27%), it remained much lower than that observed in cells treated with Dox (53%) at 48 h (Figure 5(b)).
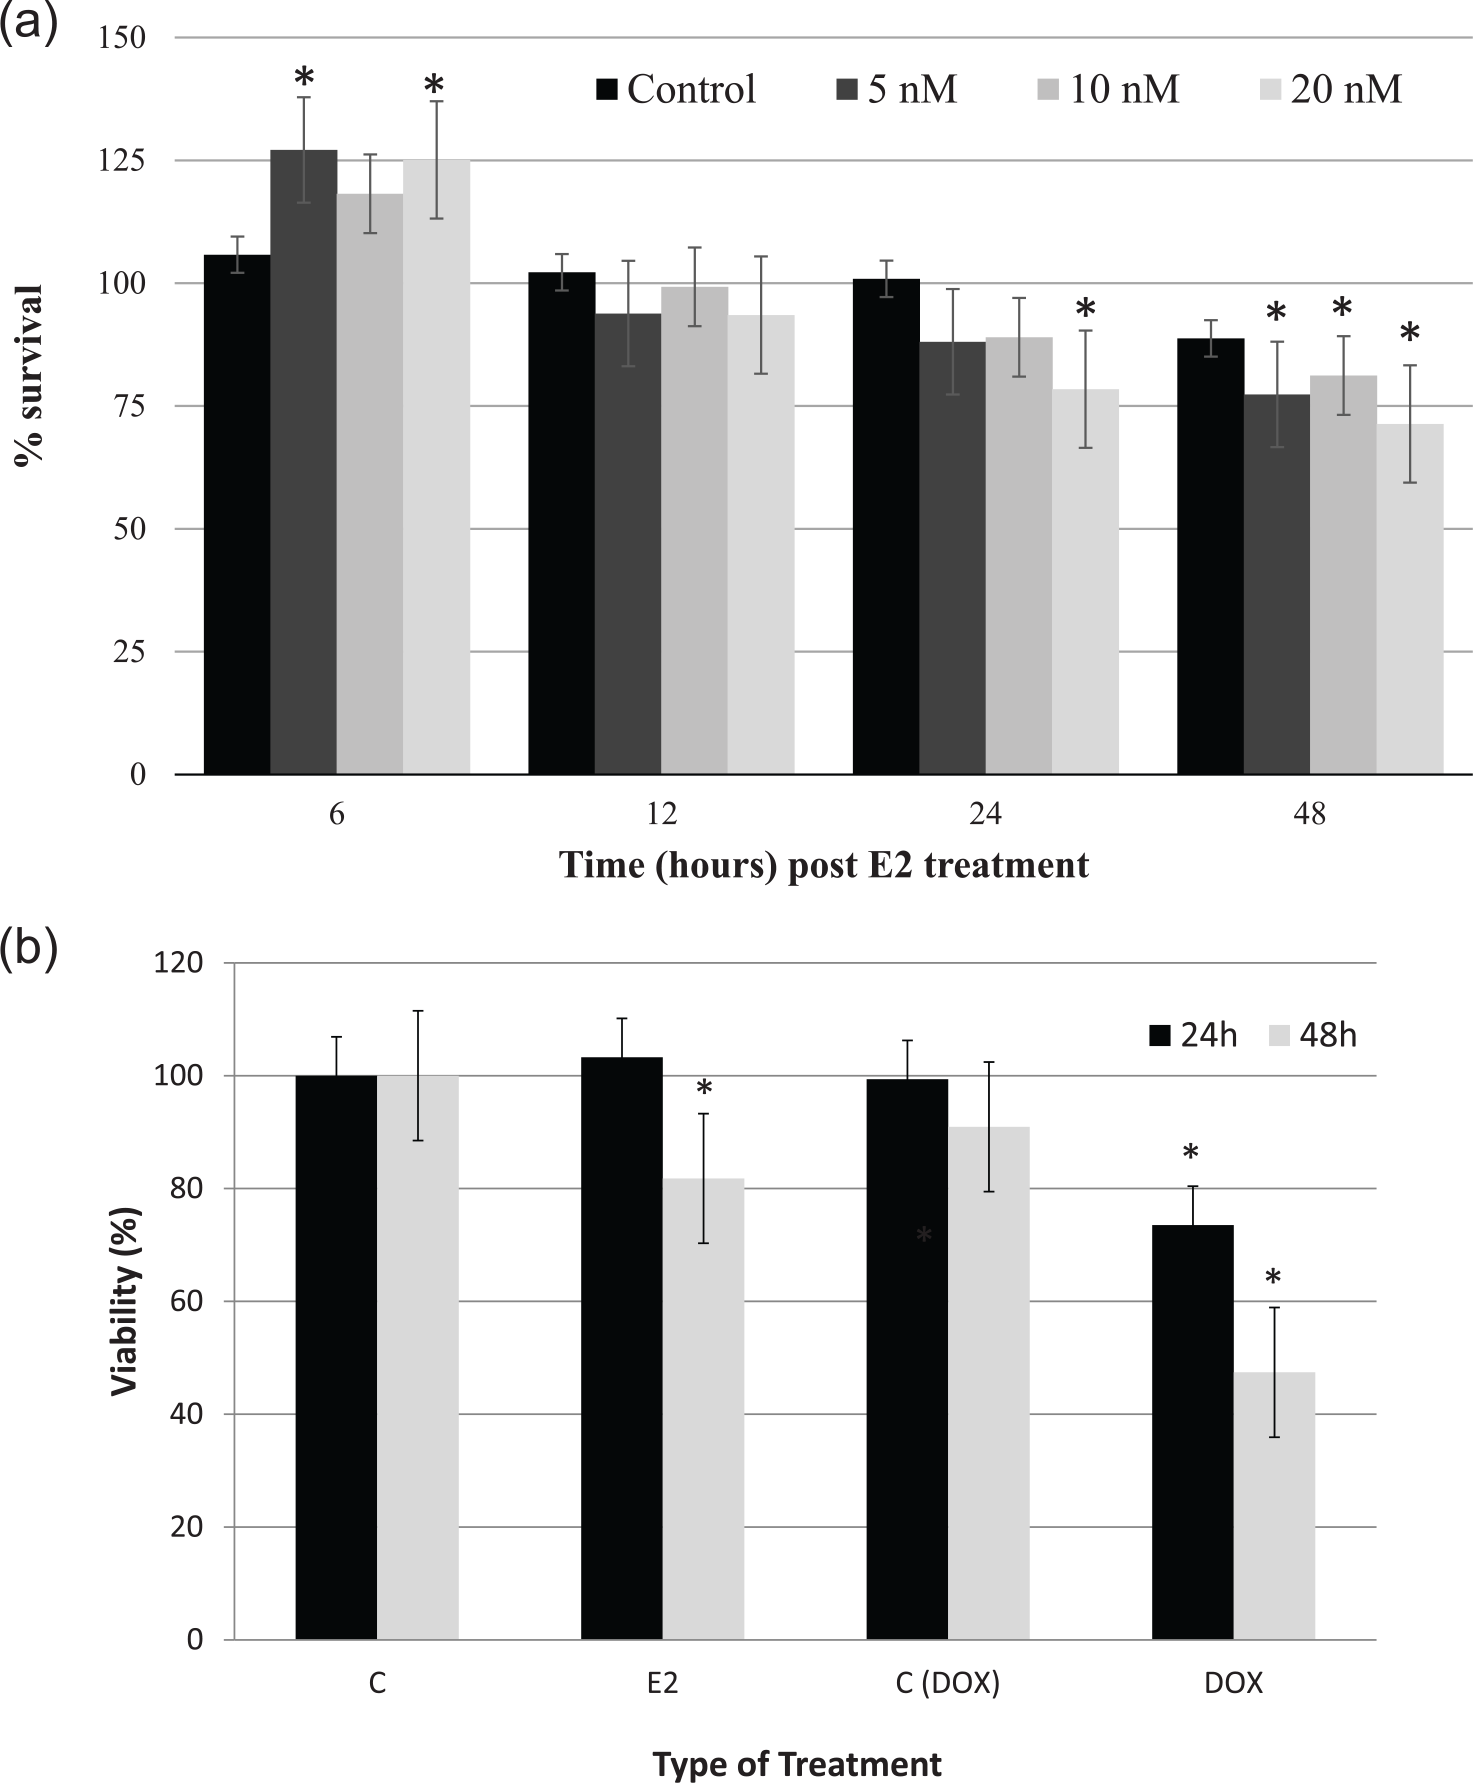
Percentage viability of E2-treated MCF-7 cells. (a) The MTT assay was used to assess the viability of MCF-7 cells treated with 5, 10, or 20 nM of E2 for 6, 24, 48, and 72 h. (b) Rates of cell survival in MCF-7 cells treated with 20 nM of E2 or 5 µg of doxorubicin for 24 or 48 h. Data shown are the average ± SEM of four separate experiments. The presence of a significant difference (p < 0.05) between indicated value and its counterpart at 6 h post E2 treatment (for a) or the counter value of control at same time point (for b) is indicated by *.
The expression of several apoptosis-related proteins was assessed by western blotting using cell lysates from E2-treated and untreated cells. As shown in Figure 6, the expression of survivin significantly increased in cells treated with 5 or 10 nM of E2 both at 24(2.9/1 and 2.2/1 folds) and 48 h (2.2/1 and 1.5/1 folds) as compared with controls. Although cells treated with 20 nM of E2 showed an increase in survivin expression at 24 h (2.1/1 fold), it decreased to levels lower than that in controls (0.7/1 fold) at 48 h. The expression of γ-H2AX significantly upregulated mainly in cells treated with 20 nM for 48 h. No significant change was noted in the expression of caspase 3 irrespective of E2 dose or exposure time and no caspase 3 splitting was evident either. There was a minor increase in total caspase 9 content in cells treated with 20 nM of E2 for 24 (1.2/1 fold) and 48 h (1.5/1 fold) along with a slight generation of caspase 9 split product. As shown in Figure 7, the percentage of pro-apoptotic and apoptotic cells in E2-treated cultures was similar to that of controls both at 24 and 48 h. In contrast, cells treated with Dox showed very high levels of apoptosis. However, β-actin immunofluorescence studies suggested that the integrity of the cytoskeleton of E2-treated cells is negatively impacted by biochemical events following E2 treatment as evidenced by increased β-actin clumping (Figure 8(a)). Furthermore, morphologic evaluation of E2-treated cells by SEM suggested that, like Dox-treated cells, E2 treatment resulted in significant membrane blebbing and damage (Figure 8(b)).

Expression profile of key proteins involved in cells survival, DNA repair, and apoptosis in E2-treated MCF-7 cells. The expression of survivin, caspase 3, caspase 9, and γ-H2AX was assessed in cell lysates prepared from cells treated with 5, 10, or 20 nM of E2 and from control untreated or ethanol-treated (vehicle) cells for 24 and/or 48 h; data shown are representative of four separate experiments.

Assessment of pro-apoptotic and apoptotic MCF-7 cells following E2 treatment. Percentage apoptotic and pro-apoptotic MCF-7 cells treated with 20 nM of E2 for 24 or 48 h was evaluated using the PI/Annexin V flow cytometry method; untreated cells and cells treated with 5 µg/mL of doxorubicin were used as controls. Data shown are representative of three separate experiments.

Cell membrane and cytoskeletal integrity following E2 treatment in MCF-7 cells. (a) Immunofluorescence studies involving the co-staining for β-actin (red) and DNA (blue) were employed to qualitatively assess cytoskeletal integrity in MCF-7 cells treated with 20 nM of E2 for 24 and 48 h. (b) Scanning electron microscopy (SEM) was used to assess membrane blebbing in MCF-7 cells treated with 20 nM of E2 versus untreated cells or cells treated with 5 µg/mL of Dox. Data shown are representative of two (for (a)) or three (for (b)) separate experiments.
To further evaluate the effects of disrupted intracellular iron metabolism and the subsequent damage to cell membrane and cytoskeletal integrity, the ability of E2-treated cells to grow and migrate was assessed by the wound-healing assay. As shown in Figure 9, cells treated with 20 nM of E2 showed growth rates of <10% (0.02/0.225) at 6 h (p < 0.01) and<50% (0.25/0.51 and 0.35/0.9) at 24 and 48 h, respectively (p < 0.05), as compared with untreated controls. Although the growth potential of cells treated with 5 and 10 nM of E2 was lower than that in controls at all time points, it was statistically insignificant (p > 0.05) as compared with that in controls. Cell cycle analysis of E2-treated cells demonstrated an arrest at the G1/S phase of the cell cycle as compared with controls especially at 48 h post treatment (Figure 10(a)). In that, while the percentage of cells at G1 phase was significantly higher (p > 0.05) in E2-treated cells (70.4%) as compared with untreated cells (61.5%), the percentage of cells at S phase was significantly lower (8.4%) than that in controls (12.85%; Figure 10(b)).

Growth potential of MCF-7 cells following E2 treatment. (a) The healing of disrupted cell culture was followed and photographed at 0, 6, 24, and 48 h. Healing was qualitatively assessed by observing wound closure, migration of viable cells to wound area, and the presence of floating dead cells; data shown are representative of two separate experiments. (b) Migration rate of viable cells into wound area both in untreated and E2-treated disrupted cell cultures was measured at 6, 24, and 48 h, using the formula: migration rate = (mean width at 0 h – mean width at time point (6, 12, or 24 h)/mean width at 0 h).
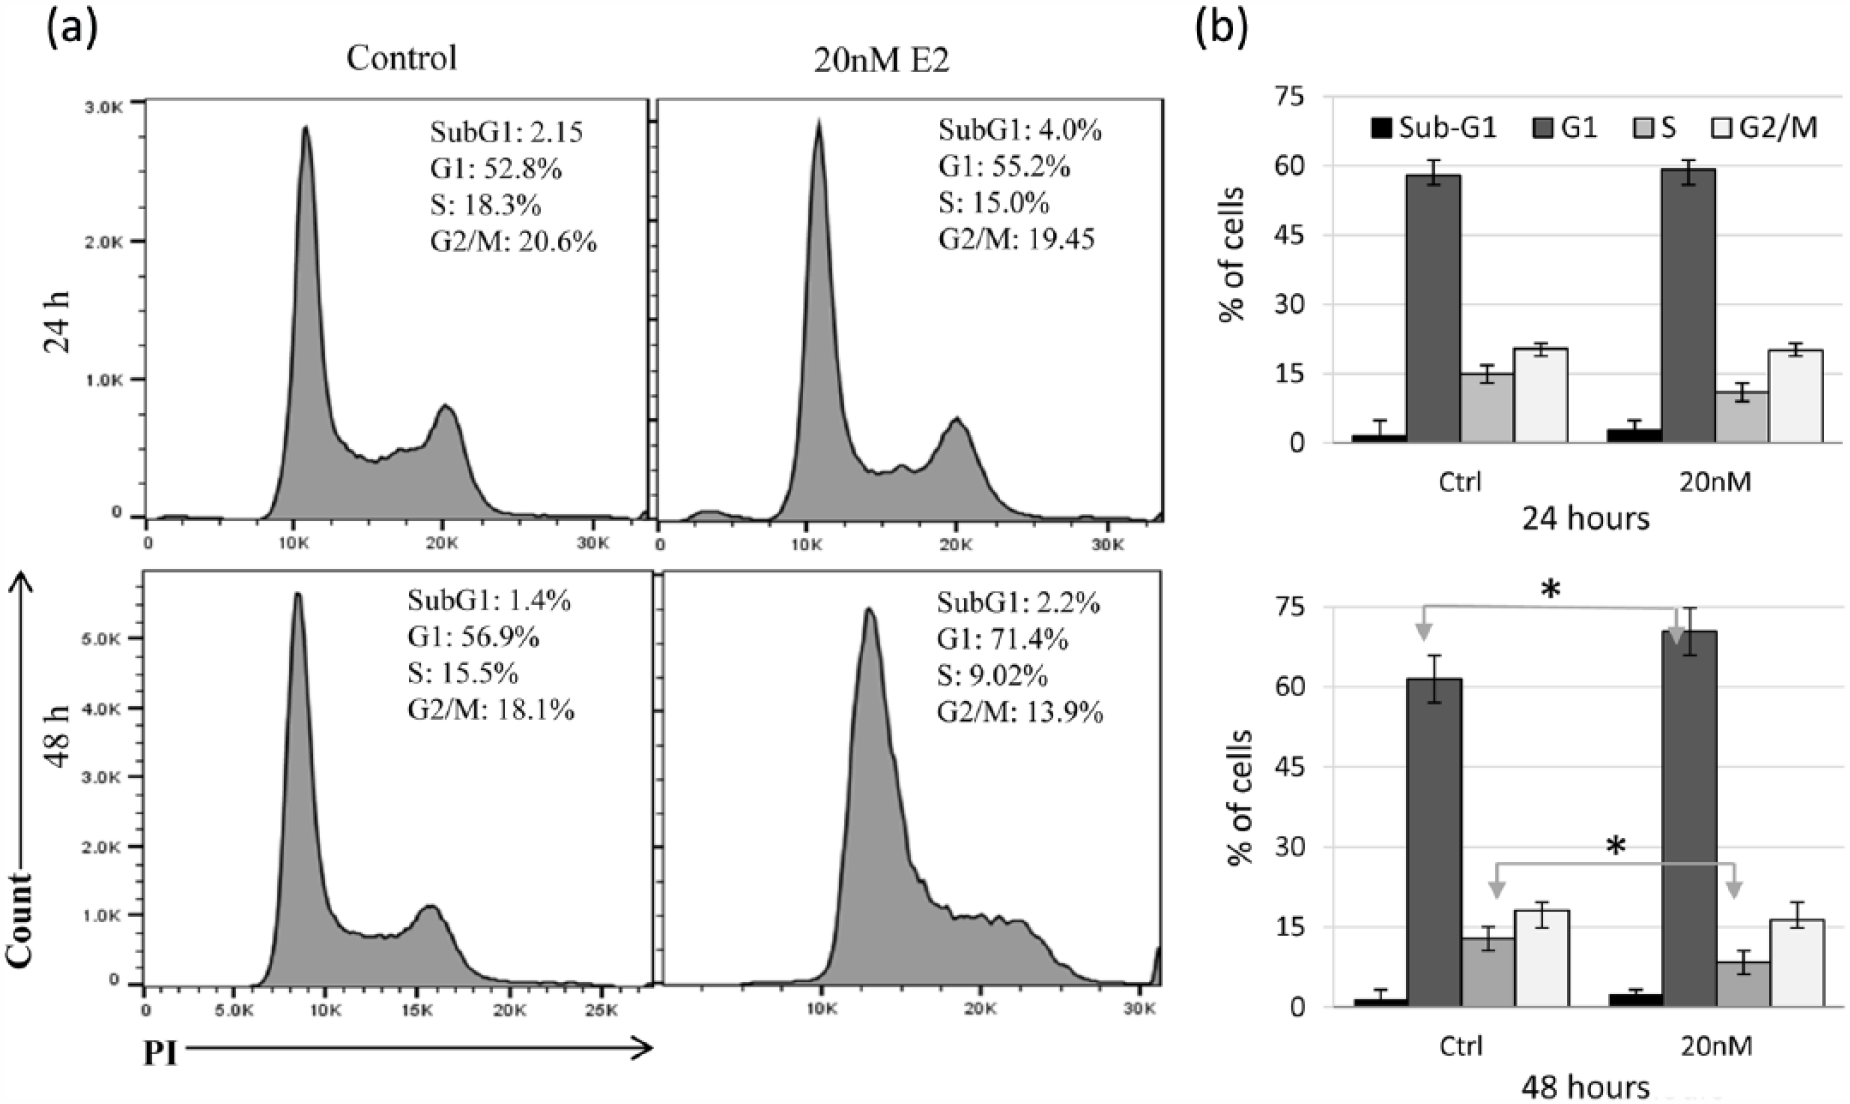
Cell cycle analysis in E2-treated MCF-7 cells. (a) Untreated cells and cells treated with 20 nM of E2 for 24 and 48 h were stained with PI and analyzed for DNA content as means of evaluating cell cycle progression. (b) Average percentage ± SEM of cells in sub-G1, G1, S, and G2/M based on three separate experiments; * indicates a statistically significant difference (p < 0.05) between control and experimental values for the cell cycle phase at the specified time point.
Discussion
Findings presented here suggest that E2 disrupts intracellular iron metabolism, increases oxidative stress, induces plasma membrane damage, reduces growth potential, and causes cell cycle arrest in MCF-7 cells. The conclusion that E2 disrupts intracellular iron metabolism is based on the observation that E2-treated cells showed reduced HEP synthesis, increased expression of HIF-1α, FPN, and TfR1 along with transient LIP depletion followed by increased iron influx and storage (Figures 1 and 2). Increased expression of HIF-1α protein following exposure to E2 (Figure 1) is in agreement with previously published work. 28 The subsequent reduction in HEP synthesis is also consistent with previous observations which have established that increased HIF-1α expression leads to reduced HEP synthesis as means of regulating iron efflux under conditions of increased systemic demand for iron. 17 The ability of E2 to reduce HEP synthesis is also consistent with numerous observations, which have established that elevated levels of E2 associate with increased serum iron levels22–25 and that various cell types including MCF-7, SKOV-3, and Hep-G226,27 experience reduced HEP synthesis following exposure to E2. Other studies have suggested that E2 enhances HEP synthesis via the GPR30-BMP6-dependent signaling in hepatocytes. 32 Furthermore, E2 treatment in Jurkat cells (a T cell line) also enhanced HEP expression (personal unpublished observation). This suggests that the effect of E2 on HEP synthesis varies depending on the cell type and the receptors that it engages. Regardless, reduced HEP synthesis is in line with the observation that E2 treatment enhanced FPN expression; 26 an expected outcome given that reducing HEP availability maintains FPN integrity.16,33 It must be noted here that while some studies have shown that E2 enhances FPN expression, 26 others have shown that E2 directly suppress FPN expression via EREs in the FPN gene. 17 It is possible that the signaling cascades that engages following E2 treatment has some bearing in the exact effect of E2 on FPN expression. Upregulation of TfR1 expression following LIP depletion is consistent with the observation that TfR1 is the main receptor through which cells acquire iron from their surrounding. 34 Hence, the observed reversal in the pattern of LIP content and the significant increase in total iron content at 48 h post E2 treatment (Figures 2 and 3) are in agreement with the observation that TfR1 expression significantly increased at an earlier time point (Figure 1).
The finding that E2 treatment altered the redox balance as evidenced by decreased catalase activity, increased SOD activity, and thiol disruption is consistent with numerous reports which have shown that E2 induces oxidative stress and enhances apoptosis in various cancer cell lines.9,10,35,36 Mechanistically, oxidative stress seems to manifest early on following exposure to E2 (24 h), a time point which also shows cells responding to iron loss by upregulating TfR1 expression so as to increase extracellular iron influx to replenish LIP and total iron content. It is possible that overexpression of TfR1 allows for the accumulation of levels of intracellular iron above normal levels. Should this be the case, excess iron may disrupt the redox balance in treated cells and precipitate oxidative stress. Increased oxidative stress in treated cells was further confirmed by increased expression of HO-1, which is thought to play an antioxidant role 37 under conditions of oxidative stress (e.g. generation and propagation of reactive oxygen species (ROS)) and is hence considered protective in a variety of inflammatory disease states.38–40
Consistent with previous studies, 41 oxidative stress in E2-treated cells resulted in DNA damage as evidenced by the transient upregulation of survivin and γ-H2AX (Figure 6). Inconsistent with previous studies, however,2,42 was the observation that there was little evidence of cell death by apoptosis as evidenced by the lack of change in caspases 3 and 9 (Figure 6) and lack of plasma membrane phosphatidylserine flipping (Figure 7). Lack of apoptosis (Figures 6 and 7) coupled with the upregulation of HO-1 (Figure 4(e)) is consistent with previous work which has demonstrated that induction of HO-1 suppresses apoptotic cell death through activation of mitogen-activated protein kinase (MAPK) pathways.43,44 It is also worth noting that most work showing E2 as an apoptotic agent against MCF-7 has been reported using sensitized MCF-7 clones like MCF-75C. 42 Notwithstanding the fact that E2 failed to induce apoptosis, it seems that both the disruptions in iron metabolism and redox metabolism may have precipitated adverse effects on plasma membrane integrity (Figure 8), cell growth potential (Figures 5 and 9), and cycling (Figure 10). This is in agreement with the general observation that multiple signaling cascades alter following E2–ER engagement. For example, multiple genes involved in cell cycling, proliferation, apoptosis, endoplasmic reticulum stress (ERS; BIM and caspase-4), and inflammation (interferon (IFN), and arachidonic acid–related genes) have been reported to significantly alter in several MCF-7 cell variants following exposure to E2. 42 Collectively, the above noted findings may explain the reduction in MCF-7 viability following exposure to E2 (Figure 5). As to whether such changes would further predispose E2-treated cells to cell death (apoptosis, ferroptosis, etc.) is yet to be investigated. In addition, further work is still needed to understand the exact mechanism underlying reduced growth potential and cell cycle arrest.
Findings presented here shed more light on the intricate relationship between estrogen and iron homeostasis and invoke E2-induced disruption in intracellular iron metabolism as a new facet of the complex relationship between E2 and cancer. The anti-carcinogenic potential of E2 lends further support to the long-held view that, under the right conditions, E2 can precipitate beneficial effects against cancer.3–15
Footnotes
Acknowledgements
M.H. was responsible for the conception of the idea, literature review, hypothesis formulation, statistical analysis, data interpretation, and manuscript preparation. M.Y.A. and I.M.A. preformed all oxidative stress work, they also reviewed the manuscript. K.B. and J.S. performed all other lab studies and collected and tabulated the data. The authors wish to thank the generous in-house support of the Sharjah Institute for Medical Research (SIMR), University of Sharjah, UAE.
Declaration of conflicting interests
The author(s) declared no potential conflicts of interest with respect to the research, authorship, and/or publication of this article.
Funding
The author(s) disclosed receipt of the following financial support for the research, authorship, and/or publication of this article: This work was supported by research grants #15010501005-P/VCGSR-MH from University of Sharjah, UAE and #AJF201664 (MH) from Al-Jalila Foundation Research Center, Dubai, UAE.