
Abstract
Esophageal squamous cell carcinoma (ESCC) is one of the most common and serious malignancies in China. However, the exact mechanisms of tumor formation and progression are unclear. As late diagnosis and poor therapeutic efficacy result in lower survival rates, identifying biomarkers for early detection, prognostic evaluation, and recurrence monitoring of ESCC is necessary. Here we analyzed 10 protein expression profiles of ESCC core tissues and paired normal esophageal epithelial tissues using two-dimensional gel electrophoresis. We excised 29 protein spots with two-fold or greater differential expression between cancer and normal tissues and identified them using matrix-assisted laser desorption/ionization–time-of-flight/time-of-flight mass spectrometry. The role of PA28β in ESCC cell was confirmed using cell growth, colony formation and soft agar in TE-1 cells pre- and post- PA28β transfection. Compared to their expression in the adjacent normal epithelia, 12 proteins, including transgelin (TAGLN), were upregulated in ESCC tissues; 17 proteins, including proteasome activator 28-beta subunit (PA28β), were downregulated (p < 0.05). Western blotting and immunohistochemistry confirmed that PA28β was significantly underexpressed in ESCC tissues. The functional assays demonstrate that PA28β inhibited cell growth, proliferation and malignancy of TE-1 cells. Among the differentially expressed proteins, PA28β is a potential tumor inhibitor.
Keywords
Introduction
Esophageal cancer is the eighth most common cancer worldwide, and the sixth most common cause of death from cancer. 1 There are various esophageal cancer subtypes, primarily adenocarcinoma and squamous cell carcinoma. More than 80% of patients with esophageal cancer are from developing countries, and nearly all cases are esophageal squamous cell carcinoma (ESCC). In China, the crude mortality rate of esophageal cancer in 2004–2005 was 15.2/100,000, which represented 11.2% of all cancer deaths and was ranked the fourth most common cause of cancer death. 2 Thus, even though the age-standardized mortality of esophageal cancer decreased by 41.6% from 1973 to 2005, 3 ESCC remains one of the most common and serious malignancies in China.
Cancer development involves multiple genetic changes and environmental effects.4,5 The complicated interplay of factors leading to tumor formation and progression is ultimately reflected in the protein expression profiles of cells. Thus, studying these profiles is essential for understanding carcinogenesis.6,7 Biomarkers are the specific protein products of active genes, representing the molecular characteristic or signatures of cells. 8 As proteomics is an approach more similar to a network than a single-protein research method, many researchers have used proteomics technology successfully to study clinical tumor samples, where comparative analysis of the protein expression patterns of tumors and matched normal tissue by two-dimensional electrophoresis (2-DE) followed by mass spectrometry (MS) identification of differentially expressed proteins has been a highly successful approach for finding novel cancer-specific biomarkers.9,10
A large number of risk factors for ESCC have been identified in recent years, such as cigarette smoking, alcohol drinking, dietary and micronutrient deficiency, thermal injuries caused by hot food, and exposure to nitrosamine or moldy foodstuff that contain direct or indirect carcinogens. 11 However, the molecular mechanism underlying tumor formation and progression in ESCC has yet to be clarified. Currently, various molecules have been identified as closely correlated with ESCC, including p16, p21, p53, retinoblastoma protein (Rb), cyclin D1, Bcl-2, cyclooxygenase-2 (COX-2), and Annexin 1.12–14 Recently, a new study identified FAM135B as a novel cancer-implicated gene, as well as other significantly mutated genes, such as TP53, RB1, and cyclin-dependent kinase inhibitor 2A (CDKN2A). 15 However, clinical approaches for early ESCC detection and diagnosis are limited due to their low specificity and/or sensitivity. Identifying high-specificity and high-sensitivity biomarkers is essential for more effective early detection and diagnosis of ESCC. In this study, proteasome activator 28-beta (PA28β) was identified as a specific biomarker for ESCC based on comparative analysis of the protein expression patterns of ESCC tissues and paired adjacent non-neoplastic tissues using analytical proteomics methods, and the effects of PA28β on TE-1 cells were evaluated. These results suggested that PA28β is a potential tumor inhibitor.
Methods
Reagents and instruments
All chemical reagents for 2-DE, that is, Immobiline DryStrip pH 3–11 nonlinear (NL), 24 cm immobilized pH gradient (IPG) strips, 2D Quant Kit, Coomassie Blue R350, polyvinylidene fluoride (PVDF) membranes, and enhanced chemiluminescent substrates, were purchased from Amersham Bioscience. The Immobiline DryStrip re-swelling tray, 2-DE system comprising strip holders, Ettan IPGphor II Isoelectric Focusing (IEF) System, and Ettan DALTsix; power supply; and ImageMaster 2D 5.0 analytical software were also from Amersham Bioscience. The ABI 4700 TOF–TOF Proteomics Analyzer was supplied by Applied Biosystems (Carlsbad, CA, USA). The GPS Explorer and Mascot software for MS identification were from Applied Biosystems and Matrix Science (London, UK), respectively. Radioimmu-noprecipitation assay (RIPA) protein lysis buffer and the bicinchoninic acid (BCA) Protein Quant Kit for western blotting were from Pierce (Rockford, USA) and Bio-Rad (Hercules, CA, USA), respectively. Antibodies against proteasome activator 28-beta subunit (PA28β; A8) and β-actin and secondary antibody for western blotting and immunohistochemistry (IHC) were from Santa Cruz Biotechnology (Delaware Ave Santa Cruz, CA, USA). Prestained Protein Ladder for western blotting was from Fermentas (Vilnius, Lithuania).
Cell line and tissue samples
TE-1 cells were supplied from the Type Culture Collection of the Chinese Academy of Sciences (Shanghai, China) and cultured in RPMI Medium 1640 (Invitrogen) supplemented with 10% fetal bovine serum (FBS; Invitrogen). A total of 5 × 10⁵ TE-1 cells were infected with 100 multiplicity of infection (MOI) of recombinant adenoviruses GFP-Ad and PA28β-Ad, respectively.
The tissue samples used in this experiment were obtained following approval by patients and the Committees for Ethical Review of Research involving Human Subjects at Fujian Province Cancer Hospital and conform to The Code of Ethics of the World Medical Association (Declaration of Helsinki). We collected 40 human ESCC specimens containing cancer core tissues and paired normal esophageal epithelia at least 5 cm away from the edge of the cancer tissue immediately after surgical resection from patients with ESCC; no patient was treated with chemotherapy or radiotherapy before surgery. One portion of the tissue samples was snap-frozen in liquid nitrogen and then stored in a −80°C deep freezer before use; the remaining portion was used to prepare regular paraffin-embedded blocks. Of these samples, 10 cases were subjected to proteomic analysis. All samples comprised >80% of target cells (normal epithelial cells or cancer cells) without necrosis and were confirmed by a pathologist. The clinical information of these samples is summarized in Tables 1 and 2.
Clinical features of ESCC patients and the expression of PA28β detected by immunohistochemistry assay.

ESCC: esophageal squamous cell carcinoma; M: male; F: female; IHC; immunohistochemistry assay; N: normal tissue; Ca: carcinoma tissue; TNM: tumor–node–metastasis.
Immunohistochemical results were graded to five different scores (0, 1, 2, 3, and 4) as follows: Score 0 was no staining or 1+ staining regardless of the percent of positive cells; Score 1 was 2+ staining in ≤30% of cells; Score 2 was 2+ staining in >30% of cells; Score 3 was 3+ staining in ≤50% of cells, and Score 4 was 3+ staining in >50% of cells.
Clinicopathological characteristics of patients with expression of PA28β in ESCC patients by immunohistochemistry assay.

ESCC: esophageal squamous cell carcinoma; TNM: tumor–node–metastasis.
Preparation of 2-DE samples
Fresh frozen ESCC tissue samples (1 g per sample) were cut into small pieces, ground in liquid nitrogen using a pestle to yield tissue powder, and solubilized in 800 μL lysis buffer containing 7.5 M urea, 4% CHAPS, 2 M thiourea, 40 mM dithiothreitol (DTT), and 2% IPG buffer (pH 3.5–5.0). The protein mixtures were vortexed vigorously for 30 min with frequent breaks for incubation on ice, followed by centrifugation at 40,000g for 60 min at 4°C. The supernatant was collected and stored in aliquots at −80°C until further use. Protein concentrations were quantified using the 2D Quant kit according to the manufacturer’s instructions.
2-DE analysis
IEF was performed using the Ettan IPGphor II Isoelectric Focusing System. Protein (500 μg) was adjusted to 450 μL with rehydration buffer containing 7.5 M urea, 4% CHAPS, 2 M thiourea, 18 mM DTT, and 0.5% NL IPG buffer (pH 3–11) for the IPG strips. The IPG strips were overlaid with Immobiline DryStrip Cover Fluid and allowed to rehydrate overnight (16 h) with the protein samples. The strips were then transferred to the strip holders; IEF protocol was 200 V, 1 h; 400 V, 1 h; 2000 V, 20 min; 4000 V, 20 min; and 8000 and 96,000 V for 12 h.
Subsequently, each Immobiline DryStrip gel was equilibrated in sodium dodecyl sulfate (SDS) equilibration buffer (6 M urea, 50 mM Tris, 30% v/v glycerol, 2% SDS) containing 1% DTT and 2.5% iodoacetamide and then run on SDS–polyacrylamide gels for the second dimension electrophoresis. The 2-DE separation was performed at 2 W/gel at 15°C for the initial 1 h and at 15 W/gel thereafter. The resulting gel was fixed with 20% trichloroacetic acid for 30 min and stained with Coomassie Brilliant Blue R350 overnight following the electrophoresis. Images of the 2-DE gels were digitalized with Image Scanner (Amersham Biosciences); differentially expressed protein spots were confirmed using ImageMaster 2D 5.0, which was followed by a more detailed manual matching process to correct inappropriate matching pairs. Student’s t-test was performed for quantitative analysis of the gels; two-fold or greater differentially expressed protein spots (p < 0.05) were selected for further identification by matrix-assisted laser desorption/ionization–time-of-flight/time-of-flight MS (MALDI-TOF/TOF-MS).
MALDI-TOF/TOF-MS identification of differentially expressed proteins
Spots from the 2-DE gels were excised and MALDI-TOF/TOF-MS was performed according to the methods described by Li et al. 16 Briefly, proteins were analyzed on the ABI 4700 TOF-TOF Proteomics Analyzer using a UV laser at 200 Hz repetition rate at 355 nm and 20 kV acceleration voltage. The maximized mass resolution was 1500 Da, and the range of masses scanned was 700–3200 Da. A tryptic digest of myoglobin was used to calibrate the mass spectrometer with an internal calibration mode. All spectra of actual samples were obtained using the default mode. Proteins were identified using GPS Explorer with the Mascot search engine.
Western blotting for PA28β
With reference to the candidate protein verification following MALDI-TOF/TOF-MS, western blotting was performed to confirm the protein of interest. Sample preparation for western blotting was similar to that for 2-DE, except RIPA lysis solution was used in place of 2-DE sample preparation solution. Protein (30 μg) was subjected to 12% SDS-polyacrylamide gel electrophoresis and then electrophoretically transferred to a PVDF membrane (Millipore). Protein blots were incubated separately with specific anti-PA28β (1:500) and anti-β-actin antibodies (1:400). Alkaline phosphatase–conjugated goat anti-mouse immunoglobulin G was used as the secondary antibody. CDP-Star Reagent (Roche Diagnostics GmbH, Mannheim, Germany) was used for color development. Signals were captured with X-ray film. Western blotting of the same sample with anti-β-actin was used as the loading control. The signal intensity was measured using ImageQuant TL v2003.03 (Amersham Bioscience); the relative intensity (RI) of PA28β was normalized to anti-β-actin, and the RI of the paired adjacent non-neoplastic tissues versus that of ESCC tissues was calculated as ratios. The expression of PA28β in TE-1 cells infected with PA28β-Ad was also detected by western blotting.
IHC for PA28β
The paraffin-embedded ESCC and paired normal tissue blocks were used for PA28β antigen detection. Tissues were fixed in 4% neutral buffered formalin solution, embedded in paraffin, and sliced at a thickness of 5 μm. Tissue sections were deparaffinized and rehydrated. Endogenous peroxidase was blocked with 10-min incubation in 3% H2O2 in phosphate-buffered saline (PBS). After blocking non-specific sites with 1.5% blocking serum in PBS for 1 h at room temperature (RT), tissue sections were incubated for 1 h at RT with anti-PA28β antibody. After a 30-min reaction with biotinylated secondary antibody, slides were washed with PBS and incubated with horseradish peroxidase–conjugated streptavidin for 10 min. The reaction was then visualized with diaminobenzidine. The slides were mounted with Eukitt (Sigma, Darmstadt, Germany) and observed using an Olympus BX60 microscope (Tokyo, Japan). Images were captured with Image-Pro Express 6.0 software (Media Cybernetics, Rockville, MD, USA). The staining results were assessed on a four-tier scale as previously described:17,18 negative (−), no staining; 1+, weak staining; 2+, moderate staining; and 3+, strong staining. IHC results were graded using a five-point system as described previously: 19 0, no staining or 1+ staining regardless of the percentage of positive cells; 1, 2+ staining in ≤30% of cells; 2, 2+ staining in >30% of cells; 3, 3+ staining in ≤50% of cells; 4, 3+ staining in >50% of cells.
Recombinant adenoviruses preparation
Recombinant adenoviruses were generated by using AdEasy XL System (StrataGene, La Jolla, CA, USA) following the manufacturer’s instruction. Briefly, plasmid pShuttle-IRES-hrGFP-1-PA28β was generated by inserting PA28β gene (GeneBank Accession No. NM_002818) into the vector pShuttle-IRES-hrGFP-1 between the Xho I and Nhe I sites, and PA28β gene complementary DNA (cDNA) was amplified by reverse transcription polymerase chain reaction (RT-PCR) from the total RNA isolated from TE-1 cells. The primers used were as follows: forward primer, 5′-CTAGCTAGCATGGCCAAGCCGTGTGG-3′; reverse primer, 5′-CCGCTCGAGTCAGTACATAGATGGCTT-3′. PA28β-expressing (pAd-PA28β) or control (pAd-Control) recombinant adenoviral vectors were then generated by homologous recombination of pAdEasy-1 and pShuttle-IRES-hrGFP-1-PA28β or pShuttle-IRES-hrGFP-1 in Escherichia coli BJ5183-AD-1. The colonies obtained were screened for appropriate recombination events by Pac I restriction endonuclease analyses. The pAd-PA28β and pAd-Control were then digested with Pac I and used to transfect the 293A packaging cell line (Invitrogen) to produce PA28β-expressing (PA28β-Ad) and control (GFP-Ad) recombinant adenoviruses. Exponentially growing TE-1 cells were infected with these recombinant adenoviruses at a MOI of 100. This dose of virus was sufficient to give 100% infectivity as determined by GFP expression under fluorescence microscopy.
Bromodeoxyuridine cell proliferation assay
TE-1 cells were seeded at a density of 1 × 10⁴ per well in 96-well tissue culture plates. The next day, cells were infected with PA28β-Ad or GFP-Ad. Cell proliferation was determined daily for 6 days by bromodeoxyuridine (BrDU) assay according to the manufacturer’s instructions. Briefly, after the cells were infected, BrDU was added to each well at a dilution of 1:2000 and the cells incubated for 24 h. The BrDU incorporation (a measure of DNA synthesis and growth) was measured using the BrDU Cell Proliferation assay kit (CalBiochem, San Diego, CA, USA) at 450 nm using a microplate reader.
Cell-cycle assay
TE-1 cells were seeded at a density of 5 × 10⁵ per well in six-well tissue culture plates. The next day, cells were infected with PA28β-Ad or GFP-Ad. At 6 h after infection, the cells were washed with PBS and serum-starved with serum-free RPMI Medium 1640 for 24 h. Then, the culture medium was replaced with fresh medium containing 10% FBS. Cells were harvested after serum starvation at days 2, 4, and 6, were fixed with ice-cold 70% ethanol (pre-chilled at −20°C), washed with PBS (pH 7.2), and incubated with 0.05 mg/mL propidium iodide (PI; Sigma) and 1 μg/mL RNase A at 37°C for 30 min in dark. The DNA content of 10,000 cells was analyzed by flow cytometry (Beckman Coulter, Miami, FL, USA) and CXP 2.2 software. The percentage of each phase of the cell cycle was determined.
Anchorage-independent growth in soft agar
The assay was performed as previously described. 20 Briefly, 2 × 10³ TE-1 cells that infected with PA28β-Ad or GFP-Ad were suspended in 0.3% agarose in RPMI Medium 1640 supplemented with 10% FBS and plated in 60 mm dishes over a basal layer of 0.6% agarose in the same medium. All dishes were incubated at 37°C in a 5% CO2 humidified atmosphere and were examined microscopically for colony formation after a 2-week incubation.
Statistical analysis
All analyses were performed with SPSS statistical package (SPSS 17.0; SPSS Inc., Chicago, IL, USA). All the experiments were performed at least for three times. Results are expressed as mean ± standard deviation (SD). The statistical significance of differences between groups was tested using unpaired Student’s t-test, and a p value less than 0.05 was considered statistically significant.
Results
MALDI-TOF/TOF-MS protein identification
In this study, the protein expression patterns of 10 ESCC and paired normal tissue were separated by 2-DE. Figure 1 depicts a representative pair of proteome profiles for ESCC versus paired normal tissue. The one-tailed Student’s t-test was utilized to select the protein spots with significant and consistent differences in expression through intrapaired comparative analysis in ImageMaster and manual check. We excised 29 protein spots with differential expression between the cancer and paired normal tissues where p < 0.05 and reasonable estimate of the isoelectric point and molecular weight and subsequently analyzed them using MALDI-TOF/TOF-MS. Of these proteins (Table 3), 12 were overexpressed, such as transgelin (TAGLN), vimentin (VIM), tropomyosin alpha-3 chain (TPM3) isoform 2, and desmin (DES); 17 proteins (Table 3), such as PA28β, interleukin-1 receptor antagonist (IL1RN) isoform 3, eukaryotic initiation factor 4A-I (EIF4A1), and of TPM beta chain (TPM2) isoform 1, were downregulated in ESCC tissues. Among the identified proteins, PA28β was identified as downregulated in ESCC tissues from 6 of 10 patients (Figure 1 and Table 3) and has been reported being repressed in some cancer cell lines and cancer tissues, such as in colon cancer cells, 21 lung cancer, 19 and gastric adenocarcinoma (GA) tissues, 22 so we selected PA28β for further analysis. MS determined that the molecular weight (MW) of PA28β was 27384.3, and the isoelectric point (PI) was 5.54, which is consistent with the literature. 23
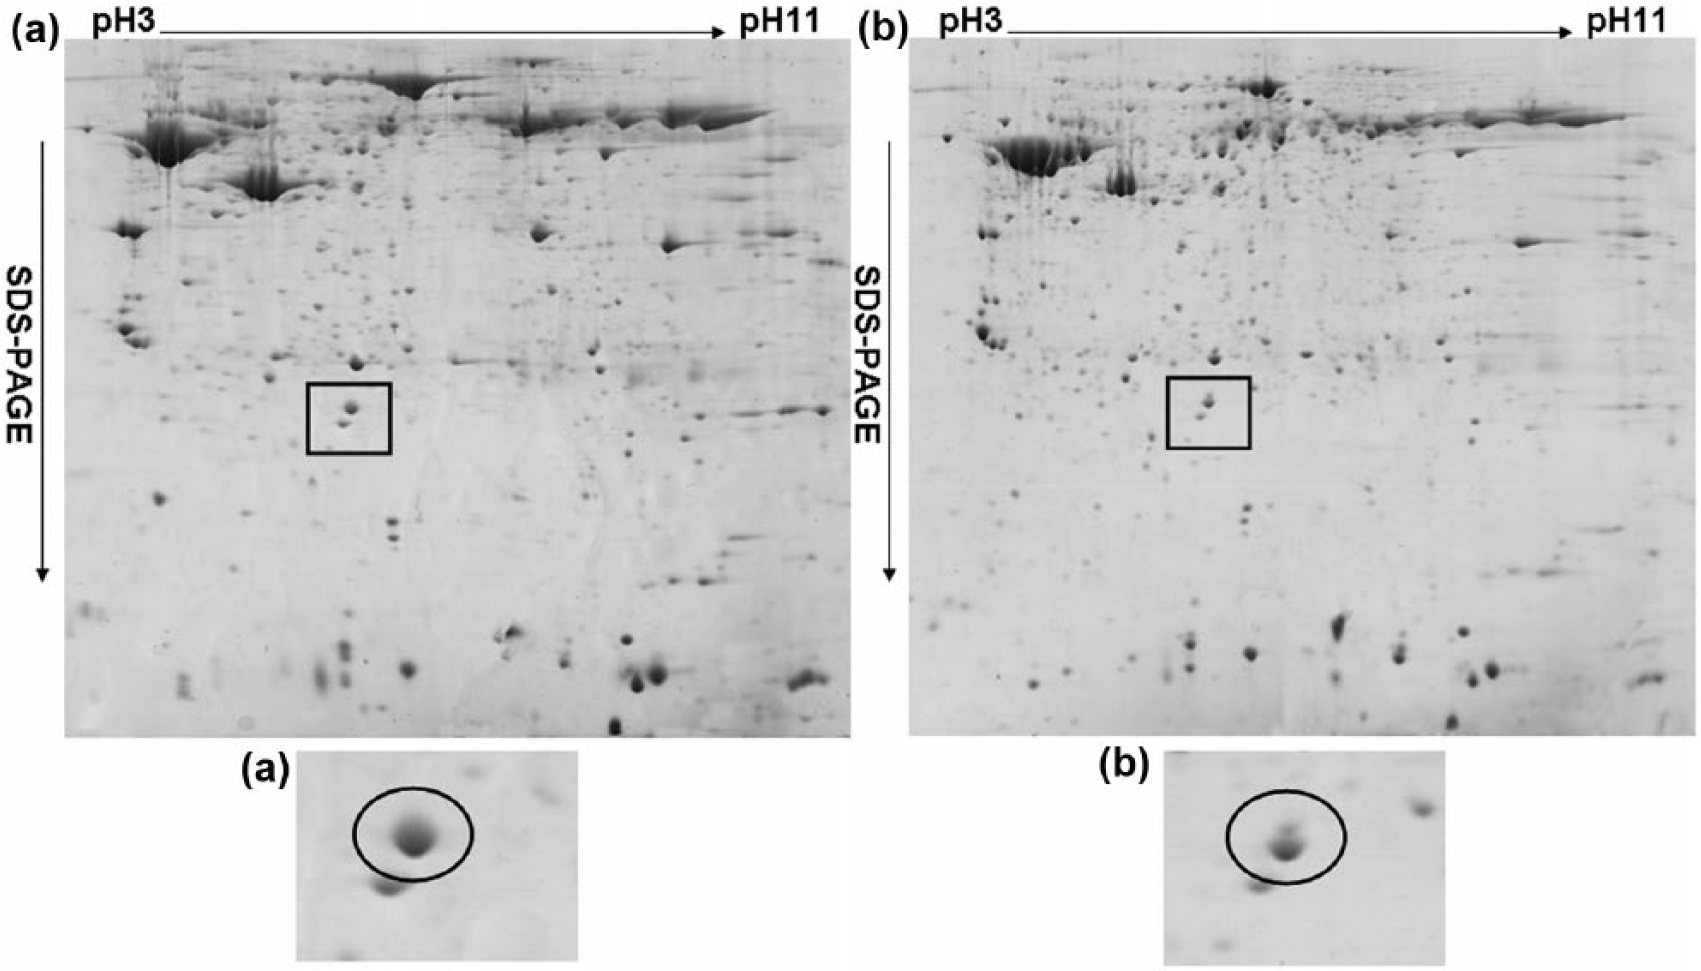
Proteomic profiling of representative two-dimensional electrophoresis gels. The gels measured 190 × 254 mm (300 × 300 DPI). Compared to (a) paired normal esophageal epithelia, (b) PA28β expression was decreased in ESCC tissue (highlighted in inset).
Summary of differentially expressed proteins between normal and cancer tissues.

MW: molecular weight; MALDI-TOF/TOF MS: matrix-assisted laser desorption/ionization–time-of-flight/time-of-flight mass spectrometry.
“−” in fold change, protein expression decreased by true ratio change in cancer tissues versus normal tissues (ratio ≥ 2, p < 0.05); “+” in fold change, protein expression increased by true ratio change in normal tissues versus cancer tissues (ratio ≥ 2, p < 0.05). Protein score obtained by MALDI-TOF/TOF MS identification; when this score is >60, protein identification can be considered successful.
Western blot confirmation of decreased PA28β expression in ESCC
Western blotting was performed to validate PA28β, which may play functional roles in tumorigenesis. We examined 40 cases of ESCC and paired normal tissue with anti-PA28β antibody. PA28β expression was decreased in 31 (31/40, 77.5%) ESCC tissues compared to the paired normal tissue. Differential expression of PA28β was not significant in seven cases; PA28β was overexpressed in two cases. Figure 2 depicts representative western blot gels; eight cases of paired normal tissues had a reactive band of about 28 kDa, but not the ESCC tissues, confirming the decreased PA28β expression in ESCC.
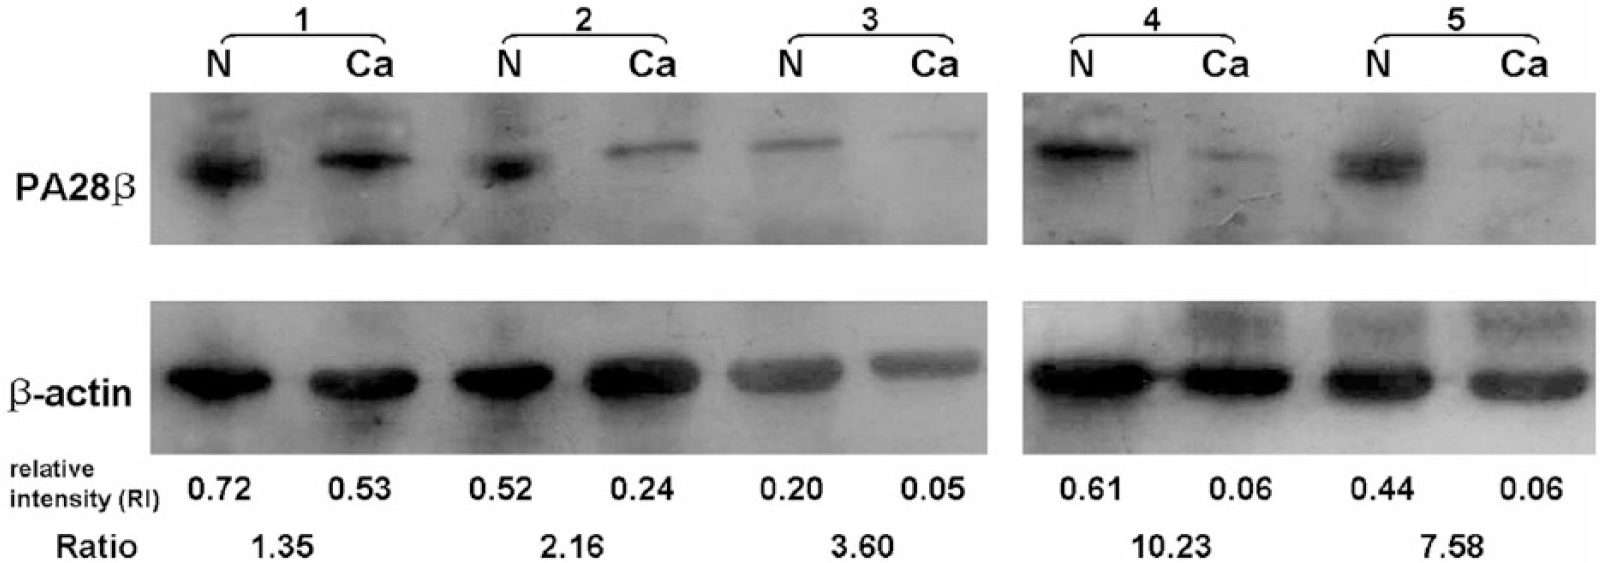
Western blot analysis of PA28β expression. Equal amounts of protein from each sample were probed; anti-β-actin was the loading control. The relative intensity (RI) of PA28β was normalized to β-actin; the RI ratios of the paired normal esophageal epithelia (N) versus ESCC tissue (Ca) are shown at the bottom of the figure.
IHC confirmation of decreased PA28β expression in ESCC
To further verify and locate the representative PA28β as valuable biomarker in ESCC, it was essential to examine its expression by IHC in ESCC specimens. We examined 40 cases of ESCC and paired normal tissues by IHC using a specific anti-PA28β antibody. After paraffin-embedded tissue slides were reacted with the anti-PA28β antibody, there were strong positive signals in the stained squamous epithelium cells of the esophageal mucosae (Figure 3(a) and (b)). As shown in Figure 3(c) and (d), PA28β expression was decreased in 28 ESCC cases (28/40, 70%) compared to that in paired normal tissues (Wilcoxon signed-rank test, p < 0.001). Nine cancer samples had weaker signals compared to that in paired normal tissue (9/40, 22.5%); there was no significant difference between the ESCC and normal tissues. In addition, three cases of ESCC had strong signals (3/40, 7.5%). The IHC data and results of these samples are summarized in Tables 1 and 2. Thus, the IHC analysis further confirmed that PA28β expression is decreased in ESCC. Altogether, we identified PA28β as a potential biomarker for ESCC diagnosis and surveillance.
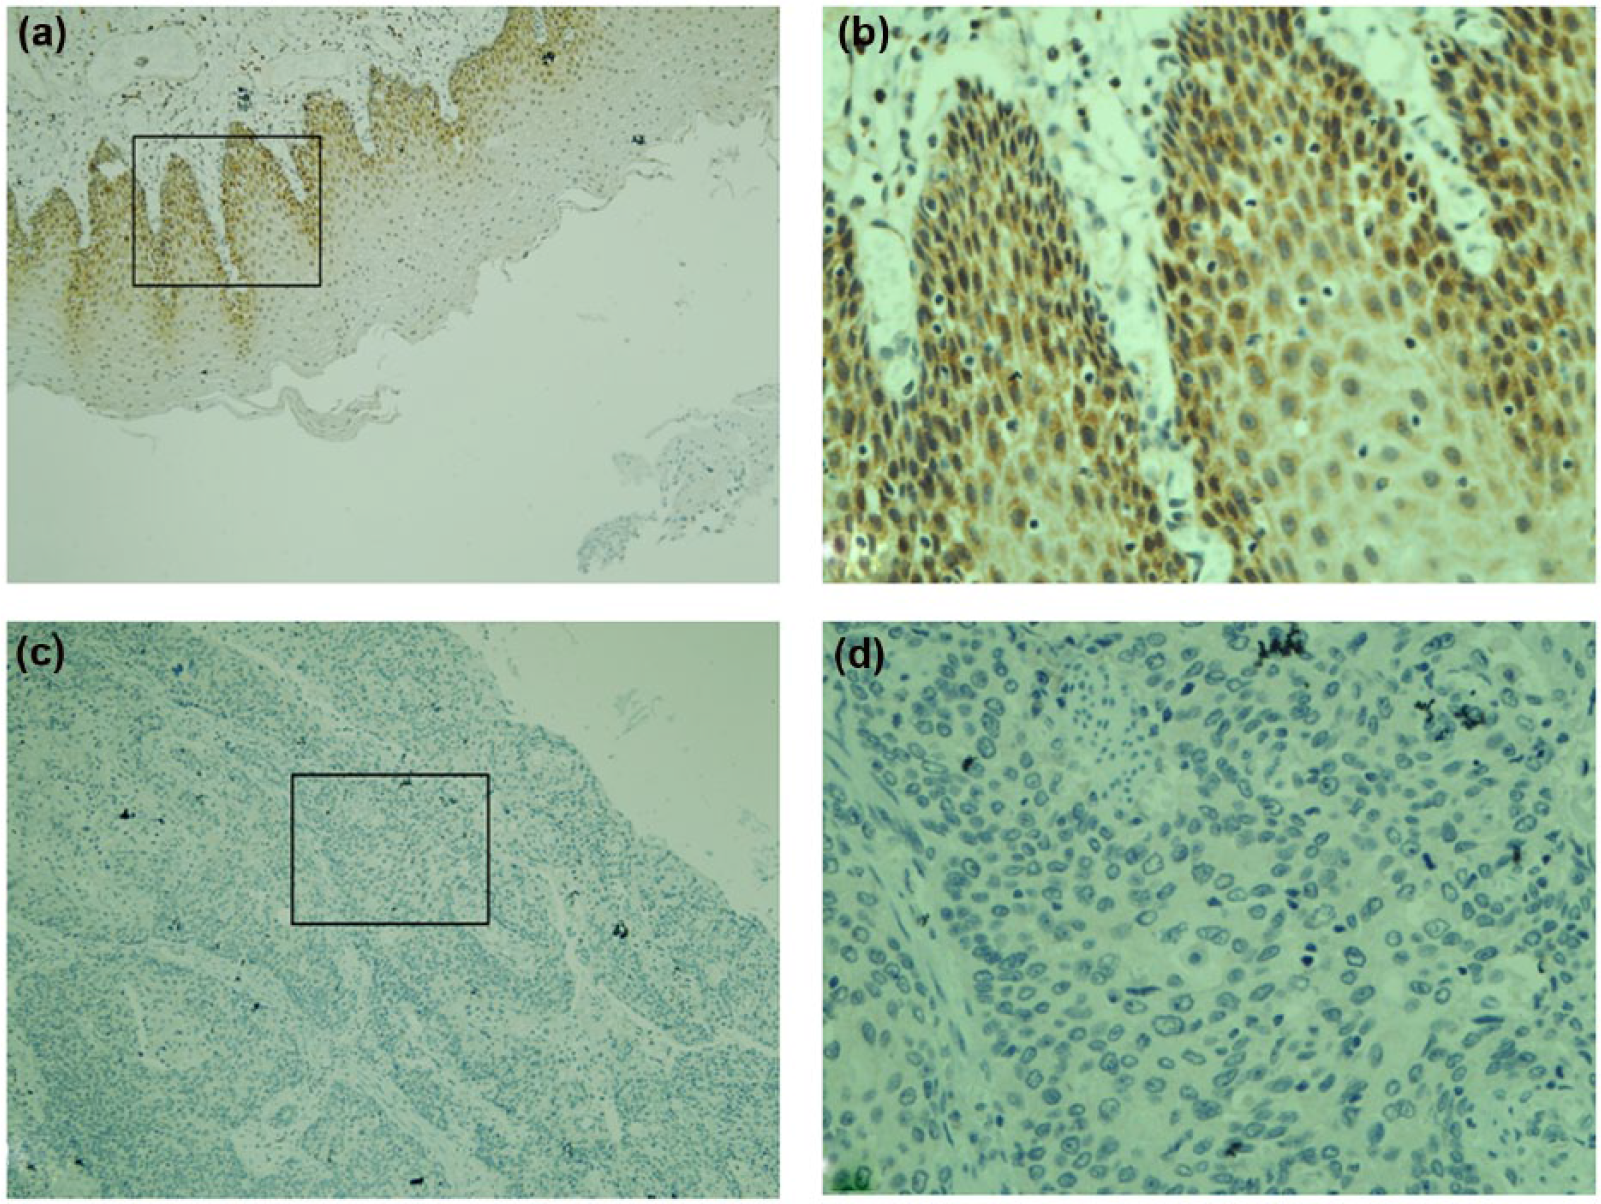
Immunohistochemistry validation of PA28β expression. PA28β showed strong positive cytoplasmic staining in representative (a and b) paired normal esophageal epithelia compared to (c and d) ESCC tissues. Insets on the left (100×) are magnified on the right (400×).
PA28β inhibits the proliferation of TE-1 cells
As shown in Figure 4(a), the protein level of PA28β in TE-1 cells infected with PA28β-Ad was significantly increased compared with that of control. In order to investigate the effect of PA28β on TE-1 cells proliferation, BrdU assay was performed. The results demonstrated that the proliferation of TE-1 infected with PA28β-Ad decreased from day 4 to day 6 and significantly slower than that of GFP-Ad (Figure 4(b)). And with the extension of time and the increase of MOI value, the effect of inhibiting proliferation is more significant in TE-1 infected with PA28β-Ad. These indicated that PA28β could inhibit the proliferation of TE-1 cells obviously.
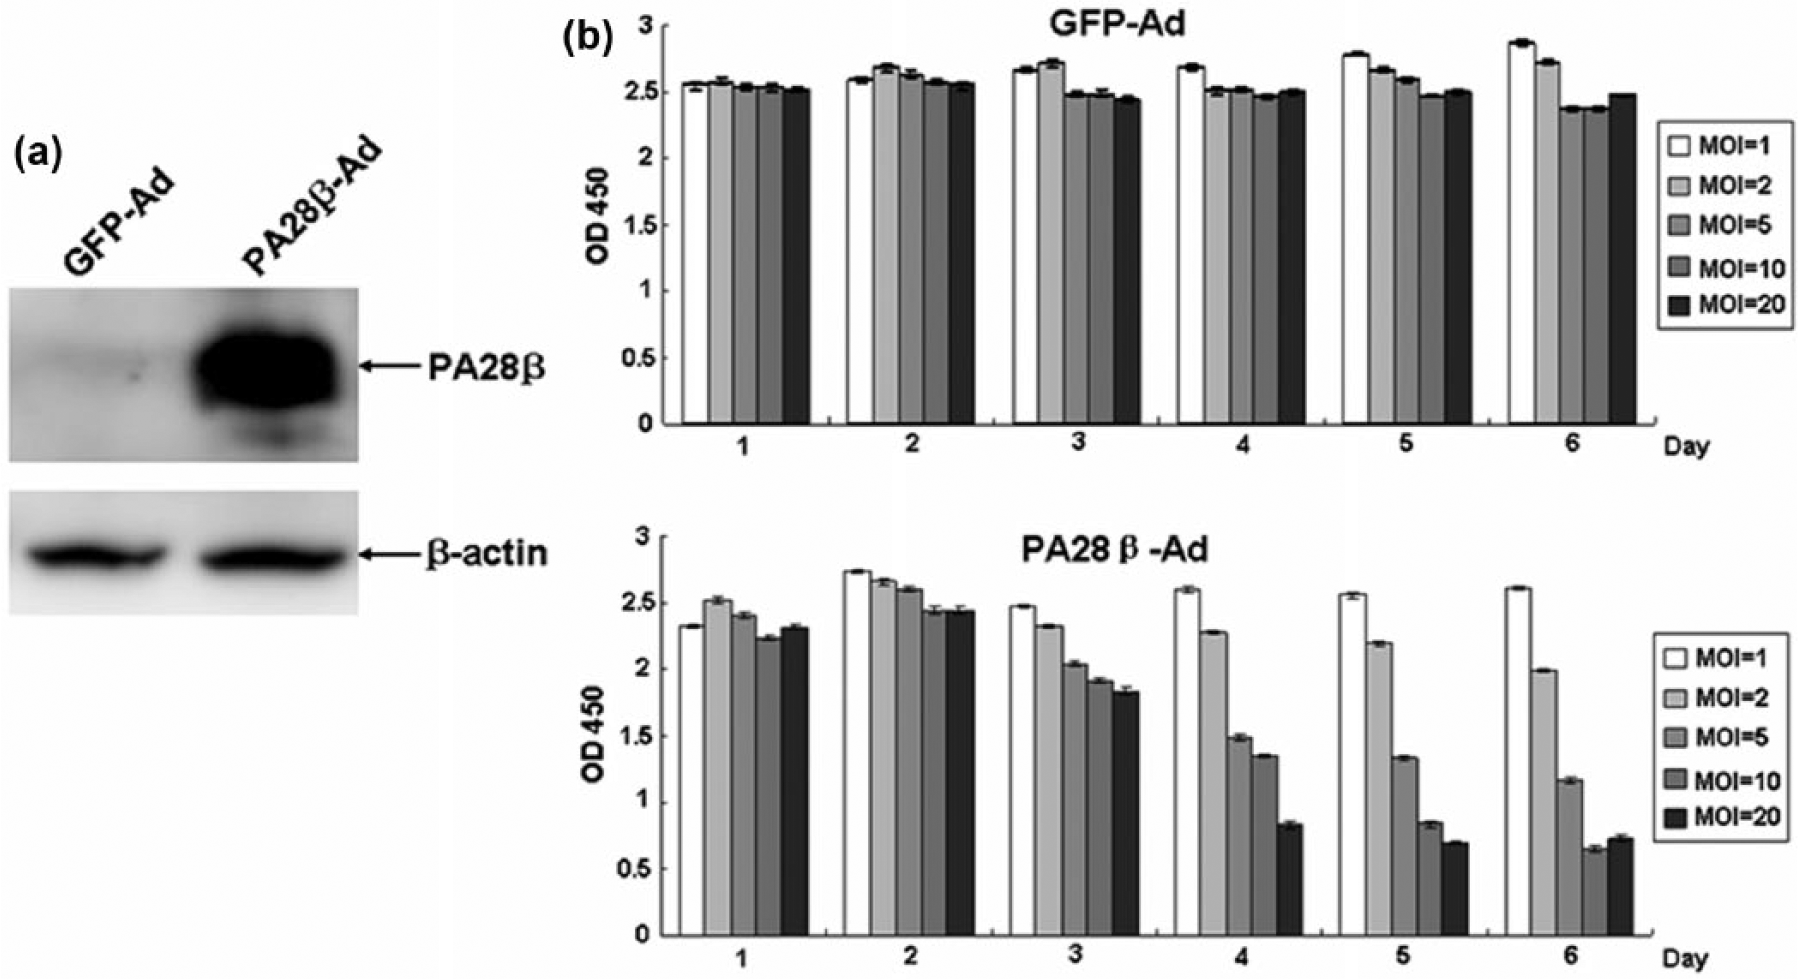
Effects of PA28β on the proliferation of TE-1 cells. (a) PA28β expression in TE-1. 30 μg of cellular proteins were subjected to 12% SDS-PAGE, transferred to a PVDF membrane, and probed with anti-PA28β. β-actin served as a loading control. (b) Cell proliferation of TE-1. Cells were seeded in 96-well plates at 1 × 10⁴/well, and cell proliferation was determined daily in triplicate for 6 days by BrdU assay. The optical density (OD) was measured at 450 nm using a microplate reader. The analyses were repeated three times, and the results were expressed as mean ± SD.
PA28β induces cell-cycle alterations of TE-1 cells
To investigate the effects of PA28β on the cell cycle of TE-1 cells, cell cycles of TE-1 cells are compared at days 2, 4, and 6 after serum starvation. The results showed that TE-1 infected with PA28β-Ad displayed a dramatic alteration in cell-cycle distribution with a increase in the fraction of the cells in G1 phase and a corresponding decrease in the fraction of the cells in S phase (Figure 5). The percentages of G1 phase in TE-1 infected with PA28β-Ad were 58.70%, 60.65%, and 62.60% for days 2, 4, and 6, respectively, significantly higher than those of TE-1 infected with GFP-Ad (31.20%, 31.50%, and 31.35%, respectively). These data showed that PA28β decreases G1/S transition of TE-1 cells.

Effects of PA28β on the cell cycle of TE-1 cells. A total of 5 × 10⁵ of TE-1 cells infected with PA28β-Ad or GFP-Ad in six-well plates were serum-starved for 24 h, and the cells were harvested at the time of 2, 4, and 6 days after serum starvation. Cells were fixed with ice-cold ethanol, washed with PBS, incubated with PI and RNase A at 37°C for 30 min in the dark. The DNA content of 10,000 cells was detected by flow cytometry and analyzed by CXP 2.2 software. The percentage of each phase of the cell cycle was determined. The results were one representative data from three independent experiments.
PA28β inhibits anchorage-independent growth of TE-1 cells in soft agar
To study whether PA28β affects the transformation of TE-1 cells, the anchorage-independent growth in soft agar was performed. The results revealed that TE-1 infected with PA28β-Ad grew slowly than the control of TE-1 infected with GFP-Ad in soft agar (Figure 6(a)). Moreover, TE-1 infected with PA28β-Ad showed a dramatic decrease in the number of the colonies in soft agar than TE-1 infected with GFP-Ad (Figure 6(b)). These data indicate that PA28β inhibits malignant transformation of TE-1 cells.
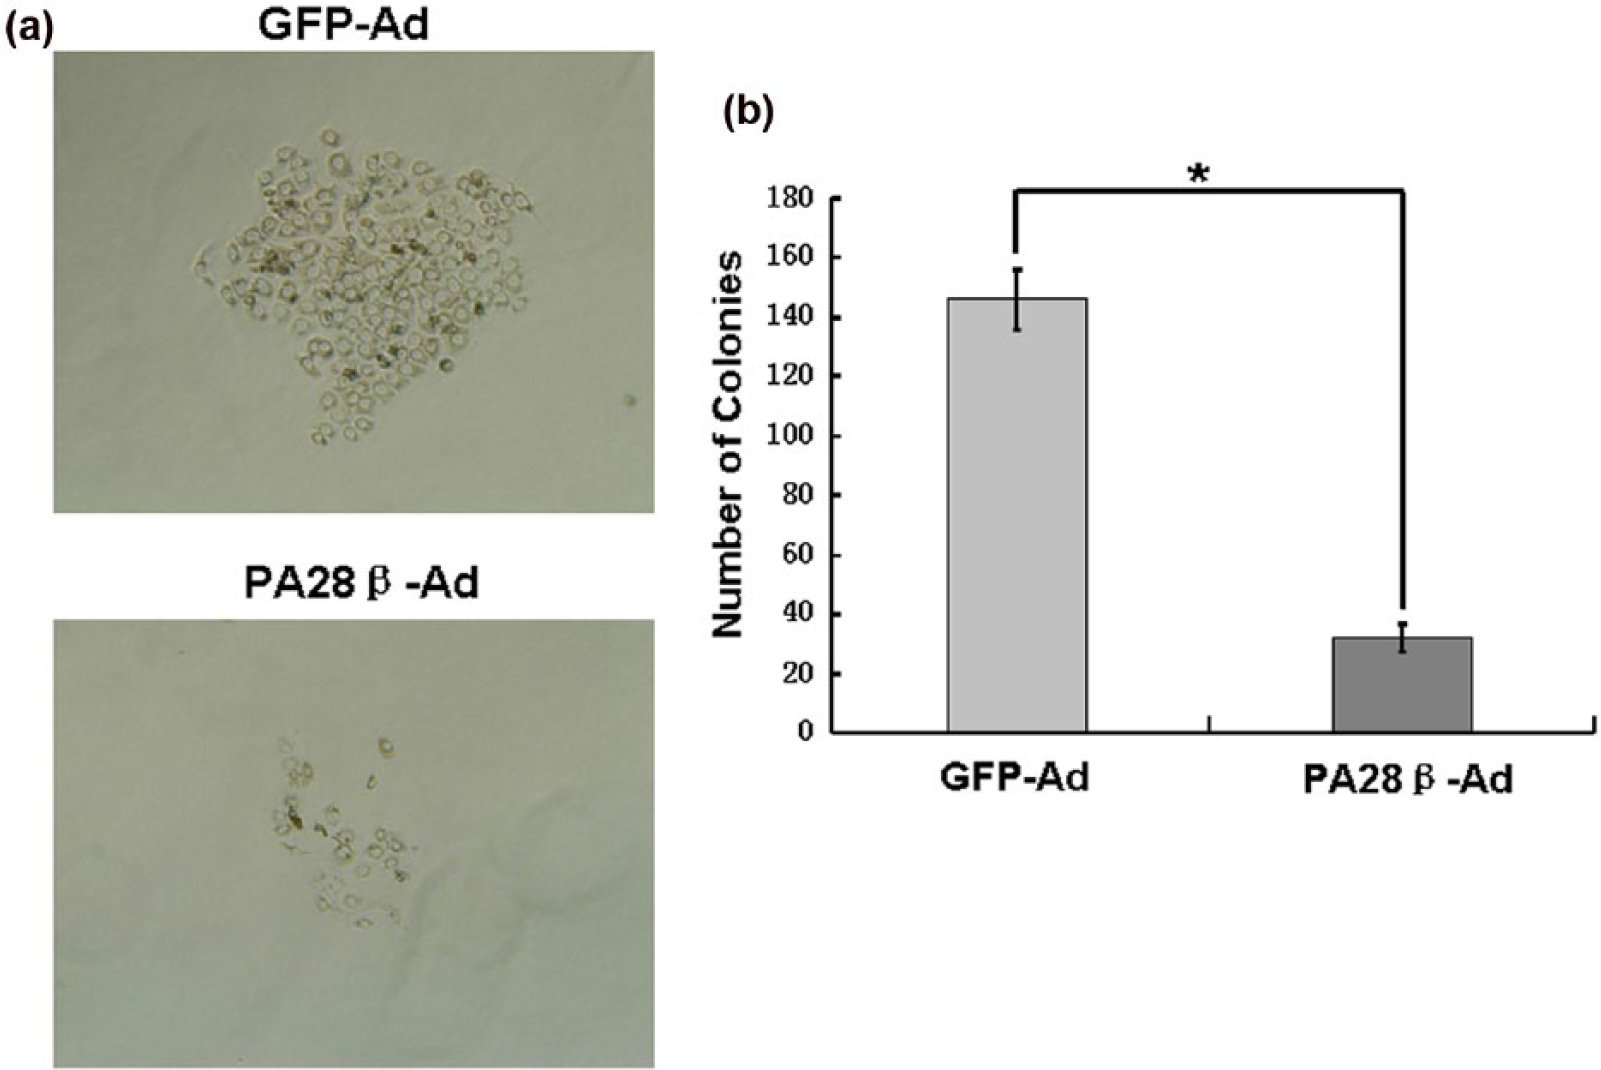
Effects of PA28β on the growth of TE-1 cells. (a) TE-1 cells were infected with PA28β-Ad or GFP-Ad growing in soft agar 14 days after plating. (b) The number of colonies growing in the soft agar (*p < 0.05).
Discussion
Genomics and proteomics technology have great potential application for disease diagnosis and therapy and for evaluating prognosis. 24 The aim of proteomics is visualizing the proteins expressed in cells or tissues and enabling their systematic study. Comparative proteomics is used to identify differentially expressed proteins from cells or tissues by comparing two or more 2-DE protein profiles. It has been applied in many diseases to identify potential early biomarkers and molecular targets of drugs. Protein expression profiles always change in tandem with phenotypic and behavioral alterations when cancer develops from normal tissue, and comparative proteomics is a powerful tool for discovering these changes.
In this study, 2-DE and MALDI-TOF/TOF-MS identified 29 differentially expressed protein spots in the ESCC and paired normal tissues. There was at least two-fold difference in the expression of these proteins between the ESCC and paired normal tissues. Among them, PA28β was significantly underexpressed in 10 cases of ESCC, and we selected it for further study because of its potential role in the natural history of ESCC.
Proteasomes are large and multicatalytic proteinase complexes (molecular weight ~700 kDa) found in eukaryotes and are known as adenosine triphosphate–dependent proteolytic enzymes involved in antigen presentation of major histocompatibility complex (MHC) class I molecules.25–30 In eukaryotic cells, proteasomes are involved in specific processes, including the cell cycle, regulation of transcription, and antigen processing.31,32 These processes require precise regulation of proteasome activity, and a number of regulatory proteins have been identified. One such regulator, designated PA28, was identified in a variety of mammalian, including humans, as an activator of the multiple peptidase activities of proteasomes. 33 PA28 is an activator of the 20S proteasome. There are three PA28 subunits, namely, alpha, beta, and gamma. PA28β, also known as PMSE2, is found mostly in the cytoplasm of all cell types. 34 As a modulator of proteasome-catalyzed generation of peptides presented via MHC class I molecules, previous studies mainly focused on the function of PA28β in MHC class I antigen presentation, while the influence of PA28β on tumor epitope presentation has not been analyzed further. Recently, a few controversial studies reported that PA28β expression was altered in some cancer cell lines and cancer tissues through different means. The earliest of such studies, by Matsui et al., 35 used reverse transcription-PCR and reported diminished PA28β expression in two oral squamous cell carcinoma (OSCC) cell lines, HSC5 and HSC7. Miyagi et al. 21 used reverse transcription-PCR and found that DLD-1 human colon cancer cells were deficient in proteasome subunit expression, including PA28β. In 2009, Tang et al. 36 presumed that PA28β expression in OSCC cell lines was reduced in comparison with that in a normal epithelial cell line. More recently, Kim et al. 22 and Huang et al. 19 reported decreased PA28β expression in lung cancer and GA tissues following 2-DE and MALDI-MS, respectively. 9 In contrast, researchers using proteomics detected PA28β overexpression in gastric cancer 9 and renal cell carcinoma. 37 Similarly, PA28β expression was increased in endometrial cancer tissue. 38
In this study, PA28β was downregulated in most ESCC tissues compared to the paired normal tissue. Western blotting and IHC analyses confirmed the 2-DE detection of decreased PA28β expression, verifying the decreased PA28β expression in the ESCC tissues (western blot, 77.5%; IHC, 70%). However, PA28β expressions were found increased in partial ESCC samples. The inconsistent results may be due to the antibody specificity and/or the different compositions of patient cohort that is similar to previous report. 39 The results also showed that decreased PA28β expression was unrelated to patient sex, age, pathohistological type, or differentiation grade. Decreased PA28β expression was detected in both early- and late-stage ESCC, suggesting that PA28β is a potential biomarker for early ESCC.
The antigen presentation of MHC class I molecules requires the coordinated expression of numerous components, including proteasomes and its activator PA28. The proteasome system represents the major source of MHC class I–presented peptides exposed to cytotoxic T lymphocytes (CTLs). Tumor cells may alter the expression of these components to decrease MHC class I presentation, allowing them to escape immune surveillance. However, PA28β or PA28α expression can alter the immunological phenotype of tumor cells. Sun et al. 40 reported that melanoma cells lacked the interferon-γ-inducible proteasome activator PA28, the proteasomes did not display the tyrosinase-related protein 2 (TRP2)360–368 epitope to specific CTLs, and restoring PA28 expression rescued the presentation of the CTL epitopes completely. Huang et al. 19 found that PA28β overexpression inhibited MKN45 GA cell growth, proliferation, and tumorigenicity. In this study, PA28β overexpression also inhibited cell growth, proliferation, and malignancy of TE-1 cells. A subsequent study by Zheng et al. 41 showed that gastric cancer cells with attenuated PA28β expression are highly invasive and can metastasize and speculated that the possible molecular mechanism involved PA28β and chloride intracellular channel 1 (CLIC1) playing important roles in GA invasiveness. These data suggest that PA28β downregulation is one of the means by which tumor cells escape immune surveillance and alter their biological characteristics. Thus, we speculate that decreased PA28β expression attenuates the presentation of the tumor epitope of ESCC and results in immunological escape. In this study, PA28β could be considered as a potential biomarker of ESCC, but like many other tumor markers for this cancer, this protein also has shown downregulation in esophageal cancer, an event that has already been observed for p53, RBC, MCC, DCC, RB, Tropomyosin Beta, CDK inhibitors, as well as many other proteins; the major problem with this cancer which is more under influence of tumor suppressor genes rather than oncogenes. Since downregulated proteins are hard to follow in the blood or other body fluids, or if there is a downregulation, it is hard to judge whether downregulation is due to cancer or by other means; still in case of this cancer, looking for a specific marker with an increased amount in the body fluids remains to be pursued.
Upper gastrointestinal tumors involving the esophagus and the stomach are a serious public health problem worldwide. 42 Further investigations are needed to study the mechanism of the effects of PA28β on biological characteristics of TE-1 cells and whether the downregulation of PA28β is followed in the blood or other body fluids. The results will shed more light on the detailed mechanisms concerning the role of PA28β in ESCC.
In conclusion, the results of this study showed that the expression level of PA28β was significantly decreased in ESCC tissue. And further analysis via PA28β overexpression indicated that PA28β could inhibit growth, proliferation, and malignancy of TE-1 cells. The present studies offer promise for PA28β as a potential biomarker for ESCC.
Footnotes
Declaration of conflicting interests
The author(s) declared no potential conflicts of interest with respect to the research, authorship, and/or publication of this article.
Funding
The author(s) disclosed receipt of the following financial support for the research, authorship, and/or publication of this article: This work was supported by grants from National Health and Family Planning Commission to Build a Scientific Research Fund (Grant No. WKJ-FJ-37) and the Natural Funds of Science and Technology Department of Fujian (Grant No. 2014J01405).