
Abstract
Acute myeloid leukemia is driven by leukemic stem cells which can be identified by cross lineage expression or arrest of differentiation compared to normal hematopoietic stem cells. Self-renewal and lack of differentiation are also features of stem cells and have been associated with the expression of embryonic genes. The aim of our study was to evaluate the expression of embryonic antigens (OCT4, NANOG, SOX2, SSEA1, SSEA3) in hematopoietic stem cell subsets (CD34+CD38− and CD34+CD38+) from normal bone marrows and in samples from acute myeloid leukemia patients. We observed an upregulation of the transcription factors OCT4 and SOX2 in leukemic cells as compared to normal cells. Conversely, SSEA1 protein was downregulated in leukemic cells. The expression of OCT4, SOX2, and SSEA3 was higher in CD34+CD38− than in CD34+CD38+ subsets in leukemic cells. There was no correlation with biological characteristics of the leukemia. We evaluated the prognostic value of marker expression in 69 patients who received an intensive treatment. The rate of complete remission was not influenced by the level of expression of markers. Overall survival was significantly better for patients with high SOX2 levels, which was unexpected because of the inverse correlation with favorable genetic subtypes. These results prompt us to evaluate the potential role of these markers in leukemogenesis and to test their relevance for better leukemic stem cell identification.
Keywords
Introduction
Acute myeloid leukemia (AML) is characterized by the expansion and resistance to apoptosis of myeloid cells blocked in early stages of differentiation. 1 AML is a heterogeneous disease arising as a consequence of molecular events implicating genes controlling cell proliferation, differentiation, and epigenetics that cooperate to promote the leukemic clone. 2 The capacity to initiate and maintain leukemia, at least in vitro and in xenotransplant models, is however limited to a fraction of the leukemic population, termed leukemic stem cells (LSCs), which retains or reacquires self-renewing properties, as well as the capacity to remain in a poorly differentiated stage.3–5 LSC persistence is probably the main source of relapse in patients in complete remission (CR) after induction treatment. Indeed, there is a strong correlation between the proportion of LSC at diagnosis and in remission and the risk of relapse and death from leukemia. 6
The first studies defined the phenotype of both hematopoietic stem cells (HSCs) and LSCs with the differentiation markers CD45dim, CD34, and CD38, as CD34+CD38−.4,5,7 Additional markers have been investigated to specifically identify LSCs, such as lectin-like C-like molecule-1 (CLL-1) or aberrant expression of lineage markers (CD19+, CD33−, CD7+, CD56+).8–10 More complex combinations of normal and aberrant expression of differentiation antigens have been proposed recently (HLA-DR−, CD123+, CD133+, CD44+, CD96+, CD90+).11–13 However, the nature of LSC is still controversial. Other studies show that leukemia may arise at the early progenitor level rather than at HSC level. 14 This raises the hypothesis of the reacquisition by more mature cells of self-renewal and cell proliferation properties in order to maintain long-term leukemic hematopoiesis.
Embryonic stem cells exhibit characteristics of self-renewal, arrest of differentiation, and pluripotency. The genes controlling these properties have been recently identified. They encode a variety of transcription factors (OCT4, the product of POU5F1, SOX2, and NANOG) and surface markers (SSEA1 also called CD15, 15 the product of FUT4 and SSEA3) whose overexpression has been proved to be able to restore pluripotency in mouse and human somatic cells. Takahashi and Yamanaka 16 reported that the overexpression of a cocktail of four transcription factors (OCT4, SOX2, c-Myc, and KLF4) in adult fibroblasts induces a pluripotent state. C-Myc and KLF4 act as oncogenes and are also involved in somatic cell reprogramming into pluripotency. 17 Taken together, these experiments reveal the ability of somatic cells to reacquire pluripotency and other characteristics of stemness. Thus, it may be hypothesized that alterations in the expression of one or more of these genes could contribute to transformation of normal cells into malignant somatic cells carrying tumor-forming capacities.
The aim of our study was to compare the embryonic stem cell antigen (ESCA; OCT4, NANOG, SOX2, SSEA1 and SSEA3) expression in leukemic versus normal marrow cells and to investigate correlations with biological and clinical characteristics.
Materials and methods
Cell lines
The ESCA expression was investigated in eight human-derived cell lines: NTERA-2, derived from an embryonic carcinoma as positive control; KG1a (poorly differentiated AML); HL60 (AML with promyelocytic differentiation); NB4 (promyelocytic AML with PML-RARα fusion gene); KASUMI (AML with t(8;21) and RUNX1-RUNX1T1 fusion gene); ME-1 (AML with inv(16) and CBFβ-MYH11 fusion gene); THP-1 (monoblastic cell line); and U937 (derived from a histiocytic lymphoma). NTERA-2, KG1a, HL60, THP-1, and U937 cell lines were purchased from American Type Culture Collection (Manassas, USA); NB4, KASUMI, and ME-1 were from Leibniz-Institut DSMZ-German Collection of Microorganisms and Cell Cultures. HL60, KG1a, THP-1, U937, KASUMI, and ME-1 lines were cultured in RPMI-1640 medium (Eurobio, Les Ulis, France) supplemented with 10% fetal bovine serum (FBS; Eurobio) or 20% for ME-1. The NTERA-2 cells were cultured in Dulbecco’s Modified Eagle’s Medium (DMEM; Sigma-Aldrich, St. Louis, MO, USA) with 10% FBS. The NB4 cells were cultured in Iscove’s Modified Dulbecco’s Medium (ISCOVE) (Sigma-Aldrich) with 10% FBS. Experiments were performed during the exponential growth phase.
Primary AML cells
AML cells from 103 consecutive patients referred to the Institut de Cancérologie Lucien Neuwirth, Saint-Priest-en-Jarez, France were collected at diagnosis. Patients were aged 3 to 88 years (median 69 years). All patients or their tutor gave written informed consent according to institutional procedure.
The diagnoses were AML with a t(15; 17) and PML-RARα fusion gene in eight cases, AML with inv(16) and CBFβ-MYH11 fusion gene in six cases, AML with t(8; 21) and RUNX1-RUNX1T1 fusion gene in three cases. The karyotype was normal in 44 patients and complex in 42 patients.
In addition, 40 samples harvested after induction treatment from patients in complete cytological remission were studied. Overall, 10 normal bone marrows (BMs) obtained from healthy donors for allogeneic BM transplantation were processed in the same conditions in order to set a control group.
Flow cytometry
Samples
Before staining, for NTERA-2, cells were detached with Trypsine/Versène (EDTA; Eurobio) for 3 min. For primary leukemic cells and normal marrows, erythrocytes were lysed with fluorescence-activated cell sorting (FACS) lysing solution (BD Biosciences, San Jose, CA, USA). Then, 106 cells were incubated with a combination of antibodies (Table 1) with surface antigen (human leukocyte differentiation antigen) and two ESCA (SSEA1 and SSEA3) for 15 min at room temperature, sheltered from light. For intracellular antigen studies (NANOG, OCT4, and SOX2), cells were fixed (BD Cytofix Fixation Buffer; BD Biosciences), permeabilized with a solution of PermWash Buffer (BD Perm/Wash Buffer; BD Biosciences), and incubated with the antibody for 20 min at room temperature in the dark. Three isoforms of OCT4 have been described (OCT4A, OCT4B, and OCT4B1). 18 These variants are reported to be stem cell–specific but only OCT4A can be directly functionally linked to pluripotency. 19 We used the clone to OCT4 which recognizes isoforms A and B.
MFC antibodies used.
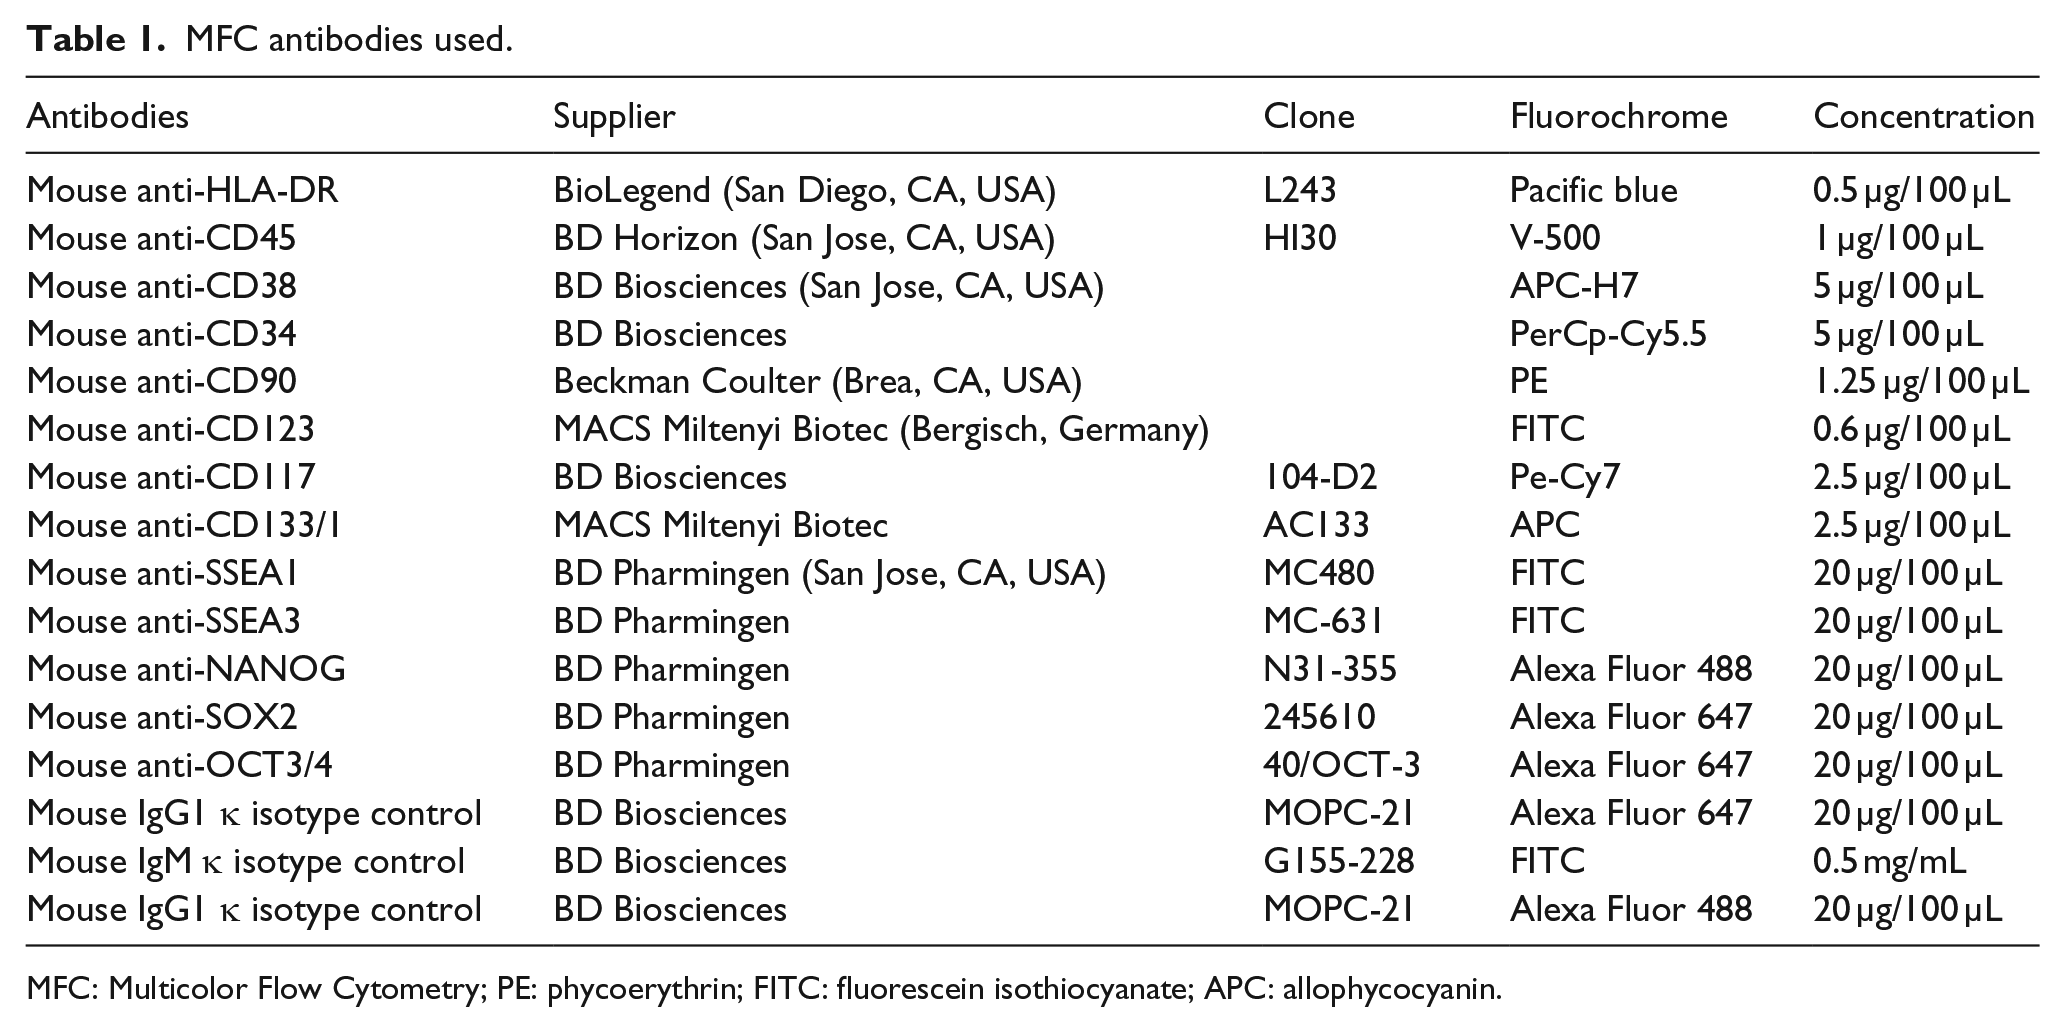
MFC: Multicolor Flow Cytometry; PE: phycoerythrin; FITC: fluorescein isothiocyanate; APC: allophycocyanin.
Non-specific binding of antibodies was assessed in initial experiments using an isotype control. 20 All isotypes were immunoglobulin (Ig) subtype matched and used at the same protein concentration as the corresponding antibody. Three AML BMs and three normal BMs were studied. Data were acquired using a FACSCanto II cytometer and FACS Diva software (BD Biosciences) and analyzed by Infinicyt™ V1.6.0 software (Cytognos, Salamanca, Spain). The cytometer settings were conformed to FranceFlow recommendations and the instrument quality control was checked on a daily basis. The results were expressed as the ratio of mean fluorescence intensities (MFIs) of marker of interest to the MFI of the relevant isotype control.
Analysis strategy
A CD45/SSC-based leucocyte gate was used to discriminate different cell populations. In the CD45+/low compartment, the more mature cells including mastocytes and plasmacytoid dendritic cells were eliminated using HLA-DR, CD117, and CD123 expression. The hematogones were eliminated using SSClow FSClow and CD38+/high. The rest of cells were separated into three subpopulations: CD34+CD38−/low, CD34+CD38+, and CD34−CD38+/low cells. Inside the CD34+CD38−/low population, CD90 allowed the identification of the committed primitive lineage HSC/progenitor cell subpopulation.
Quantitative reverse transcription polymerase chain reaction
Total ribonucleic acid (RNA) from cell lines, 16 leukemic samples (4 with t(8;21), 4 with inv(16), 4 with t(15;17), and 4 with normal karyotype) and 4 normal bone marrow mononuclear cells (MNCs), was extracted using a chloroform phenol extraction method. For each sample, 1 µg RNA was reverse transcribed into complementary DNA (cDNA). The primers were obtained from Applied Biosystems (Foster City, CA, USA; Table 2). The HMBS gene was used as an endogenous control to normalize the expression data. This gene is weakly expressed in stem cells and is adequate for quantitative reverse transcription polymerase chain reaction (qRT-PCR) studies. 21 Reactions were run on a 7900HT Fast Real-Time PCR System (Applied Biosystems) with the following settings: 50°C for 2 min and 95°C for 10 min, followed by 50 cycles at 95°C for 15 s and 60°C for 1 min. The relative gene expression was analyzed using the 2−ΔΔCt method and normalized to the control. Mean data were averaged from triplicates.
Primers used for quantitative RT-PCR (TaqMan gene expression assay).

RT-PCR: reverse transcription polymerase chain reaction.
Statistical analysis
Two-sided Student’s t tests (paired when appropriate) were used to compare mean expression levels. Chi-square tests (or Fisher’s exact tests when one group included less than 10 units) were used to compare proportions. p values below 0.05 were considered to be statistically significant. Survival curves were plotted according to the Kaplan–Meier method. Survival of patient groups was compared using the log-rank test. Analysis and figure plotting were performed with GraphPad Prism5 software (GraphPad, La Jolla, CA, USA).
Results
Cell lines
ESCA markers were expressed on most cell lines, with variable intensity. With the exception of SSEA1, the highest levels were observed on the control embryonic cell line NTERA-2. High levels of all five embryonic markers were noted on KG1a and HL60, while lower levels were observed on lines harboring recurrent genetic anomalies such as NB4 (PML/RARα rearrangement), KASUMI, and ME-1 (CBF rearrangement). Monocytic lines (THP-1 and U937) exhibited intermediate levels for most markers. Detailed results of flow cytometry are presented in supplemented file (Table S1A).
Flow results were confirmed by qRT-PCR for POU5F1, NANOG, SOX2, and FUT4 (Table S1B). A majority of cell lines were positive for the genes tested, with 2−ΔΔCt ranging from 1 to 33.
Normal bone marrow
In flow cytometry, 2 of 10 normal marrow samples were considered positive in the CD34+ population for the expression of OCT4, 3 for NANOG, 3 for SOX2, and 5 for SSEA3. The level of expression was always low, with Mean Fluorescence Intensity Ratio (MFIR) ranging from 2.1 to 4. Results were similar for the CD45low (“myeloblast”) population. There was no significant difference between the MFIR of CD34+CD38− and CD34+CD38+ subsets. Concerning neutrophilic polynuclear cells, we observed as expected strong expression for SSEA1/CD15 (MFIR = 24).
Initial experiments did not show a difference in threshold positivity whether cells were incubated with the isotype control or not (Figure 1(a)). In addition, we observed that the MFIR of normal lymphocytes (MFIR = 1.8) was the same as the MFIR of patient lymphocytes (MFIR = 1.7). So, for the rest of the analysis of the study, we used the lymphocytes as a negative control.
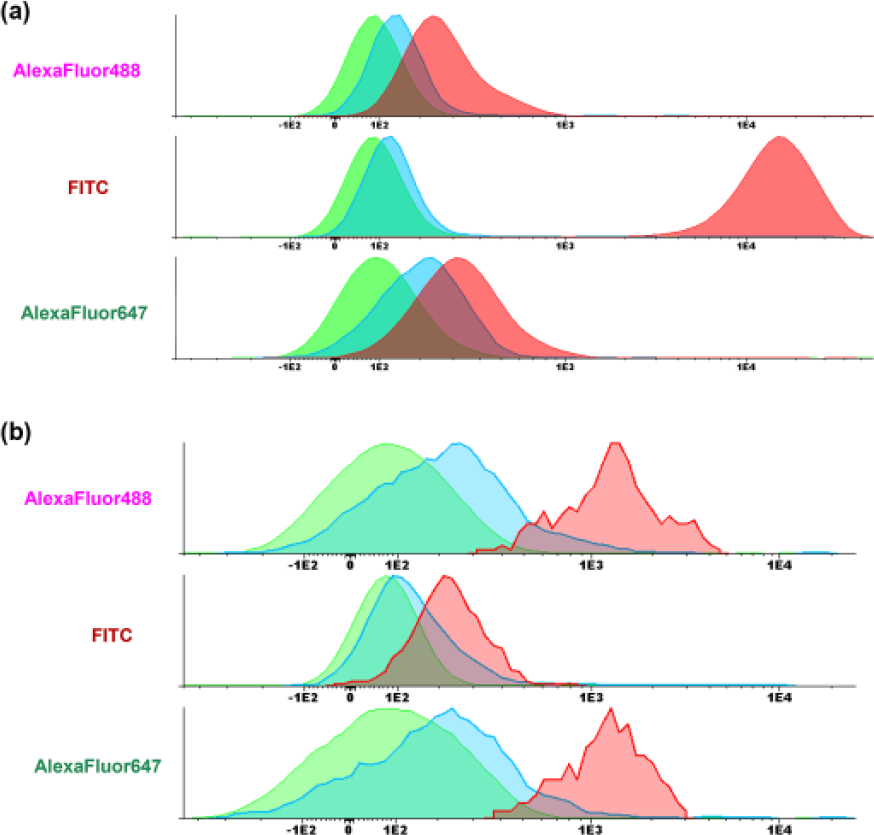
Fluorescence differences between lymphocytes, isotype controls, and conjugated antibody. (a) Comparison between lymphocyte cell population (green), CD45low population stained with isotype controls (blue), and CD45low population stained with conjugated antibody (red; Alexa Fluor 488 Mouse Anti-Human NANOG, FITC Mouse Anti-Human SSEA1, and Alexa Fluor 647 Anti-Human SOX2, respectively) in normal BM. (b) Comparison between lymphocyte cell population (green), CD45low population stained with isotype controls (blue), and CD45low population stained with conjugated antibody (red; Alexa Fluor 488 Mouse Anti-Human NANOG, FITC Mouse Anti-Human SSEA1, and Alexa Fluor 647 Anti-Human SOX2, respectively) in AML BM. SSEA1 was positive in (a) normal cells; NANOG and SOX2 were positive in (b) leukemic cells.
Patient cells
We investigated the expression of ESCA in the whole CD45low population and in the more immature subsets CD34+ and CD34+CD38−. Multicolor Flow Cytometry (MFC) allowed the identification of those subsets. As for normal marrows, initial experiments with isotype control showed that lymphocytes could be used as negative control (Figure 1(b)).
All samples were positive for at least one marker. Overall, OCT4, NANOG, SOX2, SSEA1, and SSEA3 were found positive in the CD34+ population in about 36%, 28%, 35%, 40%, and 28% of cases, respectively (Table S2A). The levels of expression were significantly higher in leukemic than in normal cells for all markers except SSEA1 (p < 0.01 for OCT4, p < 0.001 for NANOG and SOX2, and p < 0.05 for SSEA3; Figure 2(a)). The difference was also significant between leukemic and normal cells in the subcompartments CD34+CD38−CD90+ (p < 0.01 for OCT4 and NANOG and p < 0.05 for SOX2) (Figure 2(b)). On the contrary, the membrane protein SSEA1 was more expressed in normal CD34+CD38−CD90+ cells (mean MFIR 13.9) as compared to leukemic CD34+CD38−CD90+ cells (mean MFIR 5.8, p < 0.001; Figure 2(b)). We also evaluated the expression of ESCA in CD90+ and CD90− subfractions of immature populations. The specificity of CD90 staining was checked by immunofluorescence on cytospin sample (data not shown). We did not observe differences in expression of ESCA in the immature (CD34+CD38−) leukemic subset according to CD90 positivity (Table S2B).
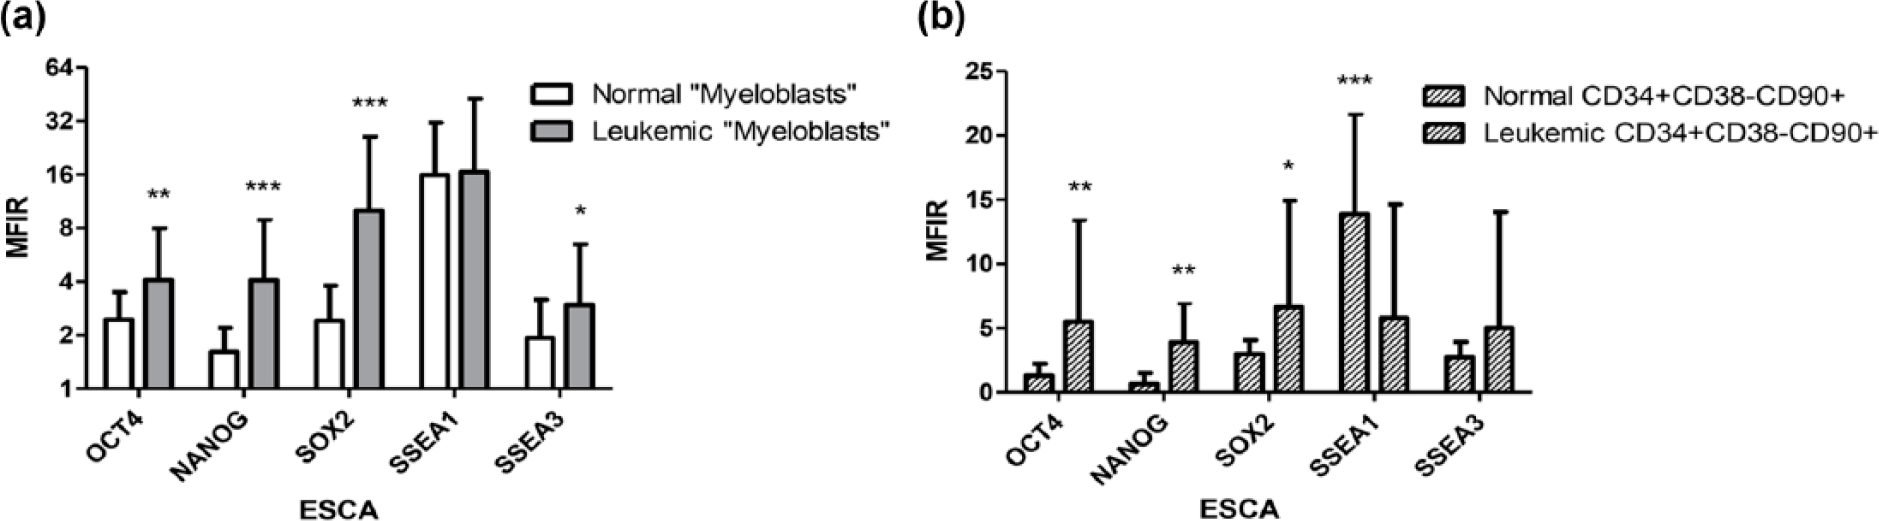
Expression of ESCA in different normal and leukemic compartments. (a) Expression of ESCA in normal and leukemic CD45low compartments. (b) Expression of ESCA in normal and leukemic CD34+CD38−CD90+ subcompartments. Mean fluorescence intensity ratio is expressed as mean ± SD in 10 controls and 103 AML patients. The expression of ESCA was considered positive when MFIR was ≥2 and when 20% of cells at least expressed markers in the target population. Means were compared by Student’s t test (*p < 0.05, **p < 0.01, and ***p < 0.001).
qRT-PCR was performed in 16 leukemic samples for POU5F1, NANOG, SOX2, and FUT4 (Figure 3). The results were positive in most of the cases, with 2−ΔΔCt ranging from 4 to 37. There was a good correlation between positivity by qRT-PCR and MFC for markers OCT4/POU5F1, NANOG, and SOX2.
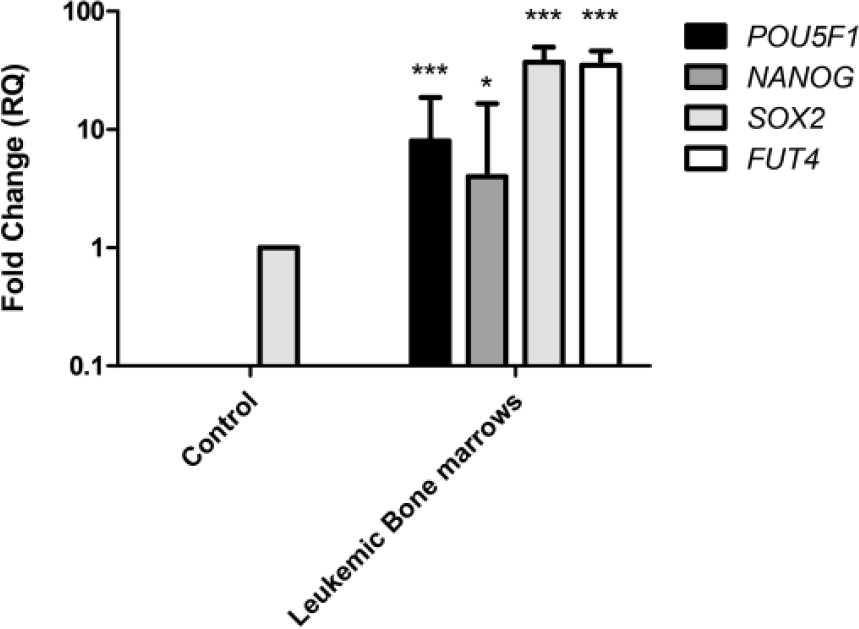
ESCA gene expression analysis by qRT-PCR in bone marrow samples from AML patients versus control subjects. Gene expression of POU5F1, NANOG, SOX2, and FUT4 in leukemic bone marrows versus control. Fold changes in the respective gene expression are expressed as mean ± SD (n = 4 controls and 16 patients). Student’s t test was used to compare mean expression levels (*p < 0.05 and ***p < 0.001).
Furthermore, differences were observed between leukemias with recurrent molecular subtypes (Table S3). The expression of SOX2 was higher in leukemias with CBF rearrangements. Likewise, FUT4 levels were higher in AML with CBF rearrangements but not in promyelocytic leukemias. Finally, there was no association between POU5F1 and NANOG expression and any molecular or cytogenetic subtype.
Correlations with biological characteristics
Correlations with other significant clinical or biological features were examined. There was no correlation between the level of any marker MFIR (in blasts or CD34+ cells or subsets) and age, sex, World Health Organization (WHO) subtype, white blood cell counts, and marrow blast percentages. There was no correlation also between the percentage of CD34+ cells and the expression of ESCA in CD45low cells.
Prognosis
The prognostic value of ESCA expression was investigated in 69 patients treated by intensive chemotherapy. Overall, 29 patients aged 18–60 years were treated according to the GOELAMS AML 2006 IR protocol and 22 32 aged 61–75 years were treated according to GOELAMS LAM SA 2007 protocol. Eight patients with promyelocytic leukemias received the APL 2006 protocol. 23
CR was obtained in 100% (29/29) of younger patients and 59% (19/32) of older patients with non-promyelocytic leukemias and in 100% (8/8) of promyelocytic leukemias. This rate was not different according to the expression of any embryonic marker in CD34+ or CD45low cells (considered as positive or negative). Overall survival was not different, except for SOX2 which was associated with a better prognosis in SOX2-positive patients (Figure 4).

Kaplan–Meier survival analysis. Kaplan–Meier plot representing the overall survival for treated AML patients and the correlation between ESCA expression and survival (OCT4 (p = 0.8), NANOG (p = 0.2), SOX2 (p = 0.03), SSEA1 (p = 0.7), and SSEA3 (p = 0.2)). Patients with high antigen expression had longer survival time than those with low expression. For Kaplan–Meier plots, the log-rank test was applied. Solid lines were corresponding to 20% or more of positive cells and dashed lines were corresponding to less than 20% of positive cells.
Expression in remission
In total, 40 patients were studied after induction treatment. Regarding patients in CR, the levels of all ESCA markers, except SSEA3, were significantly different from those measured at diagnosis and were within the range of those observed in control marrows (Figure 5). The difference was particularly striking for OCT4, NANOG, and SOX2.

Evaluation of ESCA expression by MFC during remission. Mean fluorescence intensity ratio of ESCA in leukemic CD34+CD38−CD90− compartment by MFC (n = 40 patients in complete remission). The expression of ESCA was considered positive when MFIR was ≥2 and when 20% of cells at least expressed markers in the target population. Means were compared by Student’s t test (***p < 0.001).
Discussion
In this article, we show, on a large series of AML patients, that proteins usually found in embryonic stem cells and germ cell tumors are detected on the surface of or within leukemic cells. The reexpression of embryonic antigens has been previously shown in solid tumours.24–26 Regarding hematological malignancies, fewer data are available, mainly in limited series of patients. The expression of OCT4, NANOG, and SOX2 has been investigated by qRT-PCR and immunofluorescence in leukemic cell lines. These transcription factors may be implicated in the pathogenesis of MLL/AF9 leukemias. 27 KLF overexpression has also been observed in hematological cancers (acute lymphoblastic leukemia, hairy cell leukemia, multiple myeloma). 28 Recently, Yin et al. 29 described a high expression of OCT4 by quantitative PCR (qPCR) in a series of 87 AML patients. By flow cytometry, we observed the expression of ESCA markers in all hematopoietic cell lines and in leukemic cells of most patients, regardless of the type of AML. OCT4 expression was higher in less differentiated leukemias, while SSEA1 levels were higher on more differentiated subtypes, which is consistent with the steady expression of this receptor along with myeloid differentiation, and on granulocytes. Gene expression was also assessed by qRT-PCR in cell lines and in some fresh leukemia samples with similar results. On the contrary, we found very low levels in normal hematopoietic cells.
MFC allowed identification of specific subpopulations. In leukemic cells, the expression of OCT4, NANOG, SOX2, and SSEA3 was significantly higher in the immature CD34+CD38−CD90− compartment than in the more mature CD34+CD38+CD90− compartment. In contrast, we observed a lower expression of membrane protein SSEA1 in all leukemic compartments. This suggests that OCT4, NANOG, SOX2, and SSEA3 could be markers of leukemic stemness. However, our results appear to be in contradiction with those obtained by gene expression profiling. Gentles et al. 30 described a LSC expression signature based on 52 genes, which did not include the genes in our report. These discrepancies may have different explanations: first, the “stem cell” population, although it was defined by the same markers (CD34+CD38−), it was not isolated by the same technique (cell sorting versus gating in MFC). Second, the study by gene profiling evaluated a limited number of cases (n = 7) which can lead to sample variation. Third, the CD34+CD38− population is heterogeneous and may not be representative of the “true” LSC. Experiments of xenotransplant with leukemic cell populations sorted on the expression of embryonic markers would be necessary to solve this issue.
The role of ESCA in leukemogenesis remains to be investigated. OCT4 and SOX2 are two of the Yamanaka’s factors, which can transform differentiated cells into pluripotent stem cells with embryonic properties. 16 OCT4 is necessary for self-renewal, pluripotency, and maintenance of undifferentiation.31–35 The forced expression of OCT4 transdifferentiates skin fibroblasts into hematopoietic cells without going through a stage of embryonic stem cells. 36 NANOG and SOX2 also promote self-renewal and maintain pluripotency of ESCA. Eberle et al. 37 hypothesized that the transcriptional activation of NANOG2 would induce the stemness in leukemic cells with MLL rearrangements. Although it has been demonstrated that each of these transcription factors have a specific role, NANOG, OCT4, and SOX2 cooperate to maintain stemness and pluripotency of embryonic cells.34,38 SSEA1 and SSEA3 are receptors expressed by embryonic stem cells and play a major role in embryonic development.39,40 However, SSEA1 is also present in differentiated cells, 15 while SSEA3 expression is restricted to the primitive stages of differentiation. 41
The presence of embryonic antigens in solid tumors is often associated with poor prognosis.24–26 We did not observe a prognostic role for high expression of ESCA, with the exception of SOX2 which was unexpectedly associated with a better survival. SOX2 levels were higher in CBF leukemias, a subtype of better prognosis when treated with high-dose cytarabine. In a series of 87 AML patients, Yin et al. 29 showed a trend for better overall survival in younger patients without OCT4 high expression (assessed by qPCR) but no significant effect on survival of the total population or on CR rates. AML is a very heterogeneous disease, and prognosis is mainly driven by cytogenetics and molecular characteristics. Larger series would be necessary to further investigate by multivariate analysis the prognostic value of ESCA expression in each AML subtype. On the contrary, we are investigating the value of ESCA combined with other aberrant markers to assess minimal residual disease (MRD). This evaluation relies mainly on the identification of aberrant phenotypes to discriminate leukemic cells from their normal counterpart. Our preliminary data show that the expression of most embryonic markers is significantly different at diagnosis and in remission. Therefore, the addition of novel markers to MRD assessment panels could help identifying those residual leukemic cells in remission.
In conclusion, we present here evidence that proteins that maintain stemness in embryonic cells are expressed in AML cells, particularly in the less differentiated subset of the leukemic population. The role of OCT4, NANOG, and SOX2 needs to be investigated in this context in order to know whether they are directly implicated in oncogenesis or are only a consequence of an abnormal differentiation pattern. These markers may be useful for the identification of residual leukemic cells and assessment of treatments.
Footnotes
Acknowledgements
The authors thank the association “Les Amis de Rémi” for their financial support and BD Biosciences for providing monoclonal antibodies.
Ethical approval
All patients or their tutor gave written informed consent according to institutional procedure.
Declaration of conflicting interests
The author(s) declared no potential conflicts of interest with respect to the research, authorship, and/or publication of this article.
Funding
The author(s) received no financial support for the research, authorship, and/or publication of this article.
References
Supplementary Material
Please find the following supplemental material available below.
For Open Access articles published under a Creative Commons License, all supplemental material carries the same license as the article it is associated with.
For non-Open Access articles published, all supplemental material carries a non-exclusive license, and permission requests for re-use of supplemental material or any part of supplemental material shall be sent directly to the copyright owner as specified in the copyright notice associated with the article.