
Abstract
Dysregulation of NKD1 has been identified in several solid tumors. However, the status of NKD1 expression and its clinical implication in acute myeloid leukemia remain largely elusive. NKD1 transcript level in bone marrow mononuclear cells was detected by real-time quantitative polymerase chain reaction in 126 de novo acute myeloid leukemia patients and 30 controls. Clinical significance of NKD1 expression was obtained by the comparison between the patients with low and high NKD1 expression. NKD1 messenger RNA level was significantly decreased in acute myeloid leukemia patients compared with controls (p = 0.019). There were no significant differences between patients with low and high NKD1 expression in sex, age, peripheral blood cells, bone marrow blasts, French–American–British/World Health Organization subtypes, and karyotypes/karyotypic classifications (p > 0.05). Although no significant difference was observed in complete remission rate between NKD1low and NKD1high patients (p > 0.05), Kaplan–Meier analysis revealed that NKD1low patients showed shorter overall survival time than NKD1high patients in whole-cohort acute myeloid leukemia, non-M3 acute myeloid leukemia, and cytogenetically normal acute myeloid leukemia (p = 0.014, 0.063, and 0.020). Multivariate analyses disclosed the low NKD1 expression was an independent risk factor in cytogenetically normal acute myeloid leukemia patients (hazard ratio = 0.397, p = 0.017). Moreover, the prognostic value of NKD1 expression was confirmed by gene expression profile data in cytogenetically normal acute myeloid leukemia patients (p = 0.028 and 0.011). NKD1 showed significantly increased level after induction chemotherapy achieved complete remission in follow-up paired acute myeloid leukemia patients (p < 0.001). These findings indicated that reduced NKD1 expression is associated with unfavorable clinical outcome in cytogenetically normal acute myeloid leukemia.
Introduction
Acute myeloid leukemia (AML) is a group of clinical, biological, and etiological heterogeneous disease characterized by a clone of leukemic stem cells (LSCs).1,2 Despite the advancements in the treatment of leukemia, clinical outcome of AML remains unsatisfactory. Cytogenetic abnormalities play crucial roles in the process of leukemogenesis and also provide powerful information in predicting clinical outcome in AML.3,4 However, genetic changes are only found in approximately half of AML patients, and the rested patients are cytogenetically normal patients usually lacking the strongly prognostic biomarkers. 5 Recently, gene mutations including FLT3, CEBPA, NPM1, c-KIT, DNMT3A, U2AF1, N/K-RAS, TET2, and IDH1/2 together with aberrant gene expression, such as BAALC, ERG, MN1 and EVI1, were also reported to be associated with prognosis in cytogenetically normal acute myeloid leukemia (CN-AML). 6 All these findings open up a new horizon to identify promising biomarkers which can recognize the patients who are at the risk of poor outcome and are warranted to optimize treatment strategies.
WNTs-CTNNB1/β-catenin signaling pathways play crucial role in regulating various processes that are important for cancer progression, including tumor initiation, tumor growth, cell senescence, cell death, differentiation, and metastasis. 7 CTNNB1-independent WNT signaling pathways also contribute to oncogenesis and leukemogenesis in a context-dependent manner.7,8 The expression patterns of WNT signaling components can serve as a prognostic indicator in different cancers including AML.7,8 WNT-CTNNB1/β-catenin pathways are also regulated by a variety of secreted proteins, such as WNT inhibitory factors (WIFs) and secreted frizzled-related proteins (SFRPs) that can competitively displace certain WNT ligands from their receptors. 8 Naked family (NKD1 and NKD2) has been reported to function as a negative regulator of WNT-CTNNB1/β-catenin signaling pathway.9,10 NKD binds and inactivates dishevelled, a scaffold protein that transduces the WNT signal from the frizzled receptor to the destruction complex. 11 Reduced NKD1 expression has been increasingly demonstrated in several solid tumors.12–16 However, the status of NKD1 expression and its clinical implication in AML remain largely elusive. Therefore, we focused on the NKD1 expression and its clinical significance in de novo patients with AML.
Materials and methods
Patients’ samples
A total of 126 de novo AML patients and 30 healthy donors were included in the study approved by the Institutional Review Board of the Affiliated People’s Hospital of Jiangsu University. The diagnosis and classification of the patients were based on the revised French–American–British (FAB) classification and the 2008 World Health Organization (WHO) criteria.17,18 AML patients received chemotherapy including induction therapy and subsequent consolidation treatment. 19 Induction therapy was 1 or 2 courses of daunorubicin combined with cytarabine for non-M3 patients. Subsequent consolidation treatment included high-dose cytarabine, mitoxantrone with cytarabine, homoharringtonine combined with cytarabine, and etoposide in combination with cytarabine. Meanwhile, for M3 patients, oral all-trans retinoic acid (ATRA) together with daunorubicin and cytarabine were used for induction therapy. Maintenance therapy was oral mercaptopurine, oral methotrexate, and oral ATRA over 2 years. Bone marrow (BM) specimens were collected from all the participants after written informed consents were obtained.
RNA isolation, reverse transcription, and real-time quantitative polymerase chain reaction
Total RNA was isolated form bone marrow mononuclear cells (BMMNCs) and was reverse transcribed as reported previously. 20 The primers used for NKD1 (forward: 5′-AACCACTACTTAGATCTCGCCG-3′ and reverse: 5′-GAGCCGTTGCTGGAGCTCTG-3′) and ABL (forward: 5′-TCCTCCAGCTGTTATCTGGAAGA-3′ and reverse: 5′-TCCAACGAGCGGCTTCAC-3′) were as reported previously.12,13 NKD1 and ABL transcript level was detected by real-time quantitative polymerase chain reaction (RQ-PCR) performed on a 7500 Thermo cycler (Applied Biosystems, Foster City, CA, USA) using AceQ qPCR SYBR Green Master Mix (Vazyme Biotech Co., Piscataway, NJ, USA). The RQ-PCR reaction conditions were 95°C for 5 min, followed by 40 cycles at 95°C for 10 s, 65°C (NKD1) or 60°C (ABL) for 30 s, 72°C for 32 s, and 84°C (NKD1) or 75°C (ABL) for 32 s to collect fluorescence, finally followed by 95°C for 15 s, 60°C for 60 s, 95°C for 15 s, and 60°C for 15 s. Both positive (leukemic cell line samples, cultured in RPMI 1640 medium containing 10% fetal calf serum (ExCell Bio, Shanghai, China)) and negative controls (ddH2O) were included in each assay. Relative NKD1 expression levels were calculated using the following equation: N NKD1 = (E NKD1 )ΔCT NKD1 (control-sample)÷(E ABL )ΔCT ABL (control-sample). 20
High-resolution melting analysis and sequencing
N/K-RAS, DNMT3A, IDH1/2, c-KIT, and NPM1 mutations were detected by high-resolution melting analysis (HRMA) performed on the LightScanner platform (Idaho Technology Inc., Salt Lake City, UT, USA) as reported previously.21–24 All positive samples were confirmed by direct DNA sequencing. FLT3-ITD and CEBPA mutations were detected by direct DNA sequencing (BGI Tech Solutions Co., Shanghai, China).25,26
Statistical analyses
Statistical analyses were performed using the SPSS 20.0 software package. Mann–Whitney U test was carried out to compare the difference of continuous variables. Pearson chi-square analysis or Fisher exact test was employed to compare the difference of categorical variables. The impact of NKD1 expression on prognosis was analyzed by Kaplan–Meier analysis and Cox regression analysis and was further validated by the gene expression profiling (GEP) data (accession number GSE12417, http://www.ncbi.nlm.nih.gov/geo/) using the online web tool Genomicscape (http://genomicscape.com/microarray/survival.php). For all analyses, a two-tailed p < 0.05 was defined as statistically significant.
Results
NKD1 expression in AML
NKD1 transcript level in controls ranged from 0.000 to 1.167 (median, 0.113). However, NKD1 expression was significantly down-regulated in AML patients with a median level of 0.013 (range = 0.000–20.851, p = 0.019, Figure 1).

Relative expression levels of NDK1 expression in AML patients and controls.
Correlation between NKD1 expression and clinical/laboratory parameters in AML
In order to analyze the correlation between NKD1 expression and clinical/laboratory characteristics, the whole cohort of AML patients were divided into two groups at the median level of NKD1 expression defined as low NKD1 expression (NKD1low) and high NKD1 expression (NKD1high). Clinical characteristics of the patients in two groups were presented in Table 1. No significant differences were observed in sex, age, peripheral blood cells, and BM blasts between the NKD1high and NKD1low patients (p > 0.05). There were also no significant differences between the two groups in the distribution of FAB/WHO subtypes and karyotype/karyotypic classifications. Moreover, no significant correlations were found between NKD1 expression and 10 gene mutations (p > 0.05).
Comparison of clinical manifestations and laboratory features between the AML patients with low and high NKD1 expression.

WBC: white blood cells; FAB: French–American–British classification; WHO: World Health Organization classification; AML: acute myeloid leukemia; CR: complete remission; BM: bone marrow.
Association between NKD1 expression and prognosis in AML
Follow-up data in complete remission (CR) analysis were obtained in 109 AML patients. After one or two courses of induction therapy, NKD1low and NKD1high patients showed similar CR rate among whole-cohort AML (p = 0.562, Table 1) and non-M3 AML (17/31 (35%) vs 15/28 (35%), p = 1.000). In CN-AML, the patients with low NKD1 expression presented lower CR rate than those with high NKD1 expression (8/17 (32%) vs 13/11 (54%), p = 0.154).
Survival analyses were performed in 108 patients with follow-up data ranging from 1 to 58 months (median, 7 months). Kaplan–Meier analysis revealed that NKD1low patients had remarkable shorter overall survival (OS) time than NKD1high patients among whole-cohort AML (median = 5 vs 10 months, p = 0.014, Figure 2(a)). In non-M3 AML, NKD1low patients also showed shorter OS time than NKD1high patients (median = 5 vs 6 months, p = 0.063, Figure 2(b)). Moreover, NKD1low patients also presented obviously shorter OS time than NKD1high patients in CN-AML (median = 4 vs 14 months, p = 0.020, Figure 2(c)). We further performed Cox regression analysis to determine the prognostic value of NKD1 expression in whole-cohort AML and CN-AML patients. Variables included in univariate analysis were age (≤60 vs >60 years), white blood cells (WBCs; ≥30 × 109/L vs <30 × 109/L), karyotypic classifications (favorable vs intermediate vs poor), gene mutations (mutant vs wild-type), and NKD1 expression (high vs low). Multivariable analysis including variables in univariate analysis with p < 0.20 disclosed that low NKD1 expression was an independent risk factor in CN-AML (hazard ratio (HR) = 0.397, p = 0.017, Table 2) but not in whole-cohort AML patients (HR = 0.701, p = 0.158).
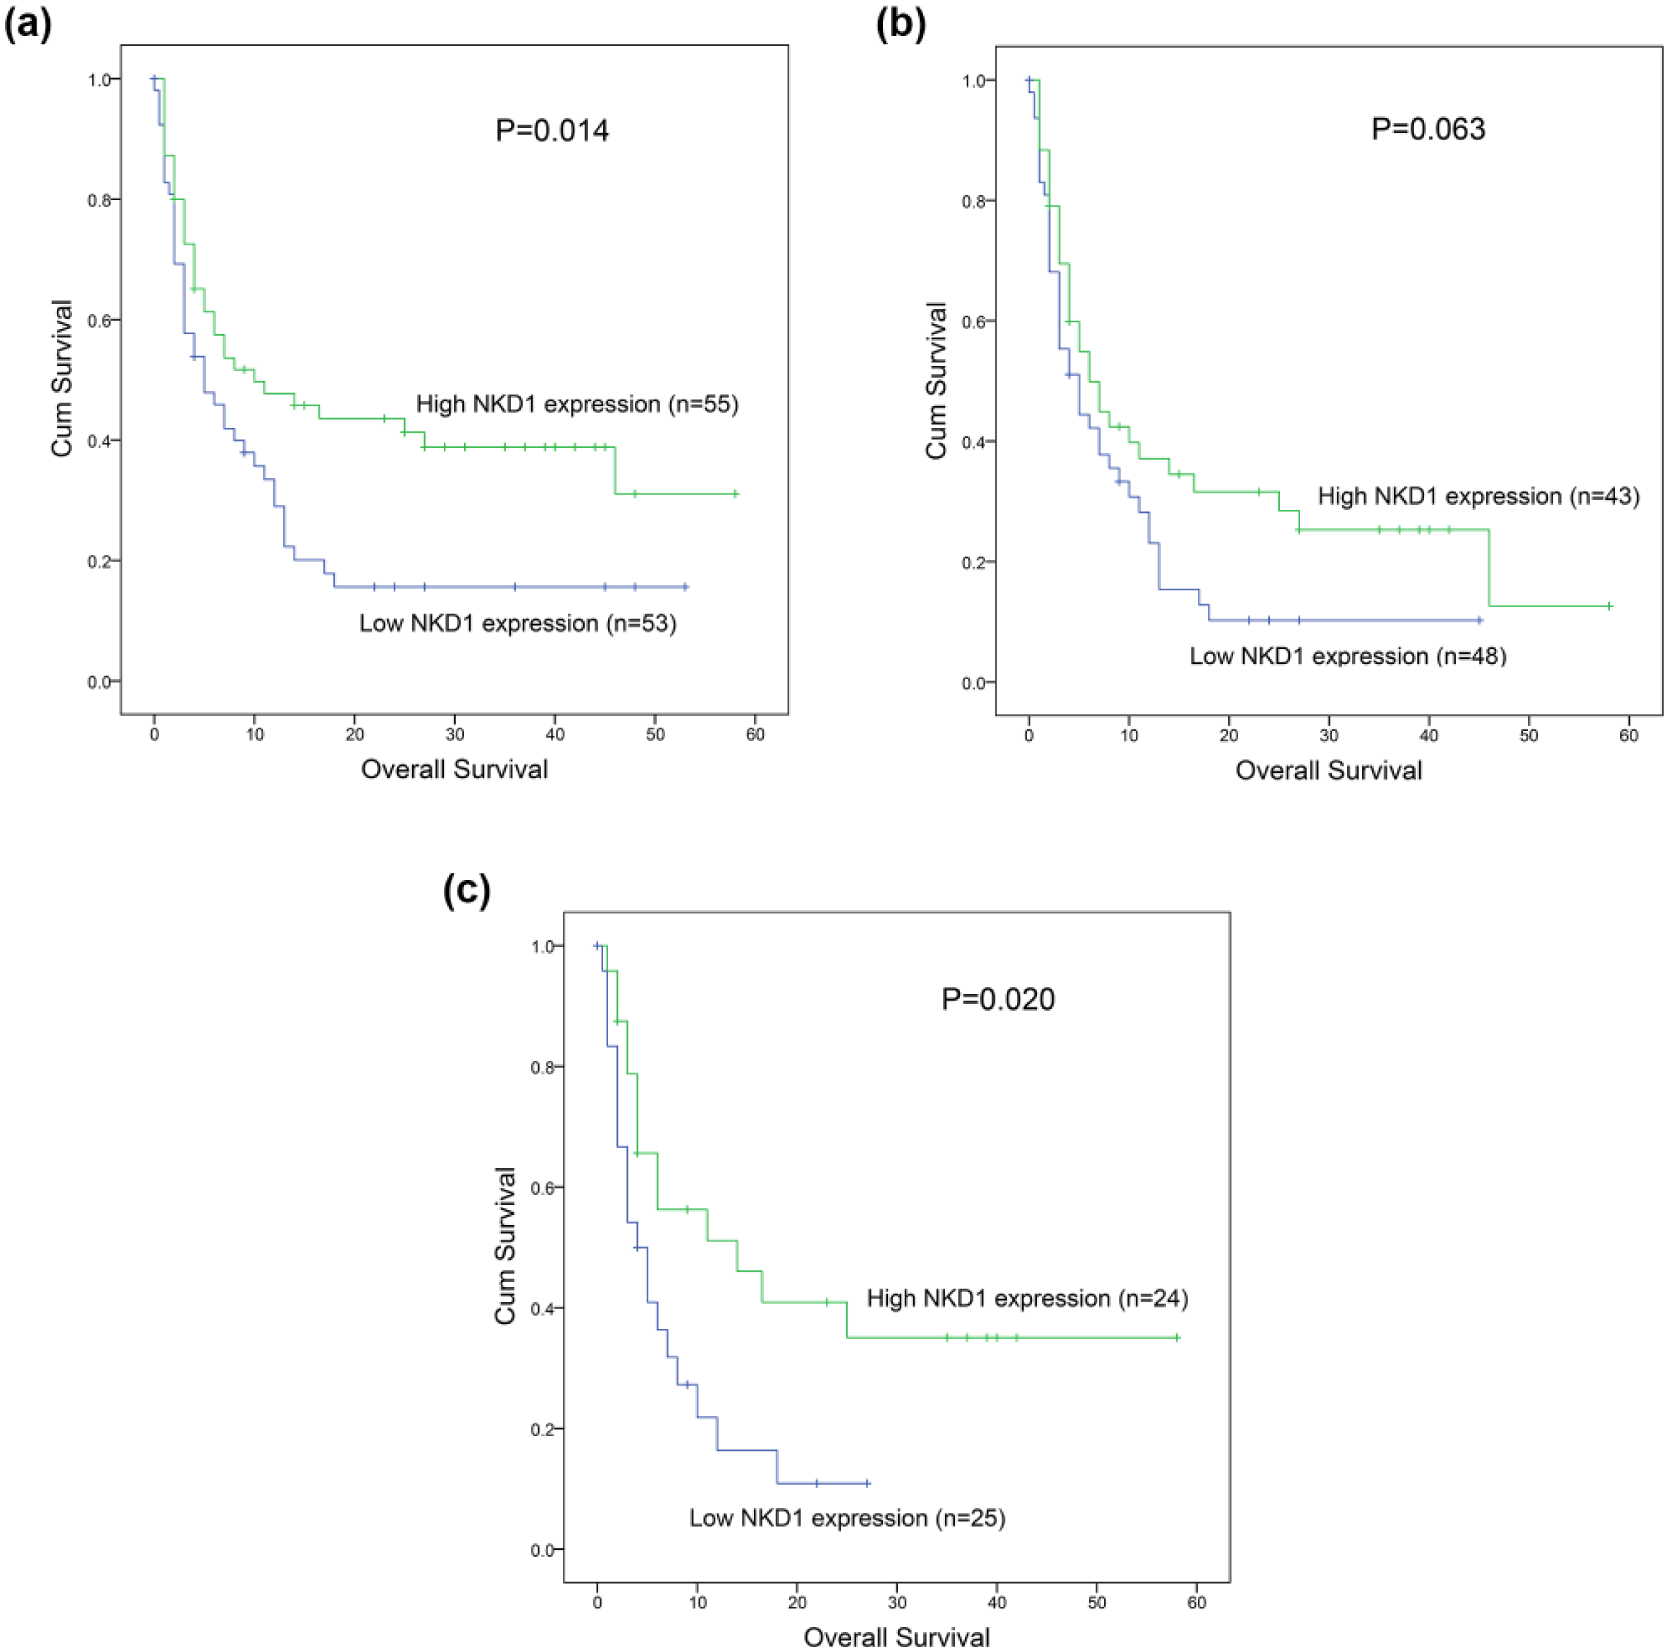
The impact of NKD1 expression on overall survival in AML patients: (a) whole-cohort AML patients, (b) non-M3 AML patients, and (c) cytogenetically normal AML patients.
Univariate and multivariate analyses of variables for overall survival in CN-AML patients.

CN-AML: cytogenetically normal acute myeloid leukemia; CI: confidence interval; WBC: white blood cells.
To further assess the prognostic value of NKD1 expression in CN-AML patients, we focused on the GEP data using the online web tool Genomicscape. 27 Besides one myelodysplastic syndrome patients with normal karyotype, NKD1low cases showed shorter OS time than NKD1high cases in a cohort of 162 CN-AML patients based on different cutpoint (p = 0.028 and 0.011, Figure 3(a) and (b)).

Prognostic value of NKD1 expression using gene expression profiling (GEP) data using the online web tool Genomicscape in cytogenetically normal AML patients based on different cutpoint: (a) cutpoint = 424.61, expression of 232203_at (NKD1); (b) cutpoint = 393.44, expression of 229481_at (NKD1).
Surveillance of NKD1 expression in follow-up AML patients
To further investigate whether NKD1 expression factored in patients’ response to therapy, we followed NKD1 expression of 12 patients from the initial diagnosis (ID) to CR after induction therapy. Our study revealed that NKD1 showed significantly increased level in CR than ID in follow-up paired AML patients (Figure 4).
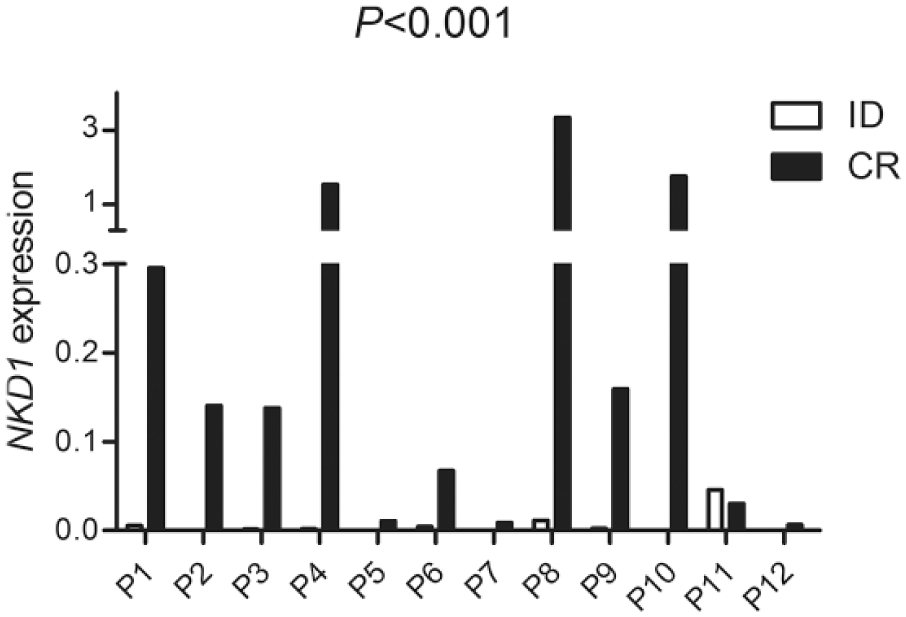
Changes of NKD1 expression in follow-up paired AML patients (n = 12) from the initial diagnosis (ID) to complete remission (CR).
Discussion
Recently, NKD family acting as WNT-CTNNB1/β-catenin signaling inhibitor played crucial role in tumorigenesis. Reduced NKD2 expression was found in osteosarcoma and had a significant role in driving tumor growth and metastasis. 28 Also, NKD2 restoration suppressed cell proliferation, colony formation, cell invasion, and migration; induced G2/M phase arrest; and sensitized cancer cells to docetaxel in human gastric cancer. 12 In breast cancer, although NKD2 had no influence on cell invasion and migration, over-expressed NKD2 suppressed breast cancer cell proliferation both in vitro and in vivo and induced G1/S arrest and inhibited WNT-CTNNB1/β-catenin signaling in breast cancer cells. 13 In addition, our previous studies demonstrated that NKD2 expression was down-regulated in de novo AML patients and correlated with poor clinical outcome in CN-AML patients (unpublished data). Compared with NKD2, the direct role of NKD1 in oncogenesis and cancer development was poorly revealed. Li et al. 29 found that overexpression of NKD1 in hepatocellular carcinoma cells inhibited migration and invasion in vitro and in vivo by repressing Rac1 expression level and activity, which affected the hepatocellular carcinoma cell cytoskeleton and E-cadherin expression. Interestingly, accumulating studies demonstrated dysregulation of NKD1 and its clinical significance in various types of cancers.12–16 Decreased expression of NKD1 probably caused by its promoter hypermethylation has been reported in human cancer including primary hepatocellular carcinoma, small lung adenocarcinoma, breast invasive ductal carcinoma, and gastric cancer.12–16 However, a few studies also observed increased expression of NKD1 in human hepatoblastomas and colon tumors.30,31 These results indicated that NKD1 played different roles in different types of human cancers. The purpose of this study was to explore NKD1 expression pattern and its clinical implication in AML.
Our study for the first time reported that NKD1 transcript level in BMMNCs was down-regulated in AML. Although no significant associations were observed between NKD1 expression and clinical/laboratory features as well as common gene mutations of AML patients, our study and the published GEP data observed that low NKD1 expression was correlated with shorter OS time in CN-AML. Multivariate analyses disclosed the reduced NKD1 expression was an independent risk factor in CN-AML patients. We did not observe the impact of common gene mutations on clinical outcome, which might be due to the small size of patients with mutations in our cohort. At the same time, Lv et al. 14 manifested that decreased NKD1 expression was also significantly correlated with lymph node metastasis, histological grade, estrogen receptor (ER) expression, and lower cumulative postoperative 5-year survival rate in breast cancer. In hepatocellular carcinoma, low NKD1 expression was significantly associated with tumor size more than 5 cm, intra or extra-hepatic metastasis, poor differentiation, and predicted adverse prognosis together with Rac1 overexpression.15,29 Furthermore, reduced NKD1 protein expression was correlated with histological type, poor differentiation, lymph node metastasis, TNM stage, and poor survival in non–small cell lung cancer. 16 These results suggested that NKD1 may play a vital role in oncogenesis as well as leukemogenesis and could be a novel biomarker and selective therapeutic target for the treatment of AML. Obviously, due to the limited cases in the cohort of CN-AML, further studies are required to verify our results before NKD1 expression could serve routinely as a promising indicator for risk stratification in de novo CN-AML.
In conclusion, down-regulation of NKD1 expression is a common event in de novo AML and also acts as an independent risk factor in CN-AML.
Footnotes
Acknowledgements
J.-d.Z. and D.-m.Y. contributed equally to this work.
Declaration of conflicting interests
The author(s) declared no potential conflicts of interest with respect to the research, authorship, and/or publication of this article.
Funding
This work was supported by National Natural Science foundation of China (81270630), Special Funds of “Ke Jiao Qiang Wei” Project of Jiangsu Province, 333 Project of Jiangsu Province (BRA2016131), Six Talent Peaks Project in Jiangsu Province (2015-WSN-115), China Postdoctoral Science Foundation funded project (2016M601748), Social Development Foundation of Zhenjiang (SH2015058, SH2016045, SH2016046), Social Development Foundation of Kunshan (KS1624), Key Medical Talent Program of Zhenjiang City.