
Abstract
Aberrant changes of N-glycan modifications on proteins have been linked to various diseases including different cancers, suggesting possible avenue for exploring their etiologies based on N-glycomic analysis. Changes in N-glycan patterns during epithelial ovarian cancer development have so far been investigated mainly using serum, plasma, ascites, and cell lines. However, changes in patterns of N-glycans in tumor tissues during epithelial ovarian cancer progression have remained largely undefined. To investigate whether changes in N-glycan patterns correlate with oncogenesis and progression of epithelial ovarian cancer, we profiled N-glycans from formalin-fixed paraffin-embedded tissue slides using matrix-assisted laser desorption/ionization time-of-flight mass spectrometry and quantitatively compared among different pathological grades of epithelial ovarian cancer and healthy controls. Our results show that among the 80 compositions of N-glycan detected, expression levels of high-mannose type were higher in epithelial ovarian cancer samples than that observed in healthy controls, accompanied by reduced levels of hybrid-type glycans. By applying receiver operating characteristic analysis, we show that a combined panel composed of four high-mannose and three fucosylated neutral complex N-glycans allows for good discrimination of epithelial ovarian cancer from healthy controls. Furthermore, using a statistical analysis of variance assay, we found that different N-glycan patterns, including 2 high-mannose-type, 2 fucosylated and sialylated complex structures, and 10 fucosylated neutral complex N-glycans, exhibited specific changes in N-glycan abundance across epithelial ovarian cancer grades. Together, our results provide strong evidence that N-glycomic changes are a strong indicator for epithelial ovarian cancer pathological grades and should provide avenues to identify novel biomarkers for epithelial ovarian cancer diagnosis and monitoring.
Keywords
Introduction
Epithelial ovarian cancer (EOC) is the fifth common cause of cancer death in women worldwide, with the highest mortality rate among all gynecologic malignancies. 1 Due to the relatively asymptomatic nature of early-stage EOC (stages I–II) and the lack of an effective screening strategy, 2 most patients are diagnosed at one of the advanced stages of the disease (stages III–IV), resulting in a lower 5-year survival rate (less than 30%) than that for women diagnosed at an early stage (~90%).3,4 In clinical settings, biopsies are routinely used to determine cancer type and pathological grade based on histologic morphology. The degree of EOC tumor cell differentiation is generally used for grading to predict how quickly the cancer will spread, with the most undifferentiated EOC being the highest grade (grade 3) and most aggressive. 5 Commonly, treatment strategies are determined based on the grading of EOC. In a significant number of cases, however, traditional biopsy results are either inconclusive or do not provide accurate diagnosis of pathological grade, which possibly leading to inefficient or ineffective treatment. Although malignant progression of EOC has been the subject of research for decades, 6 it remains poorly understood due to the complexity of histologic and molecular heterogeneity and the difficulty of modeling it in the laboratory. Together, these challenges necessitate a more comprehensive understanding of the molecular mechanisms of EOC progression, allowing the development of novel and improved therapeutic interventions.
Glycans are considered to be one of the classes of biomolecules following nucleic acids and proteins, for their distinct essences from nucleic acids and proteins in terms of biosynthesis, structure, chemistry, and biological function. In particular, glycosylation is regarded as one of the prevalent post-translational modifications (PTMs) of proteins and plays a crucial role in many biological processes such as cell adhesion, signaling, differentiation, immune responses, and other extracellular interactions.7–9 A considerable amount of research during the past decade on the pathogenesis of EOC suggests that its development and cell differentiation are affected by certain genomic and proteomic factors that induce the spread of tumor cells from primary to distal sites.10–13 However, to date, little information is available regarding the role of glycan modifications in the progression of EOC. It is well documented that various types of cancers are characterized by aberrant glycosylation patterns, and these changes appear to be a general characteristic of malignant transformation.14–16 Therefore, N-glycan profiling potentially provides valuable insights into cancer pathogenesis.
The majority of studies investigating N-glycan changes during EOC development have been performed using serum, plasma, ascites, and cell lines, with significant changes identified as being associated with oncogenesis,17,18 staging,19,20 histological type,21,22 and metastasis. 23 However, the preparation methods used required large samples of fresh or frozen specimen. In recent years, alterations of the molecular composition of tumor tissues are becoming a focus of research, with the understanding that alterations that occur in a solid tumor might be relevant for cancer prognosis and thereby generate new therapeutic targets. However, the alternation of N-glycans in tumor tissues is largely unknown. Formalin-fixed paraffin-embedded (FFPE) slides are a type of widely used clinical tissue specimen that is easily obtained and stored, and several platforms for N-glycan analysis using FFPE slides have been developed with good resolution and reproducibility.24,25 Hence, FFPE slides are ideal to perform large-scale analysis for investigating the changes of tumor tissue–related N-glycans.
Quantitative glycomics based on matrix-based laser desorption/ionization time-of-flight mass spectrometry (MALDI-TOF MS) is a powerful technology for global identification of glycan changes and possesses several advantages over electrospray ionization (ESI) MS, including higher throughput, higher tolerance for contaminants as well as higher sensitivity. Recently, MALDI MS imaging of N-glycans on tissue sections has been developed and used for the characterization of spatial and temporal differences in distribution of N-glycans on tissue slides.26–28 However, native N-glycan classes analyzed by MALDI MS imaging pose several technical challenges due to their relative instability and the ionization bias observed for sialylated glycans. Permethylation is the most commonly used derivatization for MALDI-TOF MS analysis of glycans, 29 as it neutralizes the negative charges on sialylated glycans, thereby protecting this weak terminal glycosidic linkage. In addition, it improves the ionization efficiency of glycans, resulting in higher reproducibility of the assay. Thus, permethylation may be necessary for investigation of N-glycan profiles from slides.
Here, we used a MALDI-TOF MS–based approach to investigate the quantitative profiling of N-glycan from FFPE tissue sections of EOC with different grades and healthy ovary. Several N-glycans were found to be differently expressed between EOC samples and healthy controls, while changes of specific N-glycan patterns correlated well with EOC grades. These results suggested that the information of N-glycan changes would indicate the oncogenesis and progression of EOC.
Materials and methods
Specimens
A total of 100 FFPE tissue sections used in this study were de-identified and acquired commercially from Fanpu Biotech, Inc. and Beijing RaiseDragon’s Co., Ltd. These tissue sections were collected from normal ovary epithelial tissues (n = 30, healthy controls) and EOC tumor tissues (n = 70, EOC samples). All experiments were approved by the Institutional Review Board of Biophysics, Chinese Academy of Science. Clinical information including age at collection, tumor grading characteristic, and histological subtype is shown in Table 1. Differences in age across all categories were found to be not significant at the 0.05 significance level. For each section analyzed, an aliquot of section was collected and stained with hematoxylin and eosin (H&E) for parallel histological analysis. 30
Summary statistics of characteristics of samples used in the study.
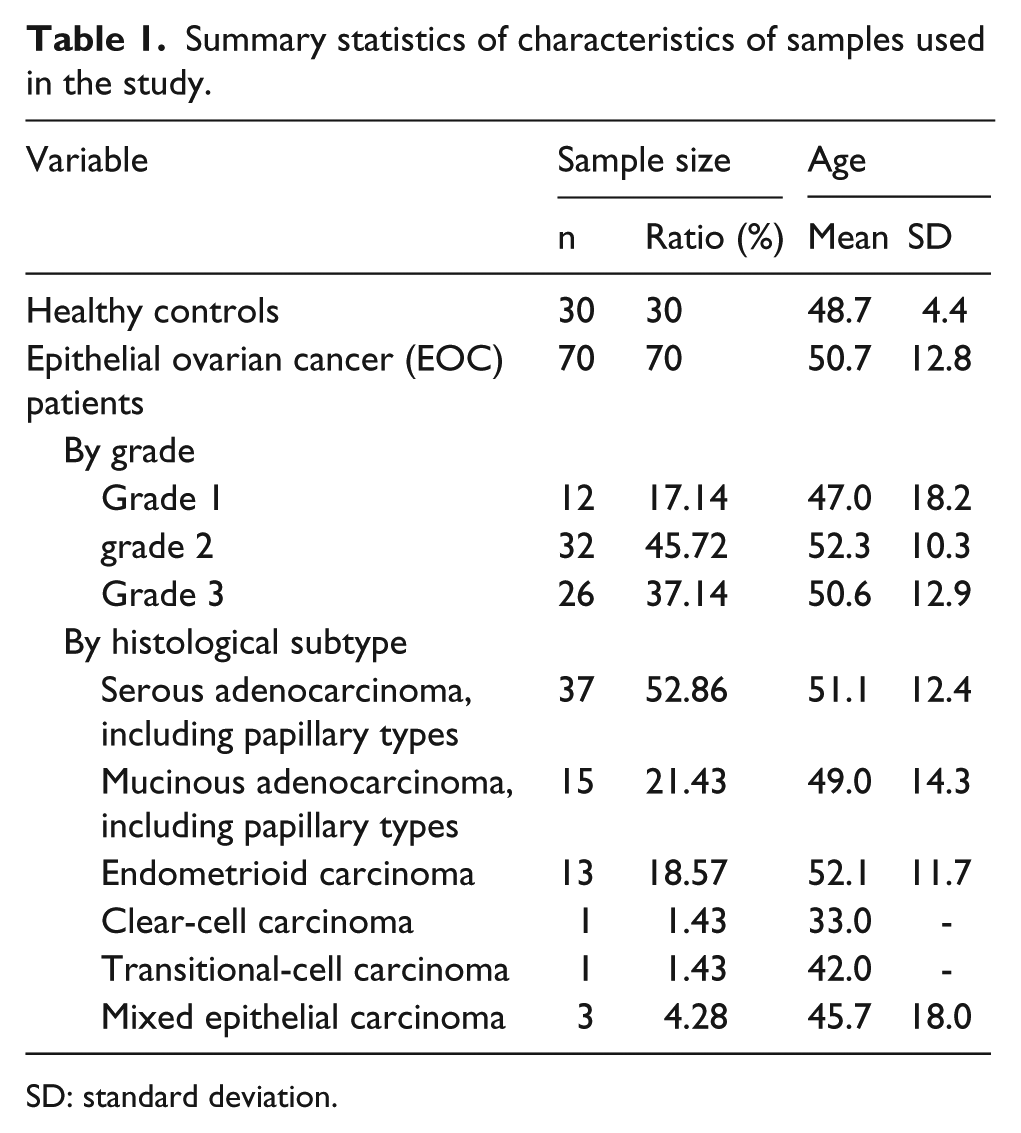
SD: standard deviation.
Deparaffinization and rehydration
Tissue blocks were acquired commercially, sectioned at 5-µm thickness, and mounted on positively charged glass slides. Washes were performed as described previously, 31 with minor modifications. Briefly, to completely remove the embedding paraffin, all sections were deparaffinized by washing twice with xylene for 20 min. The tissue sections were then gently rehydrated by submerging the slides for 3 min in ethanol solutions of 100%, 90%, and 80% (v/v) and finally in water. The resulting tissue sections were allowed to air dry and stored in a desiccator until further analysis.
Protein denaturation of tissue sections
Cell culture silicon slides (8 mm diameter) were pasted on the slides as more tissue slice in the hole as possible to form a reservoir for subsequent operations. To denature proteins on tissue slides, 100 µL of freshly made denaturing buffer containing 40 mM dithiothreitol (DTT), 7 M urea, and 2 M thiourea were added in the hole, and the tissue sections were then placed in a humid environment for incubation for 1 h at 37°C. Pretreatment of the tissue with denaturing reagents greatly improved deglycosylation. Next, the denaturing buffer was removed and the tissue sections were then washed seven times using 50-mM ammonium bicarbonate (NH4HCO3) buffer. The washing process was performed to ensure thorough removal of the denaturing buffer and equilibrate the pH of the section to close the optimal pH for deglycosylation by N-glycosidase F (PNGase F) before applying this enzyme.
On-tissue PNGase F digestion and N-glycans enrichment
A 2.5-µL aliquot of glycerol-free PNGase F (New England Biolabs, Ipswich, MA, USA) in a total reaction volume of 82 µL with 50 mM NH4HCO3 was spotted onto tissue slides. Tissues were digested overnight at 37°C in a humidified box to prevent evaporation of the digestion solution from tissue surfaces. Subsequently, the buffer was collected and then dried under vacuum by centrifugation. Afterward, the samples were dissolved in 200 µL 5% (v/v) aqueous acetic acid solution.
The enrichment of the released N-glycans was performed using Sep-Pak C18 96-well plate (Waters, Milford, MA, USA) coupled with a vacuum pump. Before loading, the wells were washed with 1 mL of 5% (v/v) aqueous acetic acid solution, followed by conditioning with 1 mL of 1-propanol and equilibrating with 2 mL of 5% (v/v) aqueous acetic acid solution. The samples in 200 µL 5% acetic acid solution were applied to the wells twice and then eluted into the collection plate with 2 mL of 5% (v/v) aqueous acetic acid solution. Each of the collected eluents was transferred into an Eppendorf Tube and then dried in a centrifugal vacuum concentrator.
N-glycans permethylation and purification
Freeze-dried N-glycans released from tissue sections were permethylated in an Eppendorf Tube, as previously described. 29 Briefly, a slurry mixture of dimethyl sulfoxide/sodium hydroxide (DMSO/NaOH) was freshly prepared and added to the dried samples (300 µL), together with 200 µL of anhydrous DMSO and 200 µL of iodomethane. The reaction slurry was mixed thoroughly for about 30 min at room temperature. The permethylation reaction was quenched by adding 2 mL of water. Subsequently, the permethylated N-glycans were extracted with chloroform (4 × 200 µL) and then washed four times with 400 µL of water. The chloroform phases containing permethylated N-glycans were finally dried under a gentle stream of nitrogen.
The dried samples were resuspended in 200 µL of 50% (v/v) methanol aqueous solution and further purified over Sep-Pak C18 96-well plate. Before loading the sample, the wells were conditioned by eluting successively with methanol (1 mL), water (1 mL), acetonitrile (ACN, 1 mL), and water (2 mL). Then, the sample solutions was loaded repeatedly twice onto the wells and washed sequentially with 1 mL of water and 1 mL of 15% ACN/water (v/v). The eluent with 1.3 mL of 75% (v/v) ACN/water was collected and evaporated under a stream of nitrogen until dry.
MALDI-TOF MS analysis
Samples of permethylated N-glycans were resuspended in 20 µL of 50% (v/v) methanol/water, before 2 µL of each sample solution was spotted on a stainless-steel µFocus MALDI target plate (HST, Old Tappan, NJ, USA). After drying under ambient conditions, 2 µL of 10-mg/mL 2,5-dihydroxybenzoic acid (DHB) in 50% ACN/water containing 0.1% trifluoroacetic acid (TFA) was added onto the sample layer and loaded into an AXIMA Resonance matrix-assisted laser desorption/ionization quadrupole ion trap time-of-flight (MALDI-QIT-TOF) mass spectrometer (Shimadzu Biotech, Kyoto, Japan) and then air-dried. Each sample was spotted in triplicate.
Prior to MALDI MS analysis, the instrument was externally calibrated by ProteoMass™ Peptide MALDI-MS Calibration Kit (Sigma-Aldrich, St. Louis, MO, USA) containing six peptides’ calibration standard. All samples were analyzed at a 20-kV accelerating voltage in positive-ion reflectron mode, with an m/z range of 900–4000 Da. Collision-induced dissociation (CID) was performed at a collision energy of 4 kV using argon as the collision gas. The laser power varied in the range of 90 to 100. Two laser shots were pulsed on a position to generate a profile, and 600 profiles were accumulated from different points of laser irradiation into one file for each sample spot. Each sample was spotted in triplicate to control the reproducibility of the data, and average areas were used for the statistical analysis.
Data processing and statistical analysis
MALDI MS and MSn data were acquired and processed using the Launchpad software (Shimadzu Biotech). All proposed structures of identified glycans or fragments were interpreted manually based on their m/z values according to GlycoWorkbench (version 2.0) 32 and previously published literatures,28,33 as well as Glycan Mass Spectral Database. 34 The m/z values and intensities in MS were exported as ASCII files, and all the raw data were then imported into the MarkerView Software (version 1.2.1), with the parameters of spectra process as follows: mass tolerance: 200 ppm, minimum required response: 1000, and maximum number of peaks: 4000. Subsequently, all the N-glycan peaks, including monoisotopic and isotope ones, were selected and normalized using total area sums.
GraphPad Prism (version 5) and IBM SPSS Statistics (version 22) were used for statistical analysis. Error bars were expressed as the standard error of the mean (SEM) unless otherwise noted. Student’s t test was used to determine the significance of differences between two groups, while one-way analysis of variance (ANOVA) test was used for multiple groups. Both tests were considered to be statistically significant when the p value was less than 0.05.
Results
Release and detection of N-glycans
FFPE tissue sections are widely used in clinical research as they can be easily obtained, stored, and transported. Furthermore, this type of sections provides genetic, proteomic as well as glycomic information of patients. In this study, N-glycan profiling of FFPE slides was investigated using MALDI-QIT-TOF MS. Briefly, the tissue sections were deparaffinized and rehydrated, and the proteins on tissues were denatured, before release of the N-glycans using PNGase F. After purification, the N-glycans were permethylated and analyzed using MALDI-QIT-TOF MS and tandem MS (Figure 1). Each sample was spotted onto MALDI plate in triplicates, with average areas used for statistical analysis.

Experimental workflow of this study. After the tissue sections were deparaffinized and rehydrated, tissue proteins were denatured before release of N-glycans by PNGase F. After purification, the N-glycans were permethylated and analyzed using MALDI-QIT-TOF MS and tandem MS.
Representative MALDI-TOF MS profiles of N-glycans from healthy controls and EOC samples are shown in Figure 2. A total of 80 N-glycan compositions were detected as [M + Na]+ in the mass range of 900–4000 Da, as listed in Supporting Information Table S1. The monosaccharide composition of each N-glycan, including hexose (Hex, H), N-acetylhexosamine (HexNAc, N), fucose (Fuc, F), N-acetylneuraminic acid (NeuAc, S), and N-glycolylneuraminic acid (NeuGc, G), was deduced based on the measured mass using GlycoWorkbench. Based on components of N-glycans, fucosylation and sialylation were detected in 56 and 28 N-glycans in this study, respectively. These results illustrated that N-glycans were effectively released from FFPE slides, to be detected by MALDI-TOF MS using the method described above.
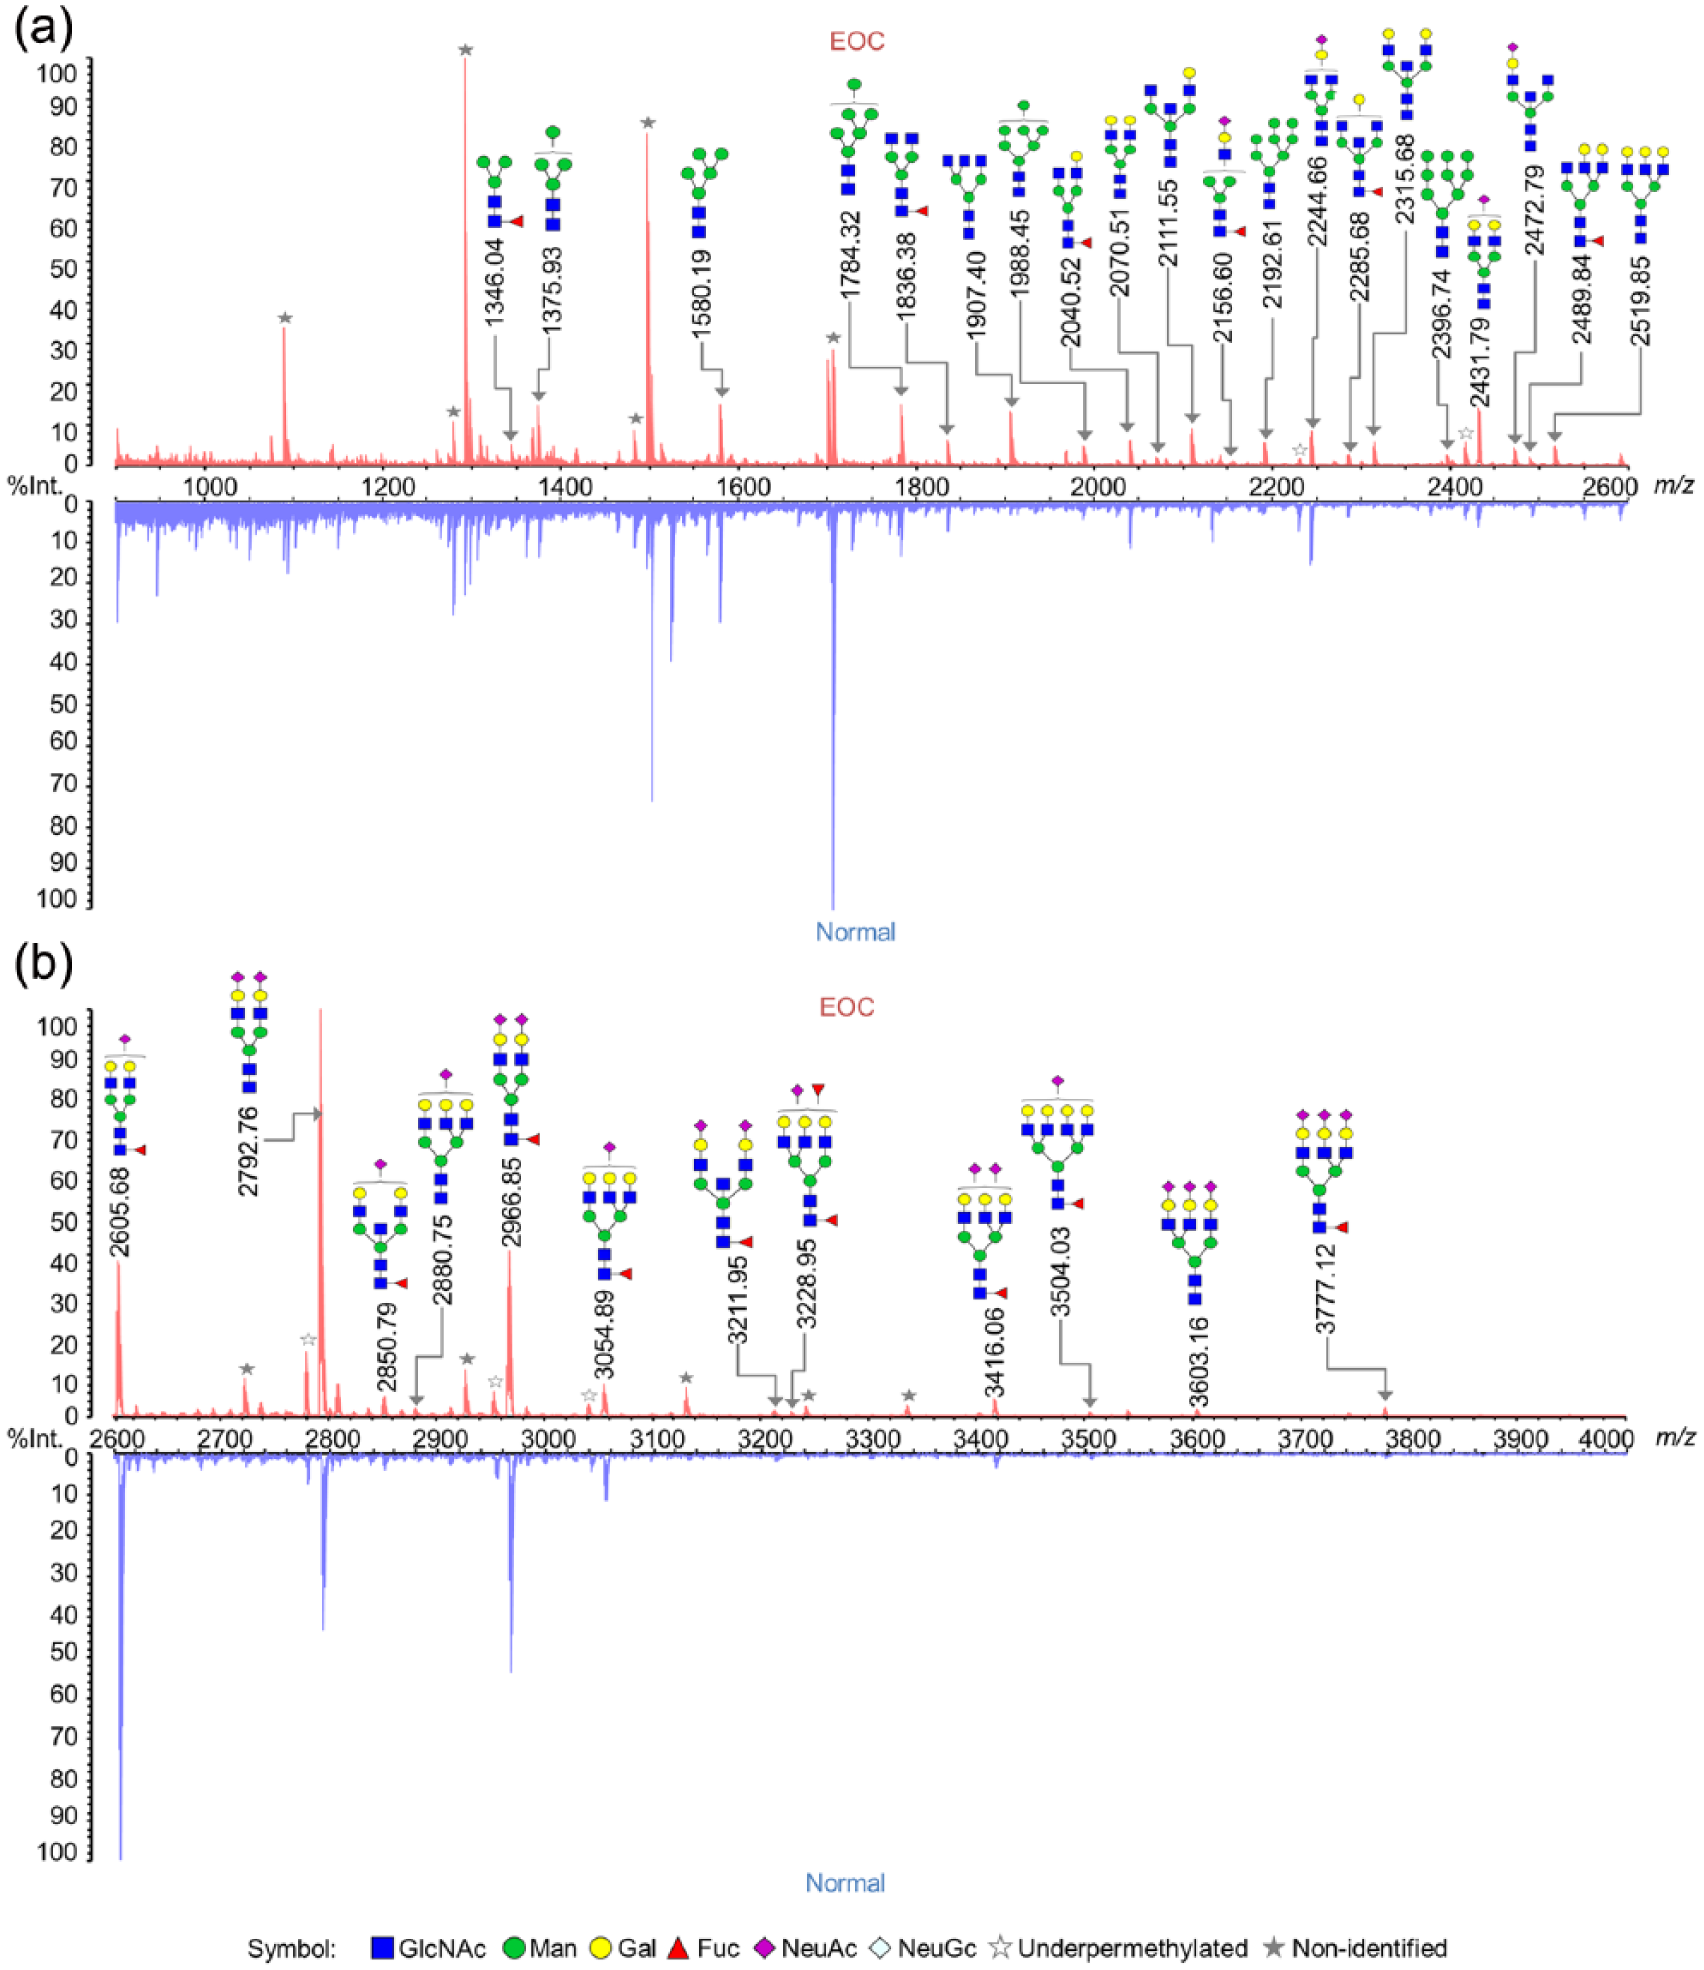
MALDI-TOF MS representative profiles of permethylated N-glycans from an EOC sample (red) and a healthy control (blue) taken in positive ion mode. The scan range was (a) 900–2600 Da and (b) 2600–4000 Da. Only the abundant N-glycans were annotated. All the molecular ions are present in single charged sodium adduct form ([M+Na]+).
Structural analysis of N-glycans
To confirm the structural assignment of detected N-glycans, we analyzed the permethylated N-glycans from EOC samples by performing MALDI-QIT-TOF MS3 under positive CID condition. The structures were inferred manually by interpreting the MS2 and MS3 fragments, as well as based on biological pathway constraints and glycosylation patterns. 35 The MALDI-QIT-TOF MS3 spectra of one N-glycan at m/z 2081.22 with a composition of F1H3N5 are shown in Figure 3. Specifically, an MS2 spectrum was generated using the [M+Na]+ peak, m/z 2081.22 as precursor ion, and product ions were presented as a list of peaks (Figure 3(a)). Among these MS2 peaks, m/z 866.32, 1370.65, and 662.19 were used as precursor to perform next-stage product-ion scanning (Figure 3(b)–(d)). Many of the observed individual signals may represent a mixture of two or more isomeric structures, induced by site and/or linkage or, even in some case, an anomer. For example, the N-glycan F1H5N4 at m/z 2244.7 may represent a digalactosylated biantennary structure with either core or outer-arm fucosylation; however, this type of positional isomer will not alter the overall level of branching. However, some isomers may result from the different locations of a GlcNAc residue, namely, either located on the branched mannose of the core or linked to the core mannose to yield the so-called “bisecting” structures. This positional isomerism of GlcNAc residue, such as the N-glycan H5N5 at m/z 2315.7 as an example, results in a tri-antennary structure or a bisected bi-antennary structure. The putative structures of identified N-glycans are summarized in Supporting Information Table S1. Most of the detected N-glycans are complex structures containing one to four branches, with or without bisecting GlcNAc glycoform (67 of the 80 N-glycans). The remaining 13 N-glycans were shown to be composed of 5 high-mannose structural types, 5 hybrid structural types, and 3 degradation products (DP) that most likely originated from lysosomal digestion.36,37
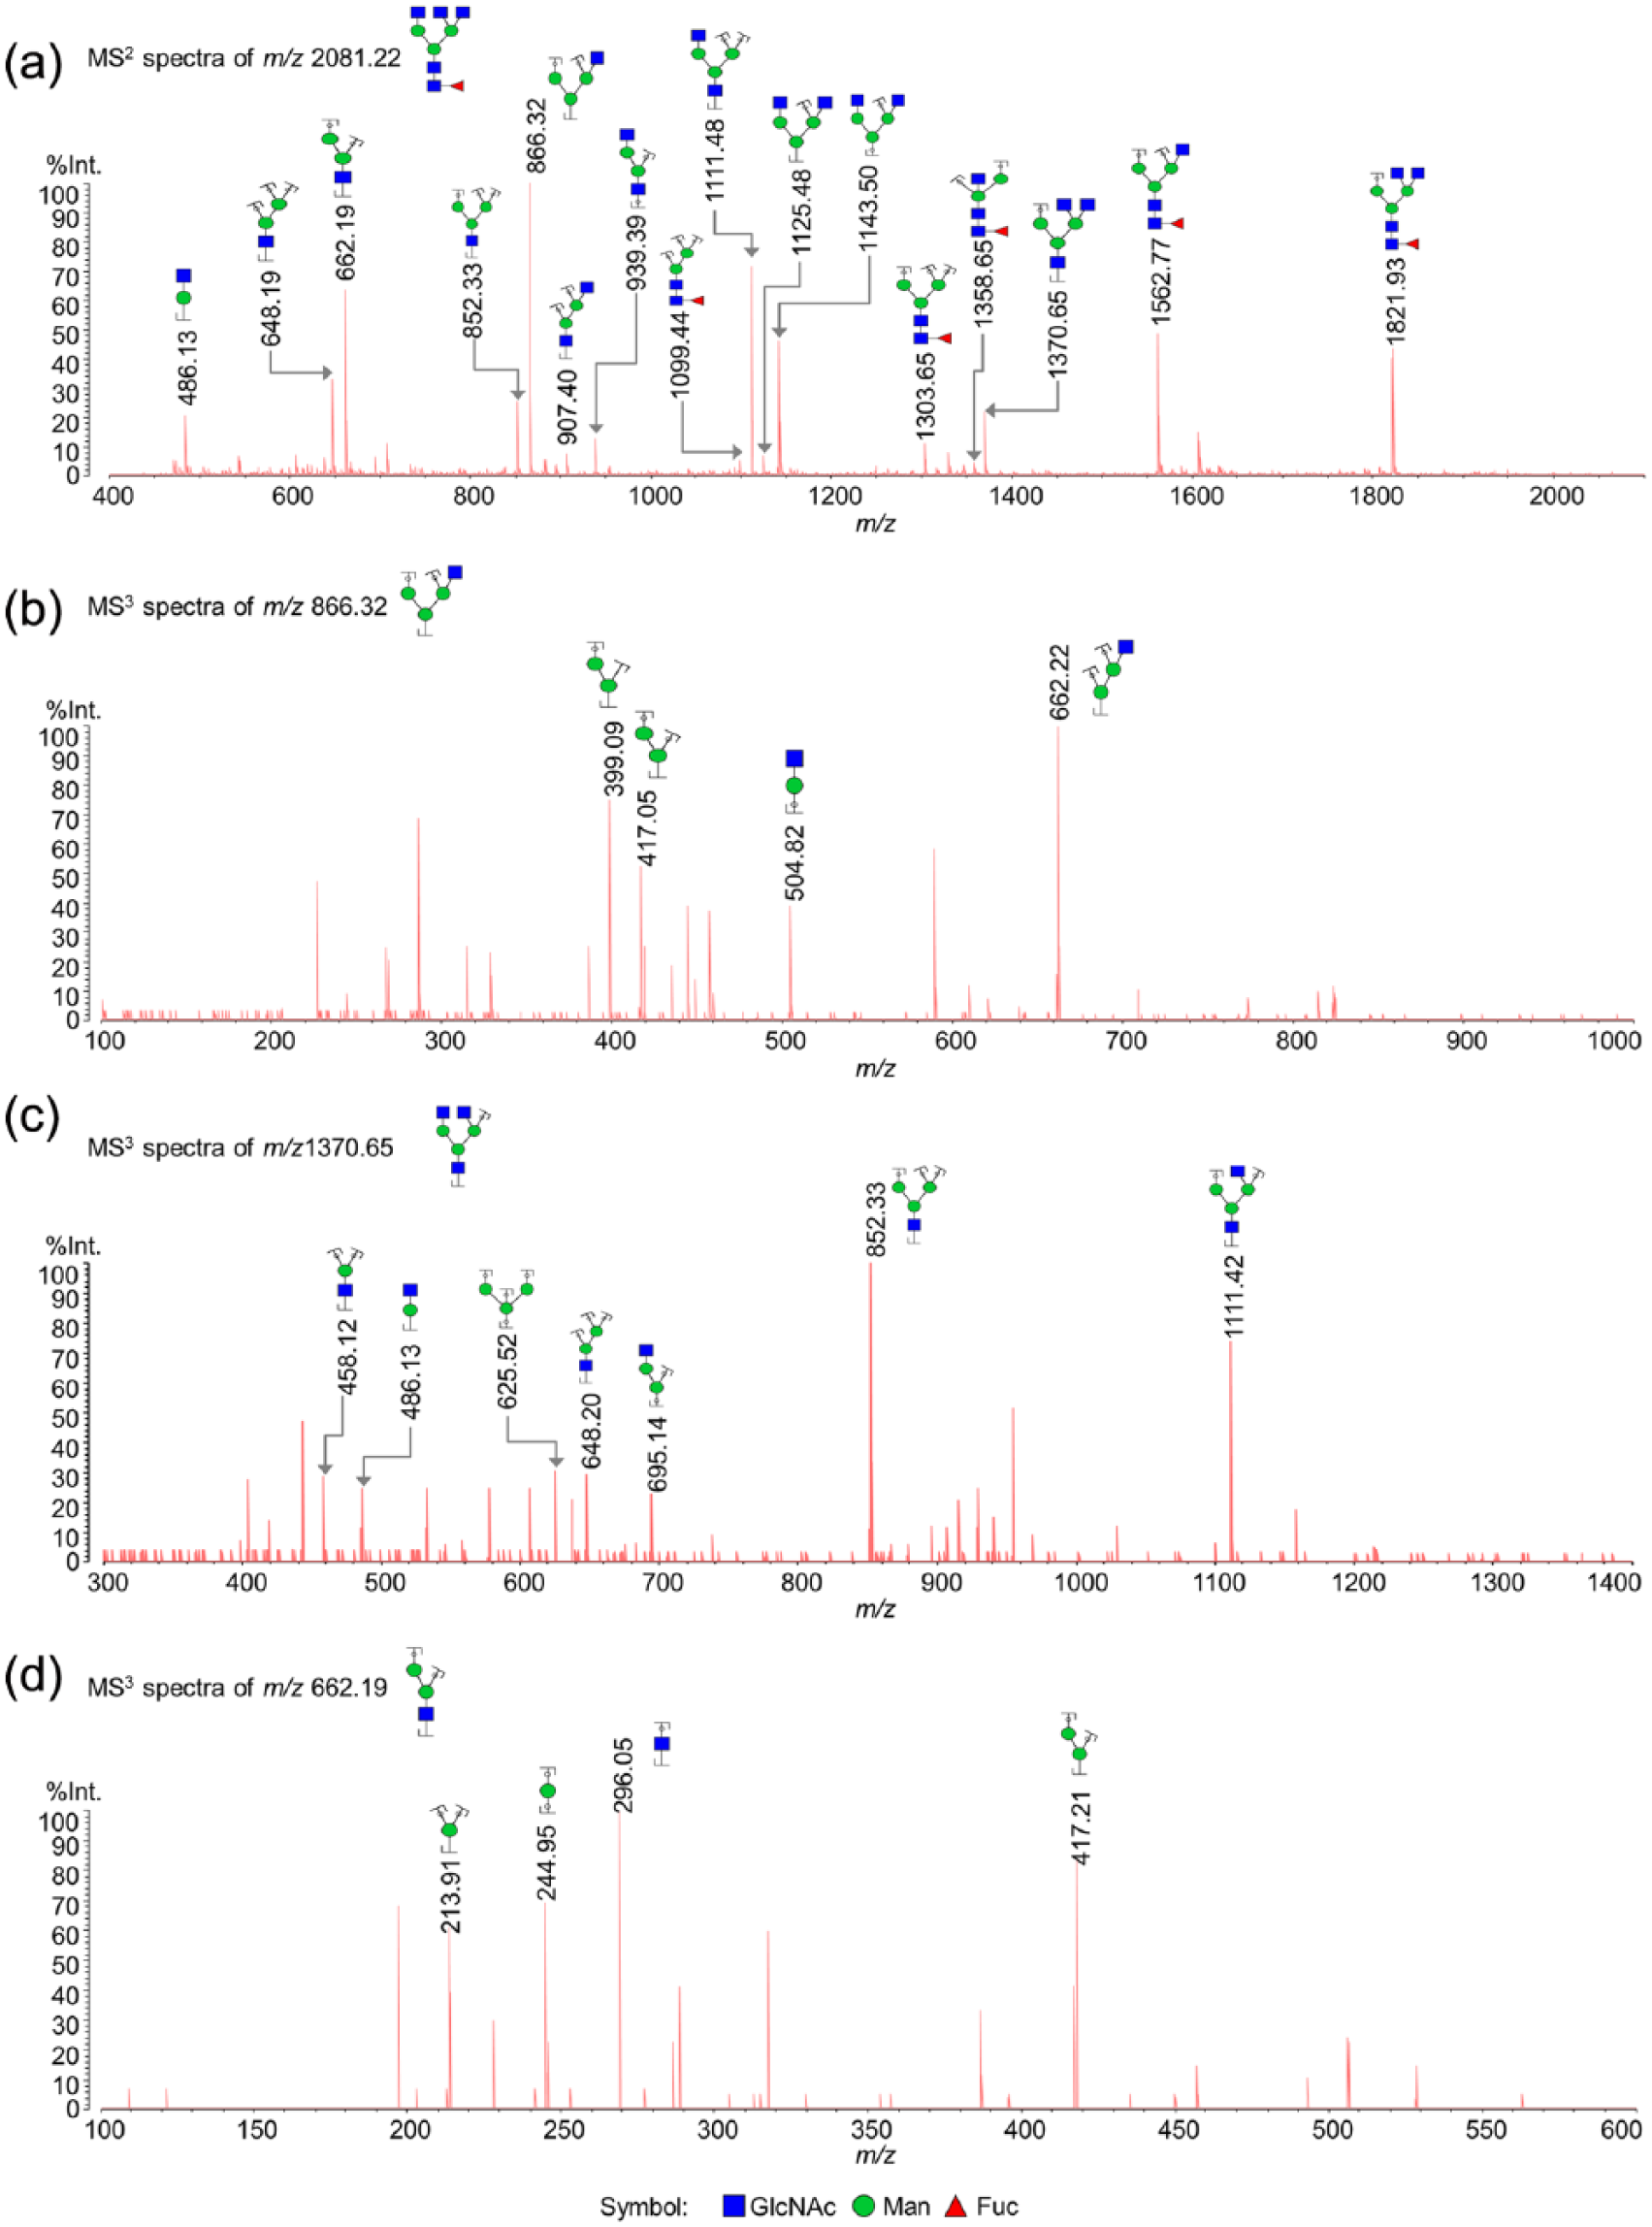
Representative MALDI-QIT-TOF MS3 fragment ion spectra of the [M+Na]+ precursor ions of permethylated N-glycan F1H3N5 at m/z 2244.18. MS3 spectra generated from the fragment ions at (b) m/z 866.32, (c) 1370.65, and (d) 662.19 in MS2 spectrum of (a) m/z 2081.22 were displayed. The fragments were assigned using GlycoWorkbench and labeled. Registered fragments may be formed by different fragmentation pathways, only one of which was depicted in the figure.
Comparative analysis of N-glycans from healthy ovary and EOC tissues
To investigate whether or not the abundance of each N-glycan differed significantly between the EOC samples and healthy controls, we imported MS data of each sample into MarkerView 1.2.1 and defined and normalized the peak area as response value using total peak area sums. Statistically significant MS peaks between the EOC samples (n = 70) and the healthy controls (n = 30) were evaluated using Student’s t test. Among the detected 80 N-glycans, 29 N-glycans were differentially expressed between EOC samples and healthy controls, including 11 upregulated N-glycans (Figure 4(a)) and 18 downregulated N-glycans (Figure 4(b)) in EOC cases relative to controls of healthy tissue. The detailed change ratios of N-glycans, calculated by dividing the average value of corresponding monoisotopic peaks from tumor tissues by those from healthy ovary tissues after normalization using total peak area sums, are listed in Supporting Information Table S1. In all, 4 out of 5 high-mannose glycans (m/z 1784.3, 1988.5, 2192.6, and 2396.7 for the H6N2-H9N2, respectively, as shown in Figure 4(a)) were increased in the EOC samples compared to the healthy controls. Interestingly, the change ratios were rising progressively with mannose residue increasing, ranging from 1.60 to 2.41. The high-mannose N-glycan at m/z 1580.2 (H5N2) performed the same trend, although the p value was greater than 0.05 (data not shown). The adverse trend was observed in the hybrid N-glycans, three-fifths of which were significantly decreased in EOC samples, as shown in Figure 4(b). Relative quantities of the other two hybrid structures also reduced gently in EOC samples with the p value greater than 0.05 (data not shown). In addition, just over half of the complex mono- and bi-antennary structures (10 out of 19) were decreased in the EOC samples. Fucosylation and/or sialylation was identified in the compositions of 7 out of these 10 N-glycans, suggesting that such terminal modifications are involved in regulating the physiological and pathological processes of EOC.

N-glycans that differentially expressed between EOC samples and healthy controls and their abilities in differentiating EOC patients from healthy individuals using ROC analysis. There were (a) 11 upregulated N-glycans and (b) 18 downregulated N-glycans in EOC samples when compared to healthy controls. The N-glycan compositions were assigned based on observed [M+Na]+ and their abundance was calculated after normalizing using the total peak area sums. The levels of significance were as follows: *p < 0.05; **p < 0.01; ***p < 0.001. (c) The resulting AUC values of upregulated (red) and downregulated (blue) N-glycans compared EOC samples vs healthy controls with the error bar expressed as standard deviation (SD). (d) The combined ROC curve for the optimized seven-glycan composite score based on their relative abundance in EOC samples vs healthy controls, including H6N2, H7N2, H8N2,H9N2, F1H5N4, F1H4N5, and F1H3N6.
In order to evaluate the diagnostic potential of the individual N-glycans for differentiating EOC samples from healthy controls, receiver operating characteristic (ROC) curves for these 29 N-glycans with statistical significance between the two sets were constructed. The resulting areas under the curve (AUCs) values are shown in Figure 4(c). The AUC scores ranged from 0.603 to 0.854 of the 11 increased N-glycans and from 0.146 to 0.394 of the 18 decreased N-glycans when comparing EOC samples vs healthy controls. As shown in Figure 4(c), five of the decreased N-glycans which represented complex mono- and bi-antennary structures showed moderately accurate diagnosis capability (resulting in AUC values that are less than 0.3). Their calculated compositions are H4N3, S1H4N3, F1H4N4, F2H4N4, and S1F1H5N4. Furthermore, four of the increased and three of the decreased N-glycans showed accurate results (AUC value greater than 0.8 or less than 0.2). All four increased N-glycans were found to be high-mannose structures (H6N2, H7N2, H8N2, and H9N2), while the three decreased N-glycans were identified as neutral, complex structures with one fucose residue (F1H5N4, F1H4N5, and F1H3N6). To assess the complementary performance of these seven N-glycans in differentiating EOC samples and healthy controls, we performed an ROC analysis of the combined panel using binary logistic regression rule. This analysis yielded an AUC value of 0.973, with a sensitivity and specificity of 97.1% and 86.7%, respectively (Figure 4(d)). Together, these results indicated that profiling of N-glycans from FFPE slides is a powerful tool to distinguish EOC tissues from healthy tissues.
The association of N-glycan changes and EOC grades
To evaluate whether the abundance of N-glycans was significantly different among three EOC grades, we performed ANOVA analysis using the normalized response values of each N-glycans from different EOC grades. As shown in Figure 5, 14 out of the 80 detected N-glycans showed significant difference in abundance among these three EOC grades.
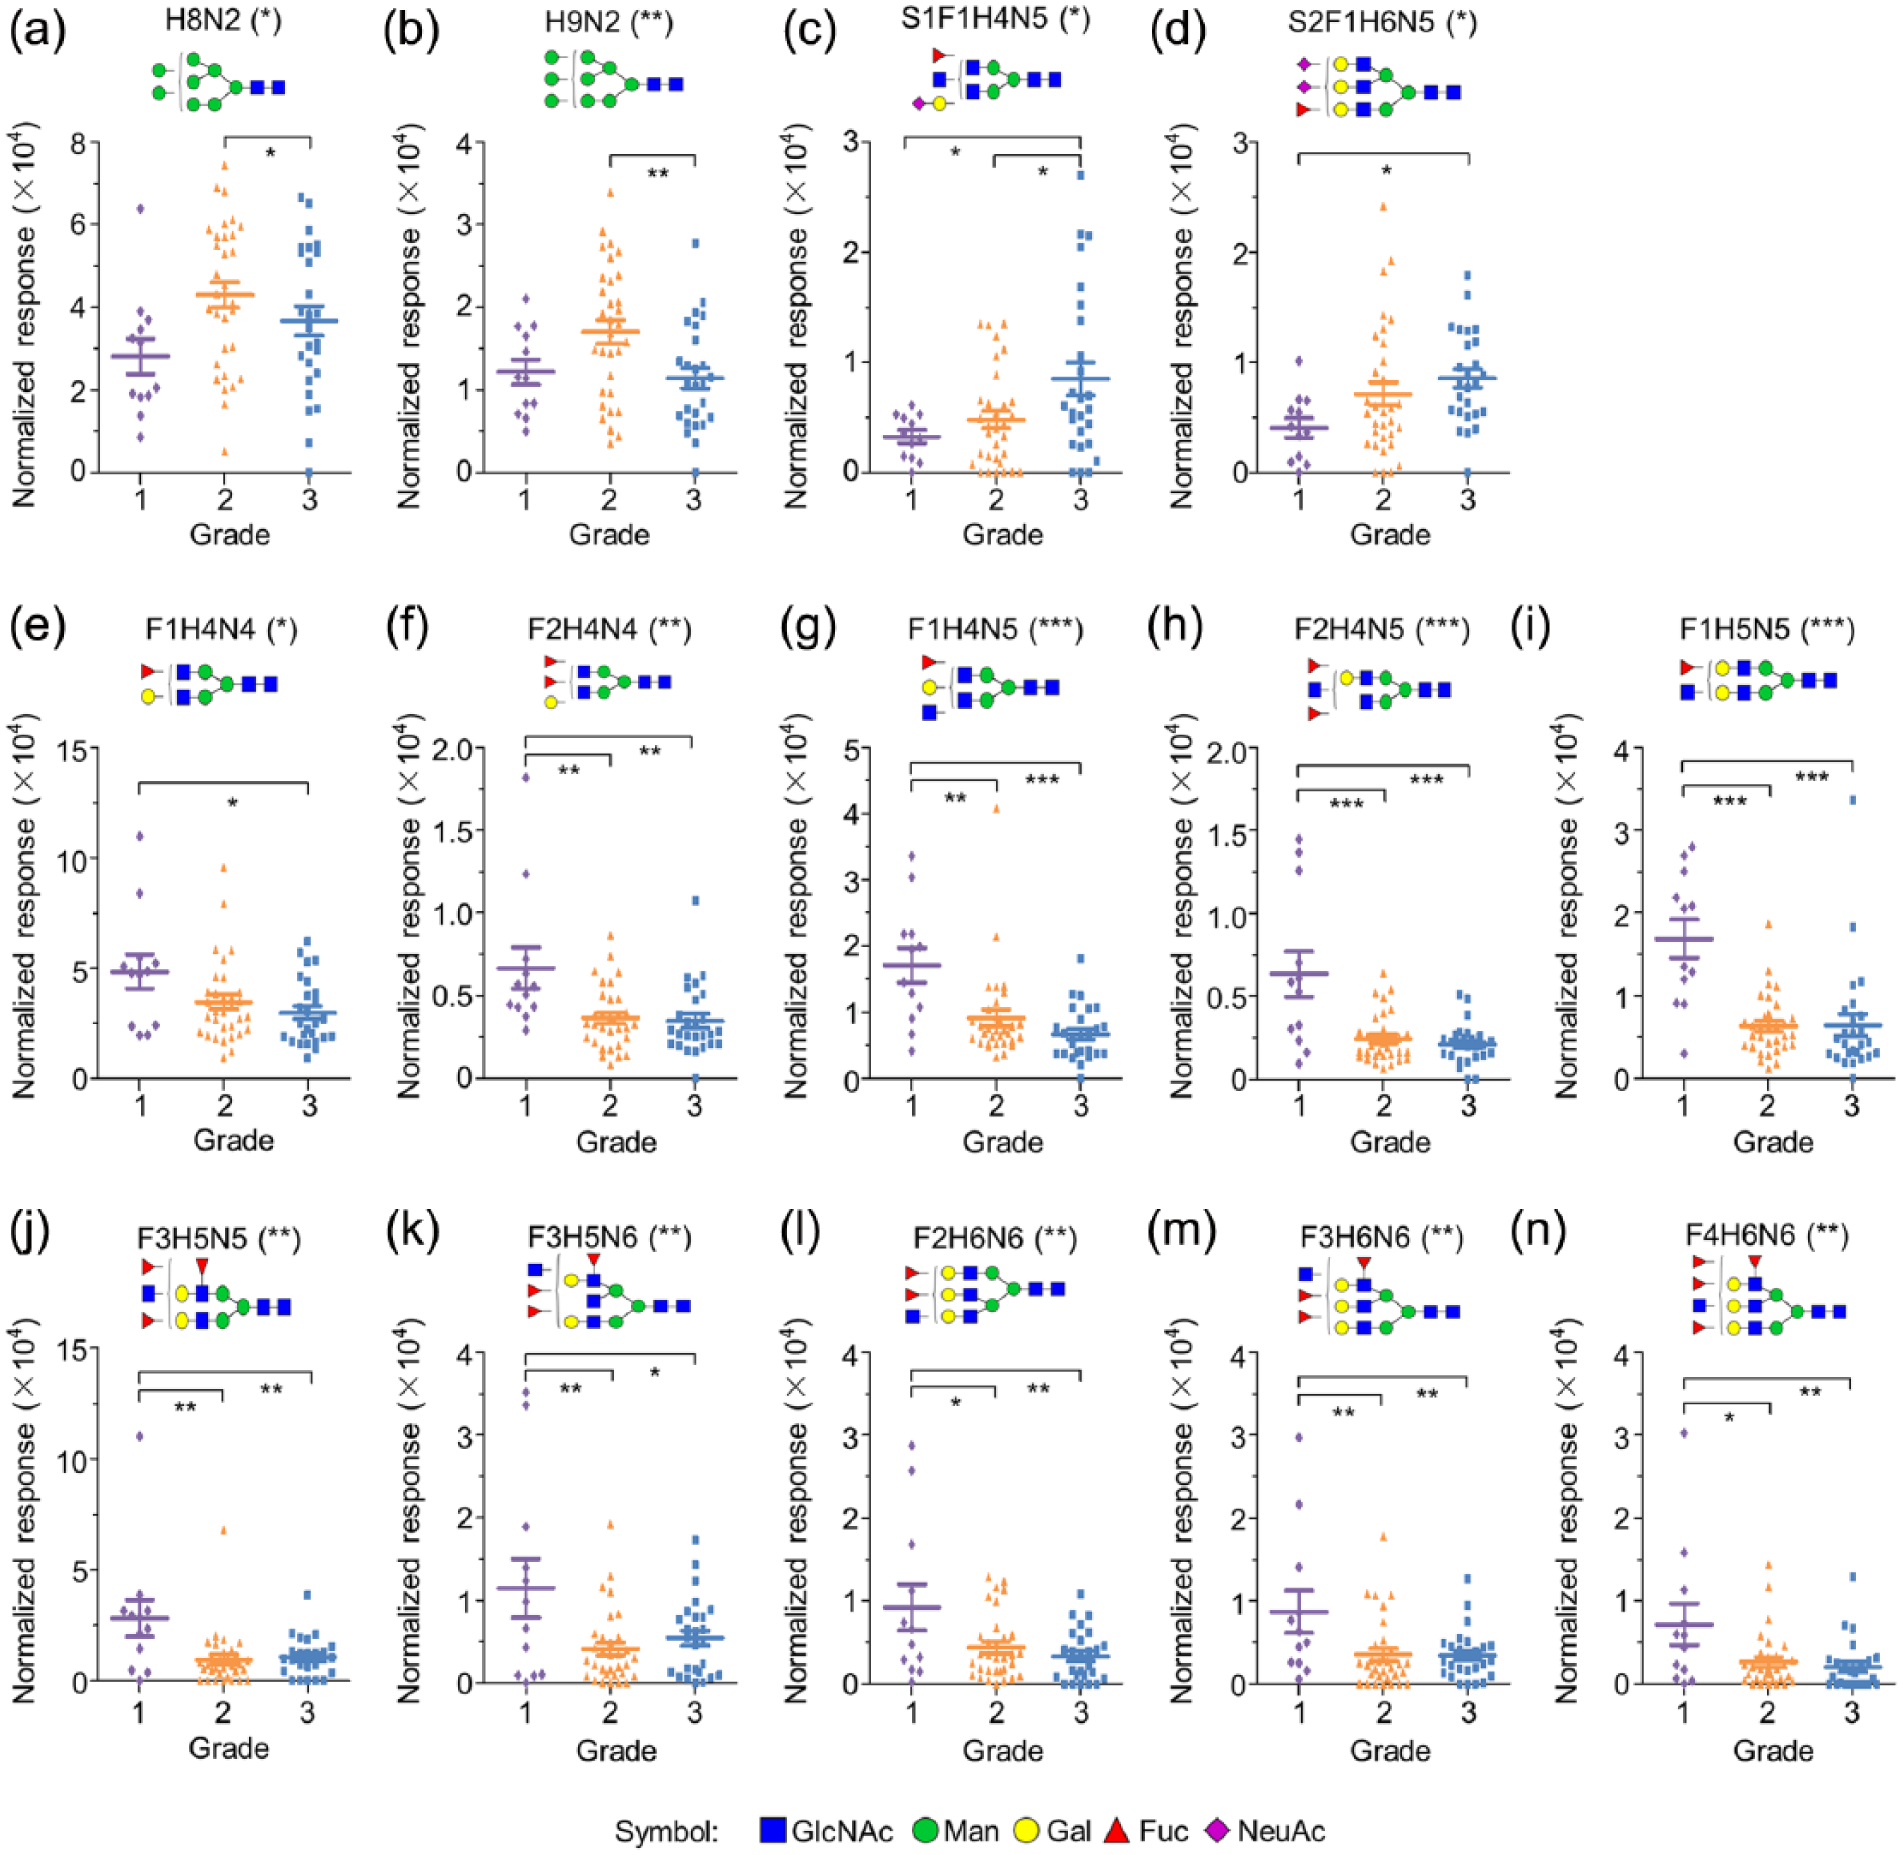
N-glycans exhibiting statistical differences among different EOC grades. (a) H8N2, (b) H9N2, (c) S1F1H4N5, (d) S2F1H6N5, (e) F1H4N4, (f) F2H4N4, (g) F1H4N5, (h) F2H4N5, (i) F1H5N5, (j) F3H5N5, (k) F3H5N6, (l) F2H6N6, (m) F3H6N6, and (n) F4H6N6.
The 14 N-glycans include 2 high-mannose structures, 2 fucosylated acidic complex N-glycans, and the remaining 10 N-glycans were all neutral complex structures with one or more fucose residues. Relative abundance of the two high-mannose glycans presented a similar change trend of abundance, that is, rising first and then reducing along with the EOC grades elevating (Figure 5(a) and (b)). In addition, with the EOC grades increasing, relative abundance of the two fucosylated acidic complex N-glycans increased gradually (Figure 5(c) and (d)). Moreover, the remaining 10 fucosylated neutral complex N-glycans were found to be highly expressed in the grade 1 group relative to both grades 2 and 3 (Figure 5(e)–(n)). Together, our results provide strong evidence that the abundance changes of specific N-glycan patterns correlate well with the differentiation of EOC tumor cells, indicating that modifications in N-glycan patterns are either part of the driving force for oncogenesis or at least a result of, with possible consequences for further tumor progression of EOC.
Discussion
An increasing body of evidence suggests that N-glycans play important roles in cancer initiation and progression. 38 Determining N-glycan patterns on tumor cells may therefore become essential for early, specific, and reliable cancer detection, diagnosis, and classification. In this study, we employed a MALDI-QIT-TOF MS–based approach to investigate the profiling of N-glycans from FFPE tissue sections of EOC patients and healthy individuals. Our results show that 29 N-glycans were differentially expressed in tissues from EOC patients relative to samples from healthy individuals. In addition, changes in abundance of 14 N-glycans were found to be directly related to the progress of EOC tumor cell differentiation. Together, our findings shed light on the molecular mechanisms by which altered N-glycans support progression of EOC.
In our study, we analyzed the N-glycans on the FFPE ovarian tissue sections of 30 healthy individuals and 70 EOC patients using MALDI-TOF MS and detected 80 N-glycan compositions. Moreover, the structures of detected N-glycans were determined using MALDI-QIT-TOF MS3. Each glycan composition may potentially be subdivided into several isomers because of different sites or linkages of residues. The number of detected N-glycans in our study is higher than that previously reported by other researchers.39,40 This may be due to permethylation of glycans prior to MALDI-TOF MS analysis in our procedure, which can stabilize sialylated N-glycans and increase their MS signals. 29
Elevation of high-mannose glycans was previously observed in various types of cancer using mass spectrometry or lectin microarray.41–43 Here, we found that the abundance of detected high-mannose glycans were significantly higher in EOC tissues than healthy ovarian tissues, except H5N2. These results are in agreement with previous observations in ovarian cancer tissues. 28 Another report showed that the abundance of high-mannose glycans significantly increased on the membrane proteins isolated from EOC cell lines compared to those found on non-cancerous cell lines. 44 It is well known that H9N2 is biosynthesized first in endoplasmic reticulum (ER) and then sequentially trimmed to H5N2 by mannosidases in ER and cis-Golgi or extended by glycosyltransferases to form hybrid and later complex-type glycans in medial- and trans-Golgi. 45 Therefore, the high abundance of high-mannose N-glycans in EOC tumor tissues may be caused by incomplete glycosylation, a phenomenon that also been observed in breast cancer progression. 46 In addition, high-mannose glycans play a pivotal role in protein folding 47 and protecting proteins against degradation during intracellular transport. 48 It is likely that upregulation of high-mannose glycans alters the stability of proteins and their properties of adhesion and communication, thereby aiding the genesis and growth of EOC tumor cells.
On the other hand, hybrid- and complex-type N-glycans are the mature N-glycan forms that are produced by types of mannosidases and glycosyltransferases. 49 Several glycosyltransferases involving in N-glycan synthesis have been proved to be differentially expressed in EOC cell line and then consequently change specific glycosylation of proteins.23,44 In our study, we found that the abundance of hybrid N-glycans in EOC tissues decreased relative to healthy controls, a finding consistent with earlier reports.17,40 Complex-type N-glycans lacked any identical rule of alterations when comparing EOC cases with healthy controls. F1H4N4 and F1H4N5 were previously been shown to be downregulated in plasma from patients with EOC and benign tumor when compared to healthy controls. 50 As proteins present in the plasma originate from many different cells, tissues, and organs, glycomic information of circulating proteins may reflect the immune response to the tumor, rather than the change of glycans in the tumor tissue itself. This may explain why N-glycan patterns of proteins found in plasma samples differed vastly to those found in tumor samples taken from EOC patients. When testing the diagnostic abilities of all significantly changed N-glycans using ROC analysis, the AUC values indicated that four high-mannose-type N-glycans (H6N2, H7N2, H8N2, and H9N2) and three fucosylated neutral complex N-glycans (F1H5N4, F1H4N5, and F1H3N6) possessed accurate diagnostic value for discriminating EOC samples to healthy controls. Furthermore, combined application of these seven compositions yielded a better classification for EOC samples and healthy controls. These results suggest that the information gathered from N-glycans would have a prospect for EOC diagnosis.
EOC is classified into three grades based on its histologic morphology, which describes the degree of cell differentiation and predicts how quickly the cancer will spread. In our study, 14 differentially expressed N-glycans were found to be associated with EOC grades. In particular, N-glycans with similar structural or compositional features showed similar trends of changes ranging from grade 1 to grade 3. Previous studies have shown that high level of high-mannose-type N-glycans and low level of sialylation of N-glycans correlate well with strength of cell–cell adhesion and migratory rate.51,52 These observations may provide an explanation for the higher abundance of high-mannose-type N-glycans (H9N2, H8N2) and the lower abundance of sialylated-type N-glycans (S1F1H4N5, S2F1H6N5) in both grades 1 and 2 vs grade 3. Moreover, mouse and human embryonic stem cells display higher levels of high-mannose glycans on glycoproteins53,54, suggesting that high-mannose structures may be present on the cancer stem cell population and undergo remodeling during stem cell differentiation of EOC. In addition, decreased core fucosylation of N-glycans was shown earlier to contribute to the malignancy of cancer cell. 55 Here, we also observed an inverse relationship between the abundance of 10 fucosylated neutral complex N-glycans and EOC grades. This negative correlation implies that this type of N-glycans may accelerate the progress of cell differentiation and/or inhibit the ability of EOC tumor cells to migrate, metastasize, and invade other tissues.
However, the detailed molecular mechanisms behind these changes in patterns of specific N-glycan modifications await elucidation, together with their functional importance in EOC oncogenesis and progression. Further data compiled on relevant glycosidases and glycosyltransferases from DNA microarrays and extensive glycoproteomic investigations will facilitate better understanding of the functional significance of N-glycan variations in the progression of EOC.
In conclusion, our results provide strong evidence that specific N-glycans are differentially expressed throughout EOC progression, with changes correlating with the degree of EOC tumor cell differentiation. The ability to effectively profile N-glycans on FFPE tissue sections presented here should provide a convenient alternative for hospitals to evaluate N-glycan changes associated with cancer status. Moreover, this pilot study will assist in better understanding of the molecular nature of EOC oncogenesis and progression from the perspective of glycomics, thereby providing a foundation for further studies to identify novel biomarkers for EOC diagnosis and monitoring, as well as potential targets for EOC treatment.
Footnotes
Acknowledgements
H.C. and Z.D. contributed equally to this article. The authors are very grateful to Torsten Juelich in Peking University for assistance in professional writing and editing. H.C. and Z.D. performed the experiments, wrote the manuscript, and analyzed the data. C.H. and H.W. have contributed to experimental work. X.Z. and Y.L. designed and conducted the experiments and revised the manuscript. All authors read and approved the final manuscript.
Declaration of conflicting interests
The author(s) declared no potential conflicts of interest with respect to the research, authorship, and/or publication of this article.
Ethical approval
This study was approved by the Institutional Review Board of Biophysics, Chinese Academy of Science.
Funding
The author(s) disclosed receipt of the following financial support for the research, authorship, and/or publication of this article: This work was supported by Major State Basic Research Development Program of China (973 Program, no. 2013CB910100), NSFC-Shandong Joint Fund (no. U1406403), and Major Science and Technology Projects of Shandong Province (no. 2015ZDJS04002).
References
Supplementary Material
Please find the following supplemental material available below.
For Open Access articles published under a Creative Commons License, all supplemental material carries the same license as the article it is associated with.
For non-Open Access articles published, all supplemental material carries a non-exclusive license, and permission requests for re-use of supplemental material or any part of supplemental material shall be sent directly to the copyright owner as specified in the copyright notice associated with the article.