
Abstract
As a crucial member of the small ubiquitin-like modifier system, SUMO-specific protease 3, was identified to be essential for cell proliferation and ribosomal RNA processing. Recent studies showed that SUMO-specific protease 3 was elevated in ovarian cancer compared to normal tissue samples. However, the connection between SUMO-specific protease 3-specific expression and clinicopathological parameters of epithelial ovarian cancer, as well as the physiologically potential role of SUMO-specific protease 3 in epithelial ovarian cancer remained unclear. In this study, an analysis of 124 paraffin-embedded slices by immunohistochemistry indicated that SUMO-specific protease 3 expression was positively correlated with the International Federation of Gynecology and Obstetrics stages (p = 0.025), tumor grade (p = 0.004), and lymph node metastasis (p = 0.001) and was also a critical prognostic factor for the overall survival of epithelial ovarian cancer patients, as revealed by Kaplan–Meier curve analysis. Knockdown of SUMO-specific protease 3 weakened the proliferation, migration, and invasion capability of ovarian cancer cells, down-regulated the expression of Proliferating Cell Nuclear Antigen, Forkhead Box C2, and N-cadherin, and resulted in upregulation of p21 and E-cadherin. Consistent with our results, SUMO-specific protease 3 had been verified to promote cell proliferation, metastasis, and tumorigenesis in multiple malignant cancers, which was a redox-sensitive molecule mediating the epithelial–mesenchymal transition. Collectively, our findings for the first time specifically supported that SUMO-specific protease 3 might play an important role in the regulation of epithelial ovarian cancer progression and could serve as a potential biomarker for prognosis as well as provide a promising therapeutic target against epithelial ovarian cancer.
Introduction
Ovarian cancer is one of the most common pathogenesis of female reproductive cancers and causes more mortality than any other gynecologic malignancy. Epithelial ovarian cancer (EOC) accounts for nearly 90% of ovarian cancer. Although the clinical incidence of EOC is greatly low, the incidence is increasing constantly in females. 1 According to GLOBCAN 2012, more than 238,700 estimated new cases and 151,900 estimated deaths of EOC happened worldwide in 2012. 2 Not only due to lack of specific symptoms and effective approach to detect cancer at earlier stages, but also be unable to control the proliferation, metastasis, and chemoresistance of cancer cell in the advanced stage, it results in the high failure rate of effective EOC therapies. 3 Consequently, it is extremely necessary to explore the molecular and cellular mechanisms, identify sensitive prognostic biomarkers of EOC, and pave the way to improve the survival rate and time.
SUMO-specific protease 3 (SENP3) (also termed as SMT3IP1), a SUMO-3-interacting protein that belongs to SUMO-specific protease; preferentially, as a nucleolar protein, SENP3 interacts with nuclear proteins, such as CHIP and Hsp90. 4 Currently, previous research shows that SENP3 can enhance cell proliferation, angiogenesis, and tumorigenesis by regulating reversal of SUMO2/3 modifications in cancer cells under cellular oxidative stress.5,6 SENP3 accumulates to inhibit the transcriptional activity of p53, delay cell senescence, and induce tumorigenesis.7,8 In gastric cancer cells, SENP3, which is a redox-sensitive molecule mediating the epithelial–mesenchymal transition (EMT), promotes the EMT by De-SUMOylation of Forkhead Box C2 (FOXC2). 9 It is reported that SENP3 is elevated in ovarian cancer than normal tissues, as well as prostate, lung, rectal, and colon carcinomas. 5 Another study shows that a single-nucleotide polymorphism (SNP) of SENP3 rs6608 may perform as predictors of risk of EOC and invasiveness. 10 Accordingly, it indicates that SENP3 acts as a critical character in ovarian cancer. However, to date, the correlation between SENP3 expression and EOC patients’ clinical features, and its probable functions in EOC have yet not been known in detail.
In this study, we conducted an investigation into a possible role of SENP3 in EOC progression and evaluated the SENP3 expression in EOC cell lines and EOC specimens. We also investigated the correlation of SENP3 expression with clinicopathological characteristics and prognostic implications. Moreover, we explored the role of SENP3 expression in EOC cell proliferation, migration, and invasion. This study provided the first demonstration that SENP3 upregulation promoted EOC proliferation and progression.
Materials and methods
Tissue specimen selection
All cases (63 serous papillary adenocarcinoma, five mucinous papillary carcinoma, 11 endometrioid adenocarcinoma, 11 clear cell carcinoma, and 34 specimens were classified as others) from 2004 to 2009 were included in this study, and 10 normal ovarian tissues were selected as controls. The formalin-fixed, paraffin-embedded tissues of all cases were extracted from the Department of Pathology, Affiliated Hospital of Nantong University. The information of 124 specimens included age, the International Federation of Gynecology and Obstetrics (FIGO) stages, tumor grade base on pathology, histological type, volume of ascites, lymph node metastasis, and residual tumor size (Table 1). A total of 12 fresh samples were frozen in liquid nitrogen immediately after surgical removal and maintained at −80°C until using for western blot analysis, containing nine EOC tissues and three normal fresh tissues. And all cases of EOC patients were collected using protocols approved by the Ethics Committee of Affiliated Hospital of Nantong University.
Survival status and clinicopathologic parameters of 124 EOC specimens.

Statistical analyses were performed by the Pearson χ2 test.
EOC: epithelial ovarian cancer; FIGO: International Federation of Gynecology and Obstetrics; SENP3: SUMO-specific protease 3.
p < 0.05 was considered significant.
Antibodies
The antibodies used for western blots and immunohistochemistry in this study included mouse anti-human SENP3 monoclonal antibody (Santa Cruz Biotechnology, Santa Cruz, USA), mouse anti-human Proliferating Cell Nuclear Antigen (PCNA) monoclonal antibody (Santa Cruz Biotechnology), goat anti-human FOXC2 monoclonal antibody (Santa Cruz Biotechnology), mouse anti-human p21 monoclonal antibody (Santa Cruz Biotechnology), rabbit anti-human E-cadherin monoclonal antibody (Santa Cruz Biotechnology), rabbit anti-human N-cadherin monoclonal antibody (Santa Cruz Biotechnology), and rabbit anti-human glyceraldehyde 3-phosphate dehydrogenase (GAPDH) polyclonal antibody (Santa Cruz Biotechnology).
Immunohistochemical staining
Formalin-fixed, paraffin-embedded tissue sections (4 µm) from patients were prepared on glass slides. The sections were deparaffinized in xylene and rehydrated with graded alcohol. Then, antigen retrieval was accomplished by heating to 121°C for 3 min with an autoclave in 10 mmol/L citrate buffer (pH 6.0). After cooling, hydrogen peroxide (0.3%) was applied to block endogenous peroxide activity for 20 min. After rinsed in phosphate-buffered saline (PBS; pH 7.2), the sections were labeled with anti-human SENP3 antibody in a 1:100 dilution for 150 min at room temperature. All slides were processed using the peroxidase–antiperoxidase method (Dako, Hamburg, Germany). After washed with PBS, the peroxidase reaction was visualized by incubating the sections with DAB (3,3′-diaminobenzidine; 0.1% phosphate buffer solution, 0.02% diaminobenzidine tetrahydrochloride, and 3% H2O2). After being rinsed in water, the sections were counterstained with hematoxylin. Then, the sections were dehydrated with graded alcohol and mounted in resin mount with cover slip.
Immunohistochemical evaluation
All immunostained sections were randomly examined by two independent blinded investigators. Five views were chosen randomly per slide, which were used to represent the whole tissue concentration of the stain or proportion of positive pixels, and at least 1000 cells were counted per view at high power fields using a Leica fluorescence microscope (Leica Microsystems, Wetzlar, Germany). The number of positive staining cells was estimated with a semi-quantitative method. First, score of the staining intensity was classified as follows: 0 (colorless), 1 (buff), 2 (brownish yellow), and 3 (dark brown). Second, scores of the percentage of positive cells were divided into four groups: 1 (25% positive cells or less), 2 (26%–50% positive cells), 3 (51%–75% positive cells), and 4 (more than 75% positive cells). The staining index was evaluated by multiplying the staining intensity score to the positive tumor cell score. Based on a measure of heterogeneity, a staining index of 3 or greater was defined as high expression, and 2 or lower as low expression.
Cell lines
Human epithelial ovarian carcinoma cell lines SKOV3 and HO-8910 were purchased from Shanghai Institute of Cell Biology. SKOV3 and HO-8910 cells were cultured in RPMI 1640 (GibCo BRL, Grand Island, NY, USA) supplemented with 10% fetal bovine serum (FBS), and 100 U/mL penicillin streptomycin mixture at 37°C in a humidified atmosphere of 5% CO2.
Western blotting
Western blotting was performed as previously described. 11 The antibodies for SENP3, PCNA, FOXC2, p21, E-cadherin, and GAPDH in 5% milk/Tris-buffered saline Tween 20 (TBST) were used. The signal was observed by using an enhanced chemiluminescence (ECL) plus kit (Pierce, Rockford, IL, USA). The relative expression of each protein was determined using ImageJ analysis system (Wayne Rasband, National Institutes of Health, USA).
Cell treatment and transient transfection
Cells were transient transfected with SENP3-shRNA (shSENP3), Control-shRNA (shControl), Flag, or Flag-SENP3 according to the manufactures’ instructions. The shSENP3 and shControl were purchased from Genechem (Shanghai, China). The SENP3-specific shRNA target sequence: shSENP3#1 was 5′-TTGGTCCCTCATCTCTGTT-3′, shSENP3#2 was 5′-TCGCTGACATTCCACTGGA-3′, shSENP3#3 was 5′-AAAGAAAGACCGACTGGAT-3′, and shSENP3#4 was 5′-TTCAAACGTATGGCAGCCT-3′. The Flag and Flag-SENP3 were purchased from PPL (Biogot, Shanghai, China). The medium was replaced with fresh medium 6 h after transfection. Cells were gathered for western blots, flow cytometry assays, and Cell Counting Kit-8 (CCK-8) after transfection for 48 h.
Flow cytometric analysis
Cells were harvested 48 h after transfection with shSENP3 and shControl, fixed in 70% ethanol for at least 24 h at −20°C, and then incubated with 1 mg/mL RNase A for 20 min at 37°C. Subsequently, cells were stained with 0.5% Tween 20 propidium iodide (PI) (50 mg/mL, Becton–Dickinson, San Jose, CA, USA) in PBS, and analyzed by a Becton–Dickinson flow cytometer BD FACScan as well as Cell Quest acquisition and ModFit analysis programs (Verity Software House, Topsham, ME, USA). 12
Cell viability assessment by CCK-8 and colony formation assays
Cell viability was measured using CCK-8 (Dojindo, Kumamoto, Japan). Cells were cultured in PRMI 1640 free of FBS at 37°C for 6, 12, 24, 48, and 72 h. Then CCK-8 was added to each sample and incubated for 2 h. The absorbance of solution was recorded at a test wavelength of 490 nm and a reference wavelength of 630 nm with a microplate reader (Bio-Rad Laboratories). For colony formation assays, the cells were cultivated on a six-well (500 cells/plate) plate and cultured for 2 weeks. The colonies were stained with 1% crystal violet for 2 h after fixation with 4% formaldehyde for 20 min. Colonies (⩾50 cells/colony) were scored.
Wound healing assay and transwell invasion assay
Migration capability of cells was measured using the wound-healing assay in vitro. Cells were seeded into six-well plates and prepared until 90% growth confluence in a monolayer. Cells were serum starved for 12 h to inactivate cell proliferation, and wounds were afflicted by scraping the monolayer cells with a sterile 10-µL pipette tip. At 0, 24, and 48 h after the wounding, cells were observed under the inverted Leica phase-contrast microscope (Leica DFC 300 FX) to measure the distance between the two wounds at each time point, and represent the average percentage wound closure compared to that at zero time. Invasion of cells were analyzed by transwell invasion assays. For transwell invasion assays, the 24-well transwell filter (BD Biosciences, Bedford, MA, USA) chamber was uniformly distributed with Matrigel (BD Biosciences) for 2 h at 37°C before the cells were added. The bottom chambers of 24-well transwell plates were filled with 500 µL 1640 containing 10% FBS, and a total of 1 × 10⁵ cells were seeded into the top chamber of a transwell filter in 200 µL 1640 free of FBS and incubated for 24 h. Top (non-migrated) cells were removed with cotton swabs, and invasive cells on the lower side of the filter were fixed in 4% paraformaldehyde and stained in 1% crystal violet. Images of five random fields were taken using a microscope, and migrated cells were counted (original magnification, ×200) to determine the means. 13
Statistical analysis
The chi-square (χ2) test was used to determine the correlation between SENP3 expression and various clinicopathological features. The Student’s t-test was applied to assess the statistical significance of the observed differences among groups. Kaplan–Meier curves with log-rank test were generated to evaluate patient survival curves. Multivariate analysis was performed using the Cox proportional hazard models to evaluate the prognostic factors for survival time. Data analyses were conducted using SPSS20.0 (IBM Corporation, Armonk, NY, USA) statistical software and GraphPad Prism 6.0 (GraphPad, La Jolla, CA, USA) program. A p-value of <0.05 for all statistical analyses was set to indicate significant differences. All p-values were expressed as mean ± standard error of mean (SEM). Significant differences were attached in the graphs. Each experiment was made up of at least three replicates per condition.
Results
Differential SENP3 expression in EOC tissues and its relationship with clinicopathological parameters
Western blots were used to examine SENP3 expression in tissue specimens for proteomic analysis (EOC tissues, n = 9; and normal ovarian tissues, n = 3). Despite intragroup variation of SENP3, our results showed that SENP3 protein expression was higher in all nine fresh EOC tissues form G1 to G3 compared to that of three normal ovarian tissues (Figure 1(a) and (b)). This was further confirmed by immunohistochemical (IHC) results (Figure 2). Examples of normal ovarian tissues, serous adenocarcinoma, mucinous adenocarcinoma, and endometrioid adenocarcinoma stained for SENP3 are shown in Figure 2(a)–(f). SENP3 expression was significantly higher in EOC samples than that in normal ovarian tissues. As shown in Table 2, there were no significant differences of staining among different subtypes of ovarian tumors (p = 0.068). SENP3 immunostaining intensity was significantly related with FIGO stages (p = 0.025), tumor grade (p = 0.004), and lymph node metastasis (p = 0.001). However, the associations between SENP3 expression and age, residual tumor size, and ascites were not significant (p > 0.05).

Expression changes of SENP3 in normal ovary and EOC tissues. (a) Protein levels of SENP3 and PCNA in normal ovarian tissues (N1, N2, N3) and EOC tissues (C1–C9) from grade 1 (G1) to grade 3 (G3) by western blots. (b) The bar chart demonstrated the ratio of SENP3 to GADPH protein levels by densitometry.

SENP3 expression and distribution was examined in 124 EOC tissues by immunohistochemistry staining. (a)–(f) Representative photographs of SENP3 immunohistochemistry in paraffin-embedded EOC tissue samples. (a) serous papillary adenocarcinoma; (b) mucinous papillary adenocarcinoma; (c) endometrioid adenocarcinoma; (d) clear cell carcinoma; (e) poorly differentiated adenocarcinoma; and (f) normal ovarian tissue. Original magnification ×200.
SENP3 expressions and clinicopathologic characteristics on 124 EOC specimens.

Statistical analyses were performed by the Pearson χ2 test.
EOC: epithelial ovarian cancer; SENP3: SUMO-specific protease 3; FIGO: International Federation of Gynecology and Obstetrics.
p < 0.05 was considered significant.
Prognostic role for SENP3 expression in EOC patients
Previous studies reported that SENP3 was elevated in ovarian cancer than normal tissues, as well as prostate, lung, rectal, and colon carcinomas, 5 but its prognostic role in EOC was unknown. In our study, Kaplan–Meier analysis and log-rank test showed that EOC patients with high SENP3 expression predicted poor survival, as well as FIGO stages III–IV had a poor overall survival (OS) compared to FIGO stages I–II (Figure 3(a) and (b)). Furthermore, by reviewing FIGO I–II and III–IV separately, we also found that the high expression of SENP3 forecasted poor survival (Figure 3(c) and (d)). Respectively, in the univariate analysis, expression of high level of SENP3 expression (p < 0.001), FIGO stages (p = 0.001), tumor grade (p = 0.001), and residual tumor size (p = 0.033) were correlated with OS (Table 3). To determine whether SENP3 expression level was an independent prognostic factor for EOC patients’ survival time, a multivariate analysis was performed using the Cox proportional hazard regression model for all of the significant variables in the univariate analysis. Again, SENP3 expression (p < 0.001) was positively associated with EOC patients’ recurrence and survival time, as well as FIGO stages (p = 0.008) and tumor grade (p = 0.008) (Table 3).

Kaplan–Meier survival curves for 124 EOC patients according to SENP3 expression status. (a) Kaplan–Meier survival analysis of SENP3 expression status. (b) Cumulative overall survival differences between patients with FIGO III–IV and FIGO I–II (c) and (d) Kaplan–Meier survival analysis of SENP3 expression and survival rates of EOC patients in FIGO I–II and III–IV were exhibited separately.
Univariate and multivariate Cox proportional hazard models of overall survival.

Histological type: non-serous vs serous; ascites: positive vs negative; lymph node metastasis: positive vs negative.
HR: hazard ratio; CI: confidence interval; FIGO: International Federation of Gynecology and Obstetrics; SENP3: SUMO-specific protease 3.
p < 0.05 was considered significant.
Expression of SENP3 promoted proliferation of ovarian cancer cells
To investigate the biological function of SENP3 in EOC cells, we chose two different types of human EOC cell lines, SKOV3 and HO-8910 cells for the followed series of experiments. Previous studies found that SENP3 could promote cell proliferation,5,6 and according to the results presented above, SENP3 was positively correlated with PCNA expression and tumor grade, which were considered proliferation markers. Thus, we analyzed the proliferation ability of SENP3. Western blot analysis was used to measure the SENP3 expression in SKOV3 and HO-8910 cells (Figure 4(a) and (b)). And two ovarian cancer cells were transfected with shSENP3 when cell density reached 80%, the results assessed that shSENP3#2 had a significant higher interference efficiency compared to others in two cell lines. Therefore, we chose the shSENP3#2 to complete the following experiments (Figure 4(c) and (d)). First, SKOV3 and HO-8910 cells were transfected with shSENP3#2 and were determined by CCK-8 assay, knockdown of SENP3 demonstrated to decrease ovarian cancer cells growth rate compared to the control group (Figure 4(e)). Next, we explored the proliferation mechanism of SENP3 by flow cytometric analysis, and data suggested that cells transfected with shSENP3#2 revealed G0/G1 phase arrest, while the S phase decreased in contrast to Control (Figure 5(a) and (b)). Consistent with the result of CCK-8 assay and flow cytometric analysis by knockdown of SENP3, colony forming assay also showed that it could decrease colony formation (Figure 5(c) and (d)). The bar charts represent quantifications of the flow cytometric analysis and colony forming assay (Figure 5(e)).

Knockdown of SENP3 suppressed EOC cell proliferation. (a) and (b) The protein levels of endogenous SENP3 in human EOC cell lines: SKOV3, HO-8910. The bar charts were quantifications of SENP3 protein levels in EOC cell lines by western blots. (c) and (d) SENP3 protein levels were detected by western blots after transfected for 48 h with shSENP3 in EOC cells, while shSENP3#2 achieved the best effected downregulation. The relative level of SENP3 was tested by densitometry. (e) CCK-8 assay was measured by cell proliferation. EOC cells treated with shSENP3#2 revealed significantly weakened cells proliferation. Absorbance was used to examine the shControl and shSENP3#2-treated EOC cells. All data were representative results of three independent experiments.

Silence of SENP3 caused cell cycle arrest at G1 phase and inhibited colony formation. (a) and (b) Cell cycle analysis showed that in both SKOV3 and HO-8910 cell lines, interference of SENP3 led to an increase of cell percentage in G1 phase, with a concomitant reduction of cells in S phase. (c) and (d) Colony formation analysis of ovarian cancer cells treated with shControl or shSENP3#2. Knockdown of SENP3 suppressed cell colony formation. (e) The bar charts displayed quantifications of the flow cytometric analysis and colony forming assay. The results were responsible for three independent experiments.
SENP3 could promote cell migration and invasion in vitro
Given that SENP3 was related to lymph node metastasis in ovarian cancer specimens, we studied whether SENP3 could affect ovarian cancer cells migration and invasion. A wound scratch migration assay was performed to analyze the effect of SENP3 on migration of SKOV3 and HO-8910 cells. And we found that both cell lines transfected with shSENP3#2 had drastically minor migratory capacity than controls at 24 and 48 h after scratching (Figure 6(a) and (b)). Moreover, transwell invasion assay was performed to assess the directional invasion abilities of the cells after SENP3 knockdown. SKOV3 (Figure 6(c)) and HO-8910 (Figure 6(d)) cells transfected with shSENP3#2 remarkably attenuated the invasive ability compared with those transfected with the control. Generally, we could make a conclusion that SENP3 promoted migration and invasion of ovarian cancer cells.

Silence of SENP3 inhibited EOC cell migration and invasion. (a) and (b) SKOV3 cells and HO-8910 cells expressing Control or shSENP3#2 were scratched by a 10-µL pipette tip and cultured for 48 h. Representative images of wound healing were shown. The relative ratio of wound closure per field was shown at 0, 24, 48 h. (c) and (d) Ovarian cancer cells transfected with either shControl or shSENP3#2 were seeded in transwells covered with matrix gel and cultured for 24 h. Representative images of transwell assays were shown. The numbers of invading cells were counted, and the invasion values were shown as fold change of invading cells relative to control. The same experiment was repeated for at least three times.
The signal pathway of SENP3 in promoting cell proliferation and migration
Furthermore, to study the mechanism which SENP3 regulated ovarian cancer cell proliferation, migration, and invasion, we used western blots to detect changes of the related protein when SENP3 was changed in SKOV3 and HO-8910 cells. As was shown in Figure 7, knockdown of endogenous SENP3 expression could decrease PCNA, FOXC2, and N-cadherin, and increase p21 and E-cadherin expression. However, for SENP3 upregulation assay, expression of PCNA, FOXC2, and N-cadherin was increased, and expression of p21 and E-cadherin was decreased while upregulating SENP3.
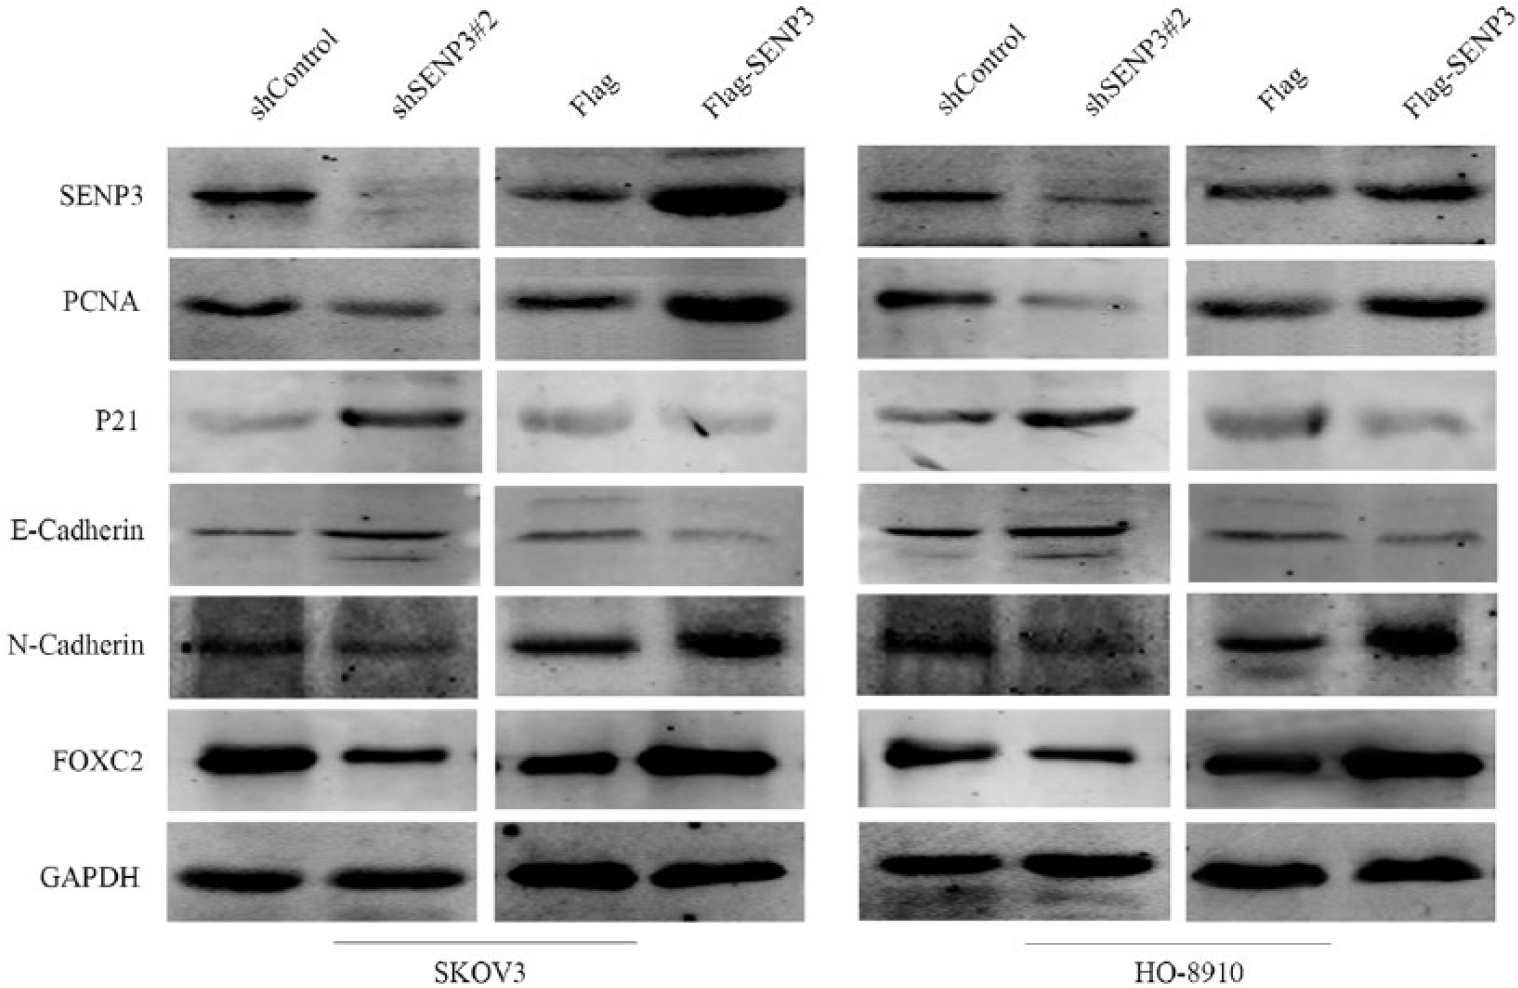
Western blot analysis showed the effect of SENP3 change on the protein levels of PCNA, p21, FOXC2, E-cadherin as well as N-cadherin in both SKOV3 and HO-8910 cell lines. GAPDH was used as a loading control. The same experiment was repeated for at least three times.
Discussion
As a prevailing cause of tumor death associated with gynecological neoplasm, EOC exhibits no known tumor markers or presents any specific symptoms, thus leading to delayed late diagnosis and treatment resistance. The survival rate and time of ovarian cancer remains poor despite advances in surgery and chemotherapy. Undergoing therapy, clinical remission, and relapse frequently happens in EOC patients, which affects women’s lives.14,15 Accordingly, it is of great significance to recognize novel diagnostic or prognostic markers connected to EOC progression and metastasis.
In this study, we assessed SENP3 expression in 124 ovarian tumors and 10 normal ovary tissues samples. We found that SENP3 expression was upregulated in 59/124 of ovarian carcinomas but was hardly expressed in normal ovarian tissue. The SENP3 was more highly expressed in EOC tissues than that in normal tissues. High SENP3 expression, advanced FIGO stages, high tumor grade and residual tumor size (≥1) were closely associated with poor disease-specific survival. Multivariate Cox proportional hazards regression analysis showed that SENP3 protein expression was an independent predictor of overall survival of EOC patients. Our current data were consistent with a previous study of SENP3 overexpression in oral squamous cell cancer (OSCC). 16
As one of the necessary members of the SENP family, SENP3 appears to be involved in regulating some aspects of nucleolar function and it is localized in the nucleolus. 17 The ARF tumor suppressor protein is recognized to initiate SENP3 phosphorylation, ubiquitylation, and subsequent proteosomal-mediated degradation; low expression of ARF is examined with the onset of several human cancers, including ovarian cancer.18–20 Hence, loss of the ARF which ascribes to the raising SENP3 levels can be observed in various carcinomas. In promyelocytic leukemia, SENP3-mediated de-conjugation of SUMO2/3 has been indicated to associate with quicken cell proliferation under mild oxidative stress. 5 In response to oxidative stress, SENP3, as a redox sensor, may play an important role in the course of OSCC progression and tumorigenesis. 16 SUMO modification is a dynamic and reversible process. Modification of SUMO2/3 can promote the transcriptional activity of p53, and SENP3 is a SUMO2/3 specific protease. Presumably SENP3 could inhibit p53 transcriptional activity and the expression of target gene p21.7,8,21 In addition, SENP3 is proved to promote the EMT through De-SUMOylation of FOXC2 in gastric cancer cells. 9 FOXC2 is investigated to regulate cell proliferation in ovarian cancer and promote the growth and migration of pancreatic ductal cancer cells.22,23 Recent studies show that a SNP of SENP3 rs6608 can act as predictors of risk of EOC and invasiveness, and SENP3 is elevated in ovarian cancer than normal tissues.5,10 Consequently, it indicates that SENP3 can act as an essential character in ovarian cancer. However, the correlation between the overexpression of SENP3 and its association with EOC has yet not been elucidated entirely.
In this study, we assessed SENP3 expression in normal human ovary and malignant EOC tissues. The expression level of SENP3 was correlated with tumor grade, FIGO stages, lymph node metastasis of EOC patients, as well as poor prognosis. Furthermore, downregulating SENP3 by shRNA markedly inhibited EOC proliferation, migration, and invasion. In summary, this study provided a specific insight into the role of SENP3 in the progression of EOC, and highlighted its potential as a candidate prognostic marker for EOC patients.
Footnotes
Acknowledgements
J.C. and M.S. contributed equally to this work.
Declaration of conflicting interests
The authors declared no potential conflicts of interest with respect to the research, authorship, and/or publication of this article.
Funding
The author(s) disclosed receipt of the following financial support for the research, authorship, and/or publication of this article: This work was supported by The National Natural Science Foundation of China (No. 81472185), and the Science and Technology Project Foundation of Nantong City (No.MS12015006).