
Abstract
Astrocytic tumors are the most common neuroepithelial neoplasms with high relapse rate after surgery. Understanding the molecular mechanisms for astrocytic tumorigenesis and progression will lead to early diagnosis and effective treatment of astrocytic tumors. The DEK mRNA and protein expression in normal brain tissues and astrocytic tumors was quantified. To investigate DEK functions in tumor cells, DEK gene was silenced with siRNA in U251 glioblastoma cells. Cell proliferation, cell cycle and apoptosis were then measured. The expression and activity of key genes that regulate cell proliferation and apoptosis were also measured. We identified DEK as a high expressed gene in astrocytic tumor tissues. DEK expression level was positively correlated with the pathological grade of astrocytic tumors. Gene silencing of DEK in U251 glioblastomas inhibited cell proliferation and blocked cells at G0/G1 phase of cell cycle. DEK depletion also induced cell apoptosis, with up-regulated expression of P53 and P21 and down-regulated expression of Bcl-2 and C-myc. The Caspase-3 activity in U251 cells was also significantly increased after knockdown. Our results provided evidences that DEK regulates proliferation and apoptosis of glioblastomas. DEK gene silencing may induce apoptosis through P53-dependent pathway. Our data indicated DEK plays multiple roles to facilitate tumor growth and maintenance. It can be used as a potential target for astrocytic tumor diagnosis and gene therapy.
Introduction
Astrocytic tumors are the most common brain cancers that are derived from star-shaped brain cells called astrocytes. The astrocytic tumors are classified into four grades (I–IV) by the World Health Organization (WHO) based on their clinical features. The grade I (pilocytic astrocytoma) and II (diffuse astrocytoma) tumors grow slowly in the brain or spinal cord. The grade III (anaplastic astrocytoma) and IV (glioblastoma) are more clinically aggressive with rapid growth and diffusion to nearby tissues.1 –4 According to the WHO records, only 10% of astrocytic tumors are of low grade (I and II), while 20% and 70% of astrocytic tumors are of grade III and IV, respectively. Due to high infiltrative nature, complete surgical removal of the tumors is very difficult. Surgery combined with radiotherapy, chemotherapy, and gene therapy has been used to improve patient survival. 3 However, the average survival time for patients with anaplastic astrocytoma and glioblastoma is only 30–36 months and 12–15 months, and 5-year survival rates are only 28.2% and 2.9%, respectively. It is therefore important to develop new therapies to improve patient survival rate. Gene therapy provided a number of potential treatments for various cancers and showed good prospect in the treatment of astrocytic tumors.1 –3,5 With the study of astrocytic tumor, genes that are involved in tumor formation, development, and prognosis have been identified in recent years, which can be used as potential targets for cancer treatment.6,7
The DEK proto-oncogene was originally discovered in a subset of acute myelogenous leukemia (AML) with chromosomal translocation (6; 9)(p23; q34), which led to fusion of DEK gene on the short arm of chromosome 6 with CAN gene fragment on chromosome 9 to form a fusion gene DEK-CAN.8,9 The DEK gene encodes a DNA-binding protein that regulates multiple chromatin-related processes such as transcription, replication, splicing, and DNA repair.10,11 DEK is preferentially expressed in actively proliferating and malignant cells, and its function is closely related to many human diseases. 12 For example, it functions as an autoantigen in multiple autoimmune diseases, such as juvenile rheumatoid arthritis, and systemic lupus erythematosus.13 –15 DEK is highly expressed in numerous human tumor types and promotes tumor growth through inhibition of cellular senescence and differentiation,facilitation of cell transformation, and prevention of apoptosis.11,12,16,17 Accordingly, DEK overexpression is significantly correlated with tumor growth, late pathological stage, and poor prognosis.18 –21
Although DEK has been studied in many tumor types, its expression and functions in astrocytic tumors are less known. In this study, we measured DEK expression in both normal brain tissues and astrocytic tumors. We also investigated the consequence of DEK gene silencing on U251 glioblastoma cell proliferation and apoptosis. Our study helps to better understand the roles of DEK in tumor formation and progression, suggesting DEK gene silencing can be a potential gene therapy approach for astrocytic tumors.
Materials and methods
Tissue specimens
All specimens were collected in the Shengjing Hospital of China Medical University (Shenyang, China) from June 2007 to February 2009. Totally, 19 males and 18 females participated in this study. Overall, 32 astrocytic tumor specimens were obtained by neurosurgical excision and verified by pathology examination. Normal brain tissues from five patients with craniocerebral trauma or cerebral hemorrhage were obtained by decompression surgery. In total, 14 out of 32 cases were classified as low-grade tumors (I and II) and 18 cases were classified as high-grade tumors (III and IV). 4
Cell culture and transfection
Human U251 glioblastoma cells were obtained from the Shanghai Institute of Biochemistry and Cell Biology, Chinese Academy of Sciences (Shanghai, China). The cells were maintained in Dulbecco’s modified Eagle’s medium supplemented with 10% (v/v) fetal bovine serum at 37°C with 5% CO2.
RNA isolation and reverse transcription polymerase chain reaction
RNA was isolated with TRIZol reagent (Thermo Fisher Scientific) and reverse transcribed. Polymerase chain reaction (PCR) amplification conditions were as follows: heating at 94°C for 2 min; followed by 35 cycles of 94°C for 15 s, 55°C for 30 s, and 72°C for 1 min; ended with 72°C for 5 min. The PCR products were kept at 4°C. The primer sequences used were as follows: DEK 5′-AAGAATGTGGGTCAGTTCAG-3′ (forward) and 5′-GTGCTGCTATCTGCTTTCTT-3′ (reverse); β-actin 5′-GTGGGCCGCTCTAGGCACCAA-3′ (forward) and 5′-CTCTTTGATGTCACGCACGATTTC-3′ (reverse).
The amplified products were separated on 1.5% agarose gel and stained with ethidium bromide (1 µg/µL). The fluorescence from PCR products was quantified, and the integrated density value (IDV) for DEK and β-actin genes was calculated. The IDV ratio between DEK and β-actin was used to represent the relative expression level of DEK messenger RNA (mRNA). The experiments were repeated three times.
Gene silencing
U251 cells were seeded on six-well cell culture plates at 2 × 10⁵ cells/well. Small interfering RNA (siRNA) was transfected into cells using Lipofectamine 2000 (Thermo Fisher Scientific). The cells were separated into three groups: the siRNA-DEK group (DEK siRNA treatment), the negative control group (non-targeting siRNA treatment), and the normal control group (no siRNA). The siRNAs were designed and synthesized by QIAGEN. The siRNA sequences used were as follows—DEK siRNA: 5′-CGAUGAACUUAGAAAUCUATT-3′ and non-targeting siRNA: 5′-CGAUGCACUGAGAACUCUATT-3′. After 48 h of transfection, the cells were collected for downstream analysis.
Western blotting
Cells were homogenized in lysis buffer (50 mM Tris-HCl, 250 mM sucrose, 2 mM ethylenediaminetetraacetic acid (EDTA), 1 mM ethylene glycol-bis(β-aminoethyl ether)-N,N,N′,N′-tetraacetic acid (EGTA), 10 mM 2-mercaptoethanol, 0.5% Triton X-100, and 10 mM phenylmethylsulfonyl fluoride (PMSF)). The lysate was centrifuged at 15,000 r/min at 4°C for 5 min. The supernatant was collected and stored at −70°C. Protein concentration was measured with DC Protein Assay Kit (Bio-Rad Laboratories). Proteins were separated by sodium dodecyl sulfate–polyacrylamide gel electrophoresis (SDS-PAGE; Bio-Rad Laboratories), transferred onto polyvinylidene difluoride (PVDF) membranes, and probed with anti-DEK (1:1000 dilution), anti-p53 (1:500 dilution), anti-p21 (1:200 dilution), anti-BCL-2 (1:400 dilution), anti-c-Myc (1:100 dilution), anti-cleaved caspase3 (1:200 dilution), pro-cleaved caspase3 (1:200 dilution), and anti-β-actin (1:500 dilution) antibodies. The membrane was then probed with horseradish peroxidase (HRP)-conjugated secondary antibodies. ECL kit was used to visualize immunoreactive proteins. DEK protein level was represented as the IDV ratio between DEK and β-actin.
Immunohistochemistry
The paraffin embedded sections were deparaffinized, rehydrated in an ethanol series, and washed with distilled water and phosphate-buffered saline (PBS). The sections were then treated with 3% H2O2 for 10 min at room temperature to inactivate endogenous enzyme activities. After washing with water, the paraffin sections were subjected to high-pressure antigen repair and blocked with serum for 20 min at room temperature. The sections were incubated with anti-DEK antibody (1:50 dilution) for overnight at 4°C and then probed with biotin-labeled anti-rabbit secondary antibody at 37°C for 20 min. The sections were incubated with streptavidin–biotin complex (SABC) reagent at 37°C for 20 min, developed with 3,3′-diaminobenzidine (DAB) solution, and stained with hematoxylin for 1–2 min.
The staining intensity was scored as 0 for no staining, 1 for light brown, 2 for brown, and 3 for dark brown. To measure the proportion of DEK-positive cells, five different fields were randomly selected under microscope, 200 cells were counted, and the percentage of positively stained cells was calculated. The proportion of DEK-positive cells was scored as 0 for <5%, 1 for 5%–25%, 2 for 26%–50%, 3 for 51%–75%, and 4 for >75%. The expression score was calculated as (staining intensity score) × (proportion score). The DEK expression was assigned as negative (−) for score 0–1, weak positive (+) for score 2–5, positive (++) for score 6–8, and strong positive (+++) for score >9.
Image analysis
The images were captured by BX51 microscope (Olympus) and Evolution MP5.5 cold CCD. Five vision fields were randomly selected from each section. The optical density average, integral optical density average, and the percentage of positive cells were calculated with MetaMorph 4.5 image analysis software.
Cell proliferation assay
Cells were transfected with siRNA and were collected at 24, 48, and 72 h time points after transfection. The cell culture medium was removed 4 h before each time point. The cells were incubated with 80 µL of serum-free opti-MEM medium and 20 µL of 3-(4,5-dimethylthiazol-2-yl)-2,5-diphenyltetrazolium bromide (MTT) solution (5 mg/mL) for 4 h. The supernatant was then aspirated and 150 µL of dimethyl sulfoxide (DMSO) was added to each well. The plates were placed on a shaker for 10 min. The cell lysate absorbance was measured at 570 nm with a microplate reader. The experiments were repeated three times, and the data were represented as mean ± standard deviation (SD).
Apoptosis assay
Cultured cells were trypsinized, washed with cold PBS, and resuspended in 195 µL of Annexin V–fluorescein isothiocyanate (FITC) binding solution. A volume of 5 µL of Annexin V–FITC was added to the cells and mixed. A volume of 10 µL of propidium iodide (PI) was then added to the cells. The cells were incubated at 4°C for 5 min in the dark, and the fluorescence was measured with flow cytometry (BD Biosciences).
Cell cycle measurement
After 48 h of transfection, the cells were collected, fixed with 70% ethanol at 4°C for 24 h, and incubated at 37°C for 1 h with RNase A (50 µg/mL). The cells were stained with PI (100 µg/mL) for 20–30 min. Cell cycle was measured with flow cytometry (BD Biosciences).
Caspase-3 activity assay
Cells were lysed in 50 µL of cold lysis buffer, incubated on ice for 10 min, and centrifuged at 12,000 r/min at 4°C for 10 min. A volume of 50 µL of supernatant was mixed with 50 µL of reaction buffer and 5 µL of enzyme substrate (DEVD-pNA). After enzyme reaction at 37°C for 1 h, the absorbance at 405 nm was measured with a microplate reader.
Statistical analysis
Statistical analysis was performed with SPSS 13.0 software. All data were presented as mean ± SD. One-way analysis of variance (ANOVA) was used to assess the statistically significant difference between groups. Least significant difference (LSD) test or Dunnett’s test was used for post hoc comparisons. p value less than 0.05 was considered to be statistical significant.
Results
Upregulation of DEK mRNA expression in astrocytic tumors
DEK expression in tumor and in normal tissues was measured with reverse transcription PCR (RT-PCR). DEK mRNA was detected in 93.8% (30/32) of patients with astrocytic tumors but only in 20% (1/5) of patients with cerebral hemorrhage (Figure 1(A)). The relative DEK mRNA level (DEK IDV/β-actin IDV) was 0.30 ± 0.18 in low-grade astrocytic tumors (grade I and II) and 0.80 ± 0.10 in high-grade astrocytic tumors (grade III and IV), in contrast to 0.04 ± 0.02 in normal brain tissues. Compared to the normal brain tissues, astrocytic tumors had significant increase of DEK mRNA expression (p < 0.05). High-grade tumors also showed significantly higher DEK expression compared to the low-grade tumors (p < 0.05; Figure 1(C)).

DEK expression in astrocytic tumors and normal brain tissues. (a) DEK mRNA and (b) protein expression in high-grade tumors (lane 1–5), low-grade tumors (lane 6–10), and normal brain tissues (lane 11–13). β-actin was used as an internal control for gene expression. (c) DEK mRNA and (d) protein expression levels were normalized by β-actin level. The significant difference (p < 0.05) was denoted as “a” (compared with the normal brain tissues) and “b” (compared with the low-grade tumors).
Upregulation of DEK protein expression in astrocytic tumors
DEK protein showed high expression in all tumor samples while it was not detected in normal brain tissues (Figure 1(B)). Increased protein expression is positively correlated with tumor progression. The relative DEK protein level (DEK IDV/β-actin IDV) was significantly higher in the high-grade (0.70 ± 0.14) tumors compared with the low-grade tumors (0.14 ± 0.06; Figure 1(D)).
To confirm the western blotting result, we stained the brain tissues with a specific DEK antibody. DEK was mainly located in cell nucleus with increased staining in the high-grade tumors (Figure 2(A)–(D)). Overall, 31/32 (96.88%) tumor cases were DEK positive while only 2/5 (40%) normal cases showed positive staining. In total, 88.3% ± 5.6% of cells in the high-grade tumors, 51.6% ± 9.7% cells in the low-grade tumors, and 36.0% ± 5.7% cells in the normal brain tissues were DEK positive. The averages of optical density and the integrated optical density were higher in astrocytic tumors (Figure 2(E)–(G)). Strong DEK expression was found in 11/18 high-grade, and in 3/14 low-grade tumors (Table 1). Taken together, our data indicated that DEK had high expression in astrocytic tumors and its expression level positively correlated with the tumor progression.
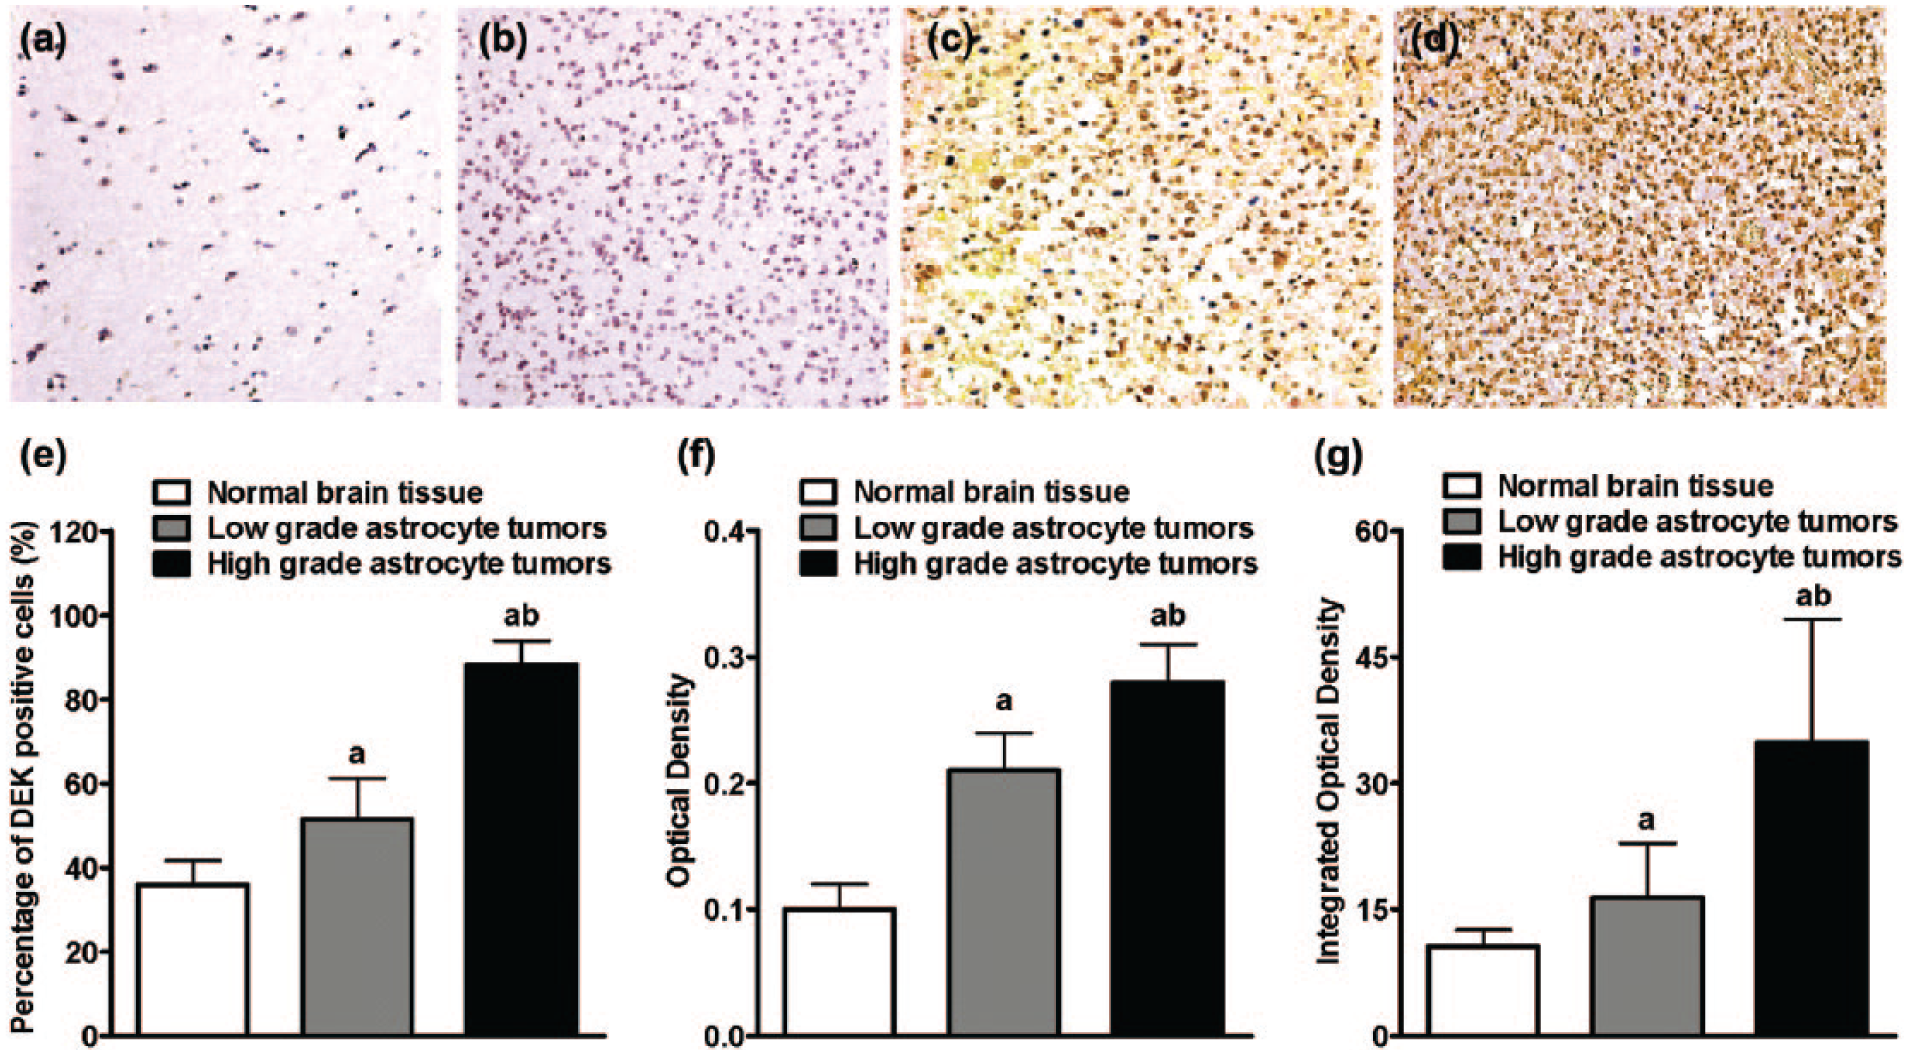
Detection of DEK protein expression by immunohistochemistry in (a) normal brain tissue and (b–d) grade II–IV astrocytic tumors. Bar plots of percentage of (e) DEK-positive cells, (f) optical density, and (g) integrated optical density in normal brain tissues and astrocytic tumors. The significant difference (p < 0.05) was denoted as “a” (compared with the normal brain tissues) and “b” (compared with the low-grade tumors).
DEK expression in normal brain tissues and astrocytic tumors detected by immunohistochemistry.

Compared with the normal brain tissues, p < 0.05.
Compared with the low-grade tumors, p < 0.05.
DEK gene silencing by siRNA in U251 glioblastoma cells
To investigate the function of DEK, we depleted DEK in U251 cells with siRNA. DEK mRNA level in the siRNA-DEK-transfected group was significantly lower than that in the negative control and the blank control groups (Figure 3(A)). The relative level of DEK mRNA was 0.54 ± 0.08 in the siRNA-DEK, 0.92 ± 0.03 in the negative control group, and 0.88 ± 0.04 in the blank control group. The difference was significant (Figure 3(C)).

Gene silencing of DEK in U251 cells. (a) DEK mRNA expression. (b) DEK protein expression (M: molecular weight (bp); 1: blank control group; 2: negative control group; 3: siRNA-DEK group). (c) DEK mRNA and (d) protein expression level was normalized by β-actin level (“a”: compared with the siRNA-DEK group (p < 0.05)).
DEK protein expression was decreased in U251 cells after the siRNA treatment (Figure 3(B)). The relative level of DEK protein in the siRNA-DEK group (0.48 ± 0.08) was significantly lower than that in the negative control (0.92 ± 0.03) and in the blank control group (0.84 ± 0.08; all p < 0.05; Figure 3(D)).
We found that depletion of DEK changed U251 cell morphology. The cells in the negative control groups maintained good shape and numbers. The cells had transparent cytoplasm without particles, and adhered on the plates. In contrast, DEK siRNA–treated cells were detached from plates with increased cell debris. The cell transparency was reduced, with a lot of particles and vacuoles in cytoplasm (Figure 4(A)).

Effect of DEK gene silencing on U251 cell morphology, proliferation, and cell cycle. (a) U251 cell morphology at 48 h post transfection (200×). Negative control group (left panel) and siRNA-DEK group (right panel) are shown. (b) MTT assay for cell proliferation rate at 24, 48, and 72 h time points post transfection (“a”: compared with the siRNA-DEK group (p < 0.05)). (c) Cell cycle of U251 cells was analyzed with flow cytometry. (d) Bar plot of the percentage of the cells in G0/G1, S, and G2/M phases of cell cycle in each group.
Depletion of DEK inhibits cell proliferation and cell cycle progression
MTT assay indicated significantly reduced cell proliferation in the siRNA-DEK group compared with the negative control and the blank control groups after 24, 48, and 72 h of transfection. At 72 h time point, the cell optical density was 0.70 ± 0.06 for the siRNA-DEK, 0.83 ± 0.08 for the negative control, and 0.87 ± 0.07 for the blank control group (Figure 4(B)).
Cell cycle analysis by flow cytometry showed that the number of cells in S phase was markedly decreased, and the percentage of cells in G0/G1 and G2/M phases was dramatically increased in the siRNA-DEK group compared with the negative control and the blank control groups, respectively (p < 0.05). Consistently, the percentage of S phase cells in the siRNA-DEK group was significantly lower than the negative control and the blank control groups. Therefore, silencing DEK expression inhibits U251 proliferation and cell cycle progression and blocks cells in G0/G1 phase (Figure 4(C) and (D)), suggesting that DEK plays an essential role in U251 cell growth.
Depletion of DEK induces cell apoptosis
We next measured the cell apoptosis with flow cytometry and found that siRNA treatment significantly induced cell apoptotic rate in the siRNA-DEK group (Figure 5(A) and (B)). As a comparison, the negative control and the blank control groups did not show marked difference in cell apoptosis. Therefore, depletion of DEK in U251 cells led to reduced cell proliferation and increased apoptosis.
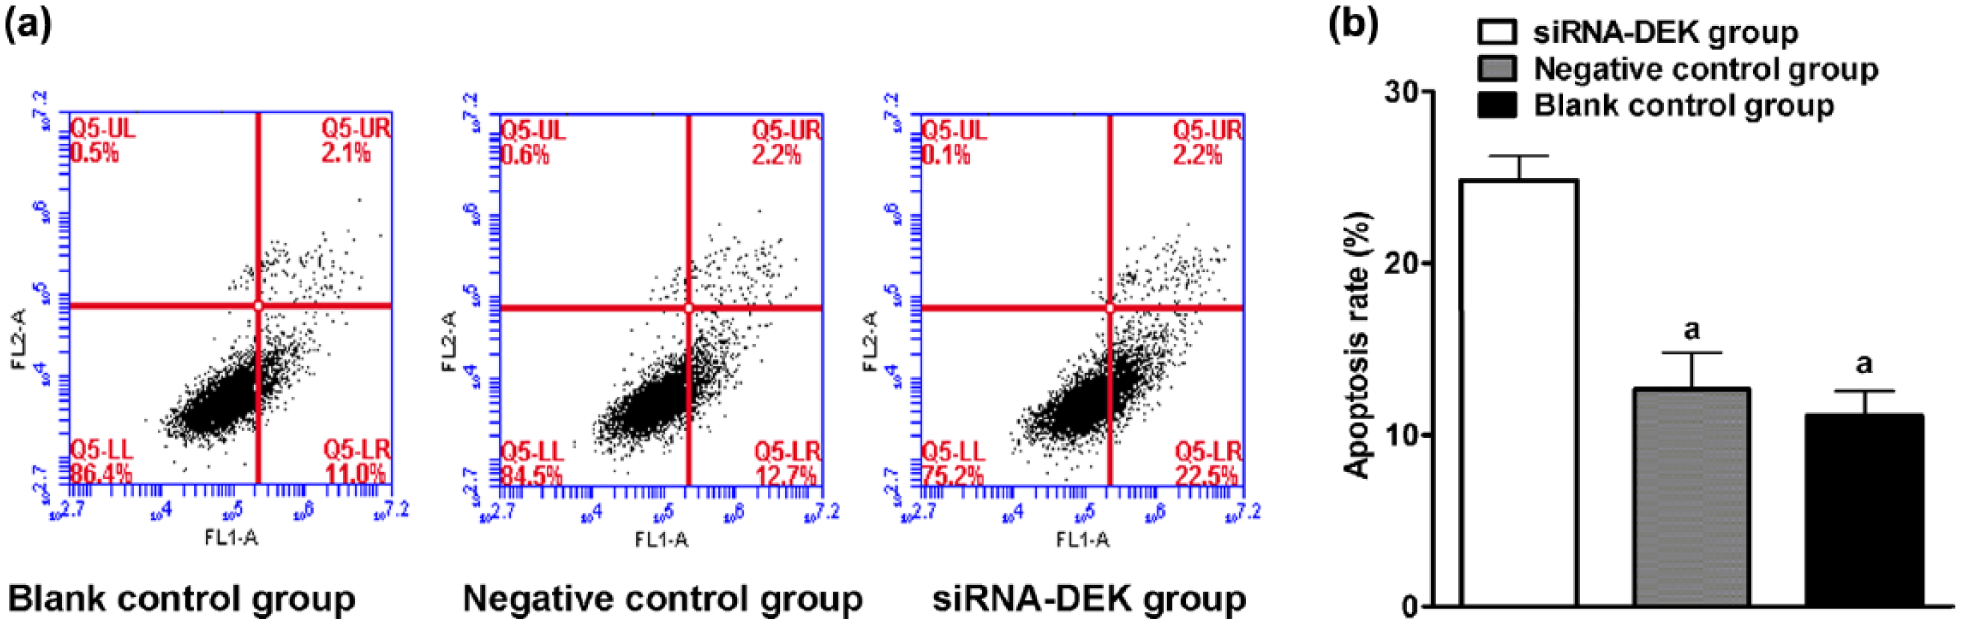
Effect of DEK gene silencing on U251 cell apoptosis. (a) Apoptosis of U251 cells was analyzed with flow cytometry. FITC was measured with FL-1 channel, and PI was measured with FL-2 channel. FITC positive–PI negative events were apoptotic cells. (b) Bar plot of cell apoptosis rate in each group (“a”: compared with the siRNA-DEK group (p < 0.05)).
Silencing DEK changed expression of p53, p21, BCL-2, and c-Myc proteins
We found that p53 and p21 proteins were significantly upregulated, while BCL-2 and c-Myc proteins were downregulated in the DEK siRNA–treated cells but not in the control cells (Figure 6(A)). The level of p53 and p21 proteins in the siRNA-DEK group was 0.87 ± 0.06 and 0.86 ± 0.09, respectively, which was significantly higher than the proteins in the negative control (0.46 ± 0.07 for p53 and 0.58 ± 0.07 for p21) and the blank (0.48 ± 0.09 for p53 and 0.55 ± 0.06 for p21) groups. The level of BCL-2 and c-Myc proteins in the siRNA-DEK group was 0.39 ± 0.04 and 0.41 ± 0.06, respectively, which was significantly lower than the proteins in the negative control (0.81 ± 0.07 for BCL-2 and 0.78 ± 0.10 for c-Myc) and the blank (0.84 ± 0.06 for BCL-2 and 0.76 ± 0.05 for c-Myc) groups. p53, p21, BCL-2, and c-Myc levels did not show dramatic difference between the negative control and the blank groups (Figure 6(B)).

Protein expression of p53, p21, BCL-2, and c-Myc in U251 cells after DEK gene silencing. (a) Detection of protein expression by western blotting (1: blank control group; 2: negative control group; 3: siRNA-DEK group). β-actin was used as a loading control. (b) Bar plots of the protein expression normalized by β-actin level (“a”: compared with the siRNA-DEK group (p < 0.05)).
Induction of Caspase-3 activity by DEK gene silencing
Caspase-3 is an inactive pro-enzyme, which is activated by proteolytic cleavage during apoptosis. As shown in Figure 7(A), the ratio of cleaved Caspase-3/pro-Caspase-3 in the siRNA-DEK group was significantly increased compared with the control groups (Figure 7(A)). In agreement, we found enhanced Caspase-3 activity in the DEK-depleted cells. The optical density of enzyme reactions measured in the siRNA-DEK, the negative control, and the blank groups was 0.57 ± 0.08, 0.34 ± 0.06, and 0.31 ± 0.07, respectively. It was significantly lower in the siRNA-DEK group, indicating that the activity of Caspase-3 in U251 cells was significantly induced after DEK silencing (Figure 7(B)), suggesting a potential regulatory role of DEK on Caspase-3 activation.

Induction of Caspase-3 cleavage and activity by DEK gene silencing. (a) Western blot analysis (top panel) and quantification (bottom panel) of Caspase-3 cleavage in U251 cells. Data in the bar plot are presented as mean ± SD (n = 3 in each group; “a”: compared with the siRNA-DEK group (p < 0.05)). (b) Caspase-3 activity in U251 cells after DEK gene silencing (“a”: compared with the siRNA-DEK group (p < 0.05)).
Discussion
The occurrence of astrocytic tumors is a complex process that involves many factors such as genes p53, p21, BCL-2, and c-Myc. Astrocytic tumors have high proliferation rate, strong angiogenesis, and anti-apoptosis properties, which make them difficult for efficient treatment. Identification of new therapeutic targets and invention of new therapies are important to overcome this lethal disease.
In this study, we provided compelling evidence that DEK is a potential target gene for the diagnosis and therapy of astrocytic tumors. Our results showed that depletion of DEK expression with short hairpin RNA (shRNA) led to tumor cell death. A study reported that DEK-knockout mice showed resistance to chemically induced papilloma formation, suggesting DEK has a role in promoting tumor formation. 22 Indeed, DEK gene is highly expressed in many cancer cells such as primary hepatocellular carcinoma (HCC), cervical cancers, colon cancer, larynx cancer, bladder cancer, and melanoma.18,23 In agreement with previous findings, we found that DEK mRNA and protein had high expression level in astrocytic tumors compared with normal brain tissues. The data indicated that the increase of DEK protein expression in astrocytic tumors is a consequence of upregulation of DEK mRNA transcription. We proposed that high level of DEK expression is positively correlated with cell proliferation and tumorigenesis. Rather than a consequence of tumor formation, its induction is closely related to tumor initiation.
DEK expression is associated with cancer progression and prognosis. High level of DEK is closely correlated with the tumor size, grade, metastasis, and patient survival.19,24,25 HCC patients with DEK expression showed a lower 5-year survival rate compared with the patients without DEK expression. 25 DEK overexpression is also associated with the poor prognosis of patients with high-grade neuroendocrine carcinoma. 19 Therefore, DEK overexpression can be an important factor that induces tumor progression from lower grade to higher grade. In this study, we found that DEK mRNA and protein had significant increased expression in the high-grade astrocytic tumors compared with the low-grade tumors, suggesting that DEK may play an important role in the progression of astrocytic tumors. High level of DEK may reflect the malignancy of astrocytic tumors. Our data indicated that DEK expression level could be used to facilitate the classification and monitor the progression of astrocytic tumors. DEK is a potential marker for early diagnosis of astrocytic tumors.
We found that silencing of DEK expression with siRNA in glioblastomas led to cell cycle arrest at G0/G1 phase and inhibition of cell proliferation. p53 and its target genes such as p21 are important cell cycle regulators. 26 Activation of p53 leads to cell cycle arrest in G0/G1 phase. 27 Therefore, increased expression of p53 and p21 after DEK silencing may account for the cell cycle change and reduced cell proliferation in glioblastomas. In addition, cell apoptosis rate was also significantly increased after gene silencing. It is known that DEK regulates apoptosis partly through modulating p53 by inhibiting its transcription activity and protein stability. Depletion of DEK was accompanied by the increased protein stability and transcriptional activity of p53, followed by upregulation of p21. 28 We also found that DEK silencing led to inhibition of BCL-2 gene expression and activation of Caspase-3, which are all regulated by p53,29,30 indicating that DEK regulates apoptosis through a p53-dependent pathway. Since DEK is functionally related to chromatin remodeling and transcription regulation, it may affect p53 pathway through modulation of chromatin activity or gene transcription. c-Myc expression was also significantly reduced after DEK depletion, suggesting DEK might activate c-Myc expression to promote cell transformation and tumorigenesis. It is plausible to speculate that DEK regulates cell cycle progression, cell growth, and apoptosis through modulating key genes such as p53, p21, BCL-2, c-Myc, and Caspase activities in astrocytic tumors.
In summary, DEK expression is dysregulated in astrocytic tumors. High level of DEK may inhibit p53 expression and activity, thereby reducing its downstream target p21 expression, and release the inhibitory effect of p21 on cyclin-dependent kinases (CDKs). Activation of CDKs will promote cell cycle progression and cell proliferation. On the contrary, induced expression of c-Myc by DEK will also contribute to the abnormal cell proliferation. Inhibition of p53 and BCL-2 expression and Caspase-3 activity by DEK reduces cell apoptosis. All these changes will eventually contribute to tumor formation.
Footnotes
Declaration of conflicting interests
The author(s) declared no potential conflicts of interest with respect to the research, authorship, and/or publication of this article.
Funding
The author(s) disclosed receipt of the following financial support for the research, authorship, and/or publication of this article: This study was supported by the Science and Technology Plan Project of Shenyang (F14-158-9-42).