
Abstract
Although gankyrin is involved in the tumorigenicity and metastasis of some malignancies, the role of gankyrin in gastric cancer is not clear. In this study, we evaluated the function and mechanism of gankyrin in gastric cancer. The effects of gankyrin on gastric cancer growth, proliferation, and chemosensitivity were determined. Gankyrin expression was significantly increased in gastric cancer compared to non-cancerous tissues. This expression significantly enhanced cancer cell proliferation and growth in vitro and in vivo. Suppression of gankyrin downregulated cyclin D1, cyclin E, proliferating cell nuclear antigen, phosphoinositide 3-kinase, AKT, p-PI3K, and p-AKT but upregulated Rb, p53, and p27. However, gankyrin overexpression led to opposite results. Downregulation of gankyrin expression enhanced chemosensitivity to 5-fluorouracil and cisplatin by inducing cell apoptosis. However, upregulation of gankyrin expression led to the opposite outcomes. Gankyrin enhanced gastric cancer cell proliferation by regulating cell cycle–related proteins and by activating PI3K/AKT signaling pathway. Gankyrin played an important role in gastric carcinogenesis and could be a potential effective therapeutic target for enhancing chemosensitivity to 5-fluorouracil and cisplatin.
Background
Gastric cancer (GC) is the most frequent malignancy occurring in Southeast Asia and is the third leading cause of cancer-related death in the world. 1 In spite of recent improvements in GC treatment, GC remains a heavy health burden due to tumor metastases and high recurrence rates. 2 Although recent studies have identified some associations of multiple genetic, epigenetic, and environmental factors with GC, the underlying molecular mechanisms that control the survival and colonization of tumor cells have not been clearly clarified. Despite considerable advances in surgery, neoadjuvant chemotherapy, radiation therapy, and targeted therapy, the prognosis of GC has not improved significantly in the past few decades. 3 Although a number of molecular pathways and genes have been reported to be associated with gastric carcinogenesis, it is still of vital importance to find new oncogenes and therapeutic targets to improve the treatment outcome of GC.
Gankyrin (standard nomenclature is PSMD10) is an important regulatory element for many proteins involved in Rb and p53 tumor suppressor pathways. Gankyrin, a small protein with seven ankyrin-repeat domains, was originally identified as a regulatory subunit of the 26S proteasome complex. 4 It was reported that gankyrin was considered as an oncoprotein that frequently overexpressed in human hepatocellular carcinoma (HCC) and increased in the earlier stage of liver carcinogenesis. Studies indicated that gankyrin was expressed in many eukaryotic cells, especially in malignant tumors, such as HCC, 4 cholangiocarcinoma, 5 colorectal cancer, 6 esophageal cancer, 7 and breast cancer. 8 Some studies reported that gankyrin negatively regulated some tumor suppressors, such as p53, Rb, and p27.9,10 Gankyrin could bind with cyclin-dependent kinase 4 (CDK4) and lead to the phosphorylation and degradation of Rb protein, hence resulting in cell cycle progression.9,10 Although gankyrin has been reported to be associated with tumorigenesis and progression of some malignant tumors, whether it contributes to the tumorigenesis of GC is not clear.
In this study, for the first time, we found that gankyrin was overexpressed in GC. The upregulation of gankyrin in GC increased cell proliferation and growth in vitro and promoted tumorigenesis in vivo. The results of our study indicated that gankyrin promoted cell cycle progression by regulating certain cell cycle effectors of GC. The downregulation of gankyrin in GC cells enhanced chemosensitivity to 5-fluorouracil (5-FU) and cisplatin through inducing apoptosis of cancer cells.
Materials and methods
Tissue collection
A total of 78 formalin-fixed, paraffin-embedded specimens of primary GC and matched adjacent non-cancerous tissues were collected from patients after surgery at our institute. The adjacent non-cancerous tissues and fresh tumors were stored at −70°C in a liquid nitrogen canister for further use. All tumor tissues were diagnosed as GC by the Department of Pathology at our institute. All patients signed their informed consent to use excess specimens for research purposes. All patients had not received chemotherapy or radiation therapy before surgery. This study was carried out in accordance with the basic principles for all medical research, the Helsinki Declaration. This study was approved by the institutional review board of our institute.
Immunohistochemistry
The expressions of gankyrin in GC and non-cancerous tissues were evaluated using an immunohistochemistry (IHC) method. An anti-human gankyrin polyclonal antibody was obtained from Santa Cruz Biotechnology (working dilution 1:50; Santa Cruz, CA, USA). All procedures were performed according to the manufacturer’s instructions. For negative controls, sections were treated with 0.01 mol/L phosphate-buffered saline (PBS) instead of primary antibodies. Two hundred cells from two selected representative fields of each section were counted by two independent observers for the determination of their immunostaining intensity.
Gankyrin expression was detected according to the ratio of positive cells per specimen and staining intensity. The ratio of positive cells per specimen was calculated quantitatively and scored as follows: 0, staining of ≤1%; 1, staining of 2%–25%; 2, staining of 26%–50%; 3, staining of 51%–75%; and 4, staining of >75% of examined cells. Staining intensity was divided into four groups: 0, no signal; 1, weak staining; 2, moderate staining; and 3, strong staining. A total score of 0–12 was determined as follows: total score = ratio of positively staining cells (score) × immunostaining intensity (score). Scores were graded as negative (−; score: 0), weak (+; score: 1–4), moderate (++; score: 5–8), or strong (+++; score: 9–12).
Cell culture
The human GC cell lines MGC-803, BGC-823, HGC-27, and SGC-7901 were obtained from the National Infrastructure of Cell Resource, China. MGC-803, BGC-823, and SGC-7901 cells were cultured in RPMI 1640 medium containing 10% fetal calf serum, 100 U/mL of penicillin, and 100 mg/mL of streptomycin. HGC-27 cells were maintained in Dulbecco’s Modified Eagle Medium (DMEM) containing 10% fetal calf serum, 100 U/mL of penicillin, and 100 mg/mL of streptomycin in a CO2 incubator. Cells were cultured at 37°C, 5% CO2 incubator.
Plasmid construction and cell transfection
We used the pGCsi-H1/Neo/GFP vector to construct human gankyrin-small interfering RNA (siRNA) vectors according to the manufacturer’s protocol. The first and second specific oligonucleotides targeting human gankyrin (5′-GCTGGAAGAGTTGAAGGAG-3′ and 5′-GGTGCTCAAGTGAATGCTG-3′) and the scrambled control sequence (5′-GATCCCCTTCTCCGAACGT-3′) were annealed and subcloned into the pGCsi-H1/Neo/GFP vector.
We used the pEGFP-N1 vector to construct human pEGFP-N1-gankyrin vectors according to the manufacturer’s protocol. The sequences were 5′-TTCTAAGCTTCATGGAGGGGTGTGTGTCTAA-3′ and 5′-ATCAGGATCCGTAACCTTCCACCATTCTCTT-3′. The vectors were purchased from Shanghai GenePharma Co., Ltd. (Shanghai, China). Cell transfection experiments were implemented with Lipofectamine 2000 (Invitrogen, Carlsbad, CA, USA). G418 (200 µg/mL) was used to select stably transfected clones. The transfected GC cell lines were named as siRNA-HGC-27, ctrl siRNA-HGC-27 (NC), pEGFP-N1-BGC-823 (vector), and pEGFP-N1-gankyrin-BGC-823, respectively.
Reverse transcription polymerase chain reaction
Total RNA was isolated using an RNAprep Pure Tissue Kit (Tiangen Biotech Co. Ltd, Beijing, China). First-strand complementary DNA (cDNA) synthesis was done using TIANScript RT Kit (Tiangen Biotech Co. Ltd). Primer sequences are listed in Table 1. Polymerase chain reaction (PCR) cycling parameters were as follows: at 95°C for 5 min for pre-denaturation, followed by 30 cycles at 95°C for 20 s, 60°C for 20 s, and 72°C for 30 s, and a final cycle at 72°C for 5 min for extension. Beta(β)-actin was used as an internal control. PCR products (10 µL) were analyzed electrophoretically using 2% agarose gel electrophoresis and viewed under ultraviolet (UV) light.
Oligonucleotide primer sets for RT-PCR.

PCNA: proliferating cell nuclear antigen.
Western blot
Proteins were separated by 12% sodium dodecyl sulfate (SDS)–polyacrylamide gel electrophoresis and transferred onto nitrocellulose membranes. The membranes were incubated with primary antibodies at 4°C overnight, including polyclonal antibodies against gankyrin (dilution 1:100; Santa Cruz Biotechnology), monoclonal antibodies against glyceraldehyde 3-phosphate dehydrogenase (GAPDH; dilution 1:4000; Santa Cruz Biotechnology), cyclin D1, proliferating cell nuclear antigen (PCNA), cyclin E (dilution 1:50; Santa Cruz Biotechnology), caspase3, caspase 9, p27 (dilution 1:500; Santa Cruz Biotechnology), Rb, p53, PI3K, p-PI3K, AKT, and p-AKT (dilution 1:400; Santa Cruz Biotechnology). Molecular Imager ChemiDoc XRS+ imager with image lab software (Bio-Rad Laboratories, Inc., USA) was used to visualize the intensity of bands according to the manufacturer’s instructions.
MTT assay
A methyl thiazolyl tetrazolium (MTT) assay was implemented according to the manufacturer’s instructions. Cells were plated in 96-well plates at 1 × 10³ cells per well. According to the MTT (Sigma-Aldrich, Shanghai, China.) incubation protocol, the cells were reconstituted in 150 µL of 100% dimethyl sulfoxide (DMSO), and absorbance values were determined at 490 nm using a 96-well plate reader (Dynex Technologies, USA).
Soft agar assay
A soft agar assay was implemented according to the manufacturer’s instructions. Briefly, cells were mixed with 0.3% agarose and plated onto a 0.5% agarose underlay (1 × 10⁴ cells per well in six-well plates). The number of foci >100 µm was calculated after 2 weeks. Each experiment was implemented three times.
Cell cycle analysis
Transfected and parental cells were cultured in 70%–80% confluent. Cells were washed with ice-cold PBS twice and then suspended in 1 mL of 70% alcohol at 4°C overnight. The DNA content of stained nuclei was detected using a flow cytometer (FACScan; Becton Dickinson, San Jose, CA, USA). Cell cycle analyses were implemented using MultiCycle software for cell cycle analyses.
The nude mouse tumor xenograft model
This study was conducted under the approval of the Institutional Animal Ethics Committee of China Medical University. Six-to-7-week-old male BALB/C nude mice were provided by Beijing Weitong Lihua Experimental Animal Technology Company. Six groups were injected into the right thoracic mammary fat pad with 1 × 10⁶ transfected cells and parental cells. Tumor sizes were gauged with vernier calipers every 3 days. All mice were killed 4 weeks after injection. Tumor volume was evaluated according to the following formula: 1/2 × L2 × W (L = tumor length and W = tumor width).
Hoechst 33258 staining
Cells were planted onto 12-well plates. After transfection, the cells were incubated with or without 5-FU and cisplatin for 48 h to induce apoptosis. For Hoechst 33258 staining, cells were washed with PBS for three times and then stained with 5 µL of Hoechst 33258 (10 µg/mL; Sigma) in 200 µL basal medium and incubated in dark at room temperature for 20 min. Stained cells were imaged under a fluorescent microscope with 485 nm excitation and 538 nm emission.
Flow cytometric analysis of apoptosis
Cells were fixed in 2% paraformaldehyde and then stained with Annexin V-FITC Apoptosis Detection Kit (Sigma–Aldrich, Shanghai, China). The proportion of apoptotic cells was detected using a flow cytometer (BD FACSCalibur; BD Biosciences, USA).
Statistical analysis
All statistical analyses were performed using GraphPad Prism version 5 (GraphPad Software, Inc., CA, USA) and SPSS 19.0 (SPSS, Chicago, IL, USA). Each experiment was implemented three times. The results are expressed as the mean ± standard deviation. One-way analysis of variance (ANOVA) or Dunnett’s test, followed by the Tukey’s post hoc test for data with multiple comparisons, was performed using SPSS 19.0. p-Values <0.05 were considered significant.
Results
Gankyrin expression was elevated in GC
Gankyrin expression was detected by IHC in 78 patients with primary GC. Gankyrin was mainly located in the cytoplasm and nuclei of cells (Figure 1). The normal gastric tissues showed weak gankyrin immunostaining (Figure 1(a)). The well-differentiated (Figure 1(b) and (c)), moderately differentiated (Figure 1(d) and (e)), and poorly differentiated exhibited positive gankyrin immunostaining (Figure 1(f)). Hematoxylin and eosin (H&E) staining was shown in normal gastric tissue (Figure 1(g)) and in GC tissue (Figure 1(h)). As shown in Table 2, gankyrin staining was positive in 78 (100.00%) GC tissue samples and 49 (62.82%) non-tumor tissue samples (p < 0.001). There was no significant difference between gankyrin expression (IHC) and tumor–node–metastasis (TNM) stage in GC (Table 3, p > 0.05).

Immunohistochemical and HE staining of gankyrin in gastric cancer and non-cancerous tissues. (a) Normal gastric tissues exhibiting weak gankyrin immunostaining. (b, c) Well-differentiated, (d, e) moderately differentiated, and (f) poorly differentiated gastric cancer tissues exhibiting positive gankyrin immunostaining; HE staining in (g) normal gastric tissue and (h) gastric cancer tissue (magnification of all figures ×400).
Immunohistochemical analysis of gankyrin expression in gastric cancer and non-cancerous tissues.

Relationship between gankyrin expression (IHC) and TNM stage in gastric cancer.

TNM: tumor–node–metastasis.
To further evaluate the difference in gankyrin expression between tumor and normal tissues, the gankyrin protein was detected in fresh GC and the non-cancerous tissues by western blot. As indicated in Figure 2(a) and (d), gankyrin was overexpressed in tumor tissues compared to non-cancerous tissues, which was coincident with the gankyrin expression detected by IHC.
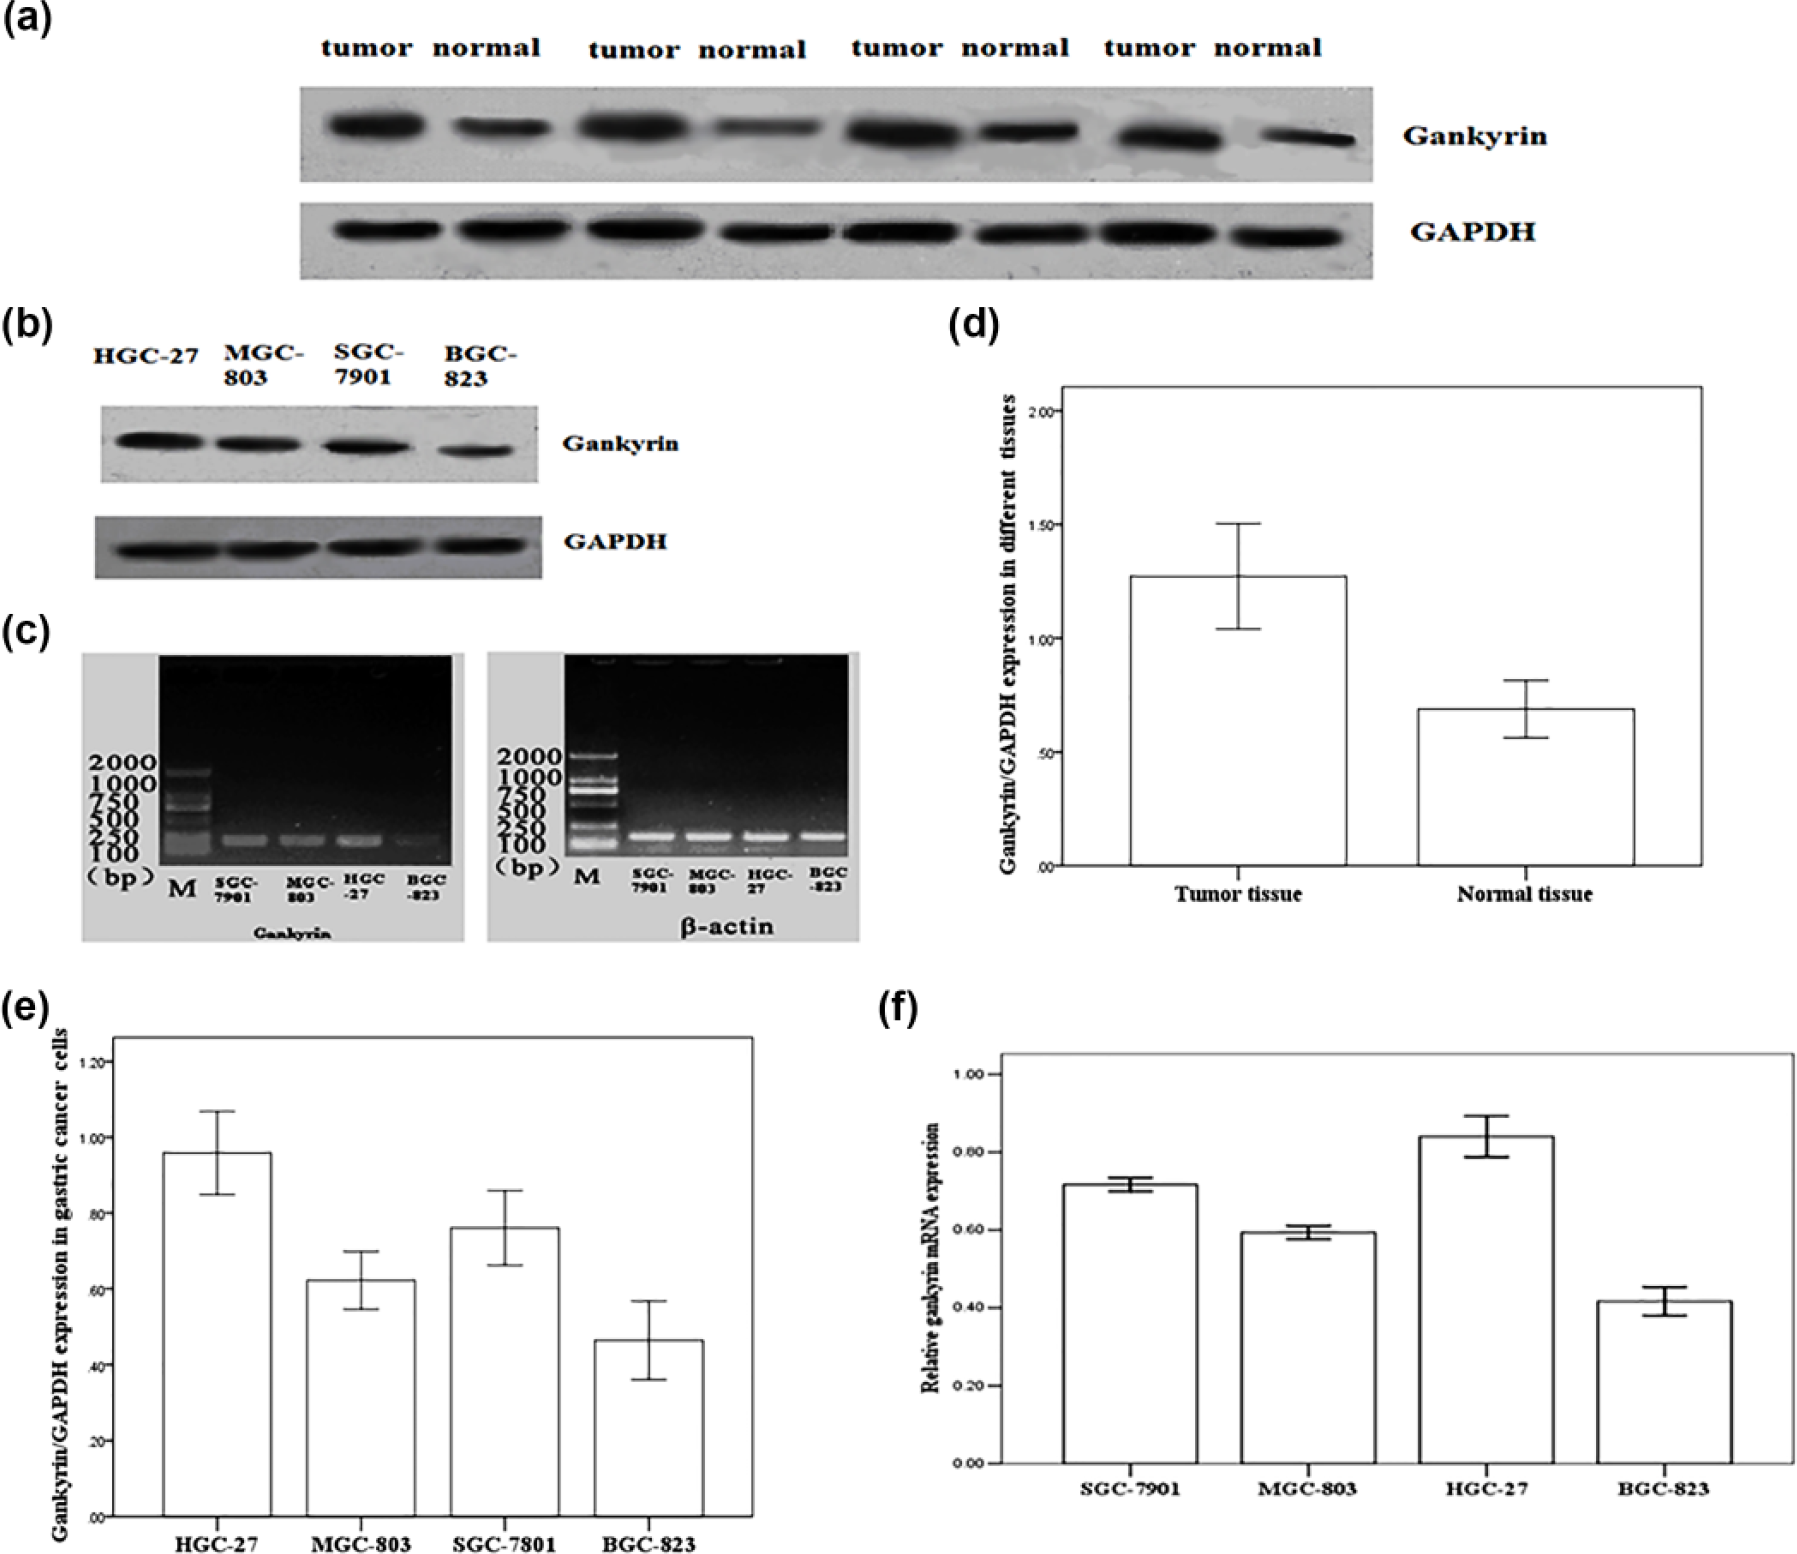
Gankyrin protein expression in gastric cancer tissues, matched non-cancerous counterparts, and gastric cancer cell lines. (a, d) Western blot analysis of the gankyrin protein in fresh gastric cancer tissue specimens (tumor) and the non-cancerous counterparts (normal). (b, e) Western blot analysis of gankyrin in the gastric cancer cell lines. (c, f) RT-PCR analysis of gankyrin mRNA expression in gastric cancer cell lines.
Gankyrin increased the growth and proliferation of GC cells in vitro
Gankyrin expression was detected in four GC cell lines (MGC-803, BGC-823, HGC-27, and SGC-7901). Gankyrin protein expression was lower in the BGC-823 cell line and higher in the HGC-27 cell line, which was examined by western blot (Figure 2(b) and (e)). Similarly, the results of gankyrin mRNA expression, as detected by reverse transcription (RT)-PCR, were consistent with the results detected using western blot (Figure 2(c) and (f)).
Cell transfection was used to investigate the effect of gankyrin expression in GC cells. HGC-27 cells, expressing higher baseline levels of gankyrin, were transfected with a gankyrin-siRNA vector. As shown in Figure 3(a1), HGC-27 cells were successfully transfected. Gankyrin expression was examined by western blot after cell transfection. Gankyrin-siRNA2 treatment significantly decreased the gankyrin expression in HGC-27 cells compared to a scrambled siRNA control (Figure 3(a2)). Stably transfected siRNA2-HGC-27 cells, designated as siRNA-HGC-27 cells, were used for further investigation by cell-based assays. The MTT results indicated that the proliferation rate of cells transfected with siRNA was significantly lower than that of parental cells or control cells (Figure 3(a3), p < 0.05). We used the soft agar assay to evaluate the effect of gankyrin on tumorigenic ability of HGC-27 cells in vitro. The results showed that downregulation of gankyrin inhibited the colony-forming ability of HGC-27 cells in soft agar (Figure 3(a4) and (a5), p < 0.01). In addition, the flow cytometry analysis showed that downregulation of gankyrin expression led to an increase in the number of cells in the G1 phase, whereas the number of cells in the S phase was decreased proportionally (Figure 3(a6)).

Gankyrin increased the proliferation of gastric cancer cells in vitro. (a1) Successful transfection of HGC-27 cells (magnification of all figures ×400). (b1) Successful transfection of BGC-823 cells. (a2) Western blot analysis of the gankyrin protein in HGC-27 cells. (b2) Western blot analysis of the gankyrin protein in BGC-823 cells. (a3) MTT assay of HGC-27 cells in vitro. (b3) MTT assay of BGC-823 cells in vitro. (a4, a5) Soft agar assay for HGC-27cells in vitro. (b4, b5) Soft agar assay for BGC-823 cells in vitro. (a6) Cell cycle analysis in HGC-27 cells in vitro. (b6) Cell cycle analysis in BGC-823 cells in vitro.
BGC-823 cells, with a lower basal expression level of gankyrin than other three GC cell lines, were transfected with a full-length human gankyrin vector (Figure 3(b1)). Western blot analysis indicated that the full-length human gankyrin vector significantly enhanced gankyrin expression in BGC-823 cells (Figure 3(b2)) after cell transfection. There was no significant difference in gankyrin protein expression level between control cells transfected with an empty vector and parental BGC-823 cells. The MTT assay showed that upregulation of gankyrin related to the proliferation rate of BGC-823 cells (Figure 3(b3), p < 0.05). The soft agar assay indicated that cells transfected with the pEGFP-N1-gankyrin vector had a significantly enhanced ability to form colonies in agar (Figure 3(b4) and Figure 3(b5), p < 0.01). With regard to cell cycle progression, upregulation of gankyrin expression led to a decrease in the number of cells in the G1 phase and an increase in the number of cells in the S phase (Figure 3(b6)).
Gankyrin increased the proliferation of GC cells in vivo
A subcutaneous tumor formation assay was performed in nude mice to evaluate the effect of gankyrin on proliferative ability in vivo. Transfected cells, parental cells, and control cells were injected into the right thoracic mammary fat pad. Tumor sizes were measured every 3 days for 4 weeks. The growth curve for siRNA-gankyrin HGC-27 cells was significantly lower than that for control cells (Figure 4(a), p < 0.05 on days 18–30). As shown in Figure 4(b) and (c), the tumor sizes were significantly smaller in siRNA-gankyrin HGC-27 cells compared to parental cells or control cells (Figure 4(b) and (c)). Conversely, the growth curve of pEGFP-N1-gankyrin-BGC-823 cells was significantly higher than that of parental cells or control cells (Figure 4(a), p < 0.05 on days 12–30). Moreover, injection of pEGFP-N1-gankyrin-BGC-823 cells caused a significant increase in tumor size compared to parental cells and control cells (Figure 4(b) and (c)).
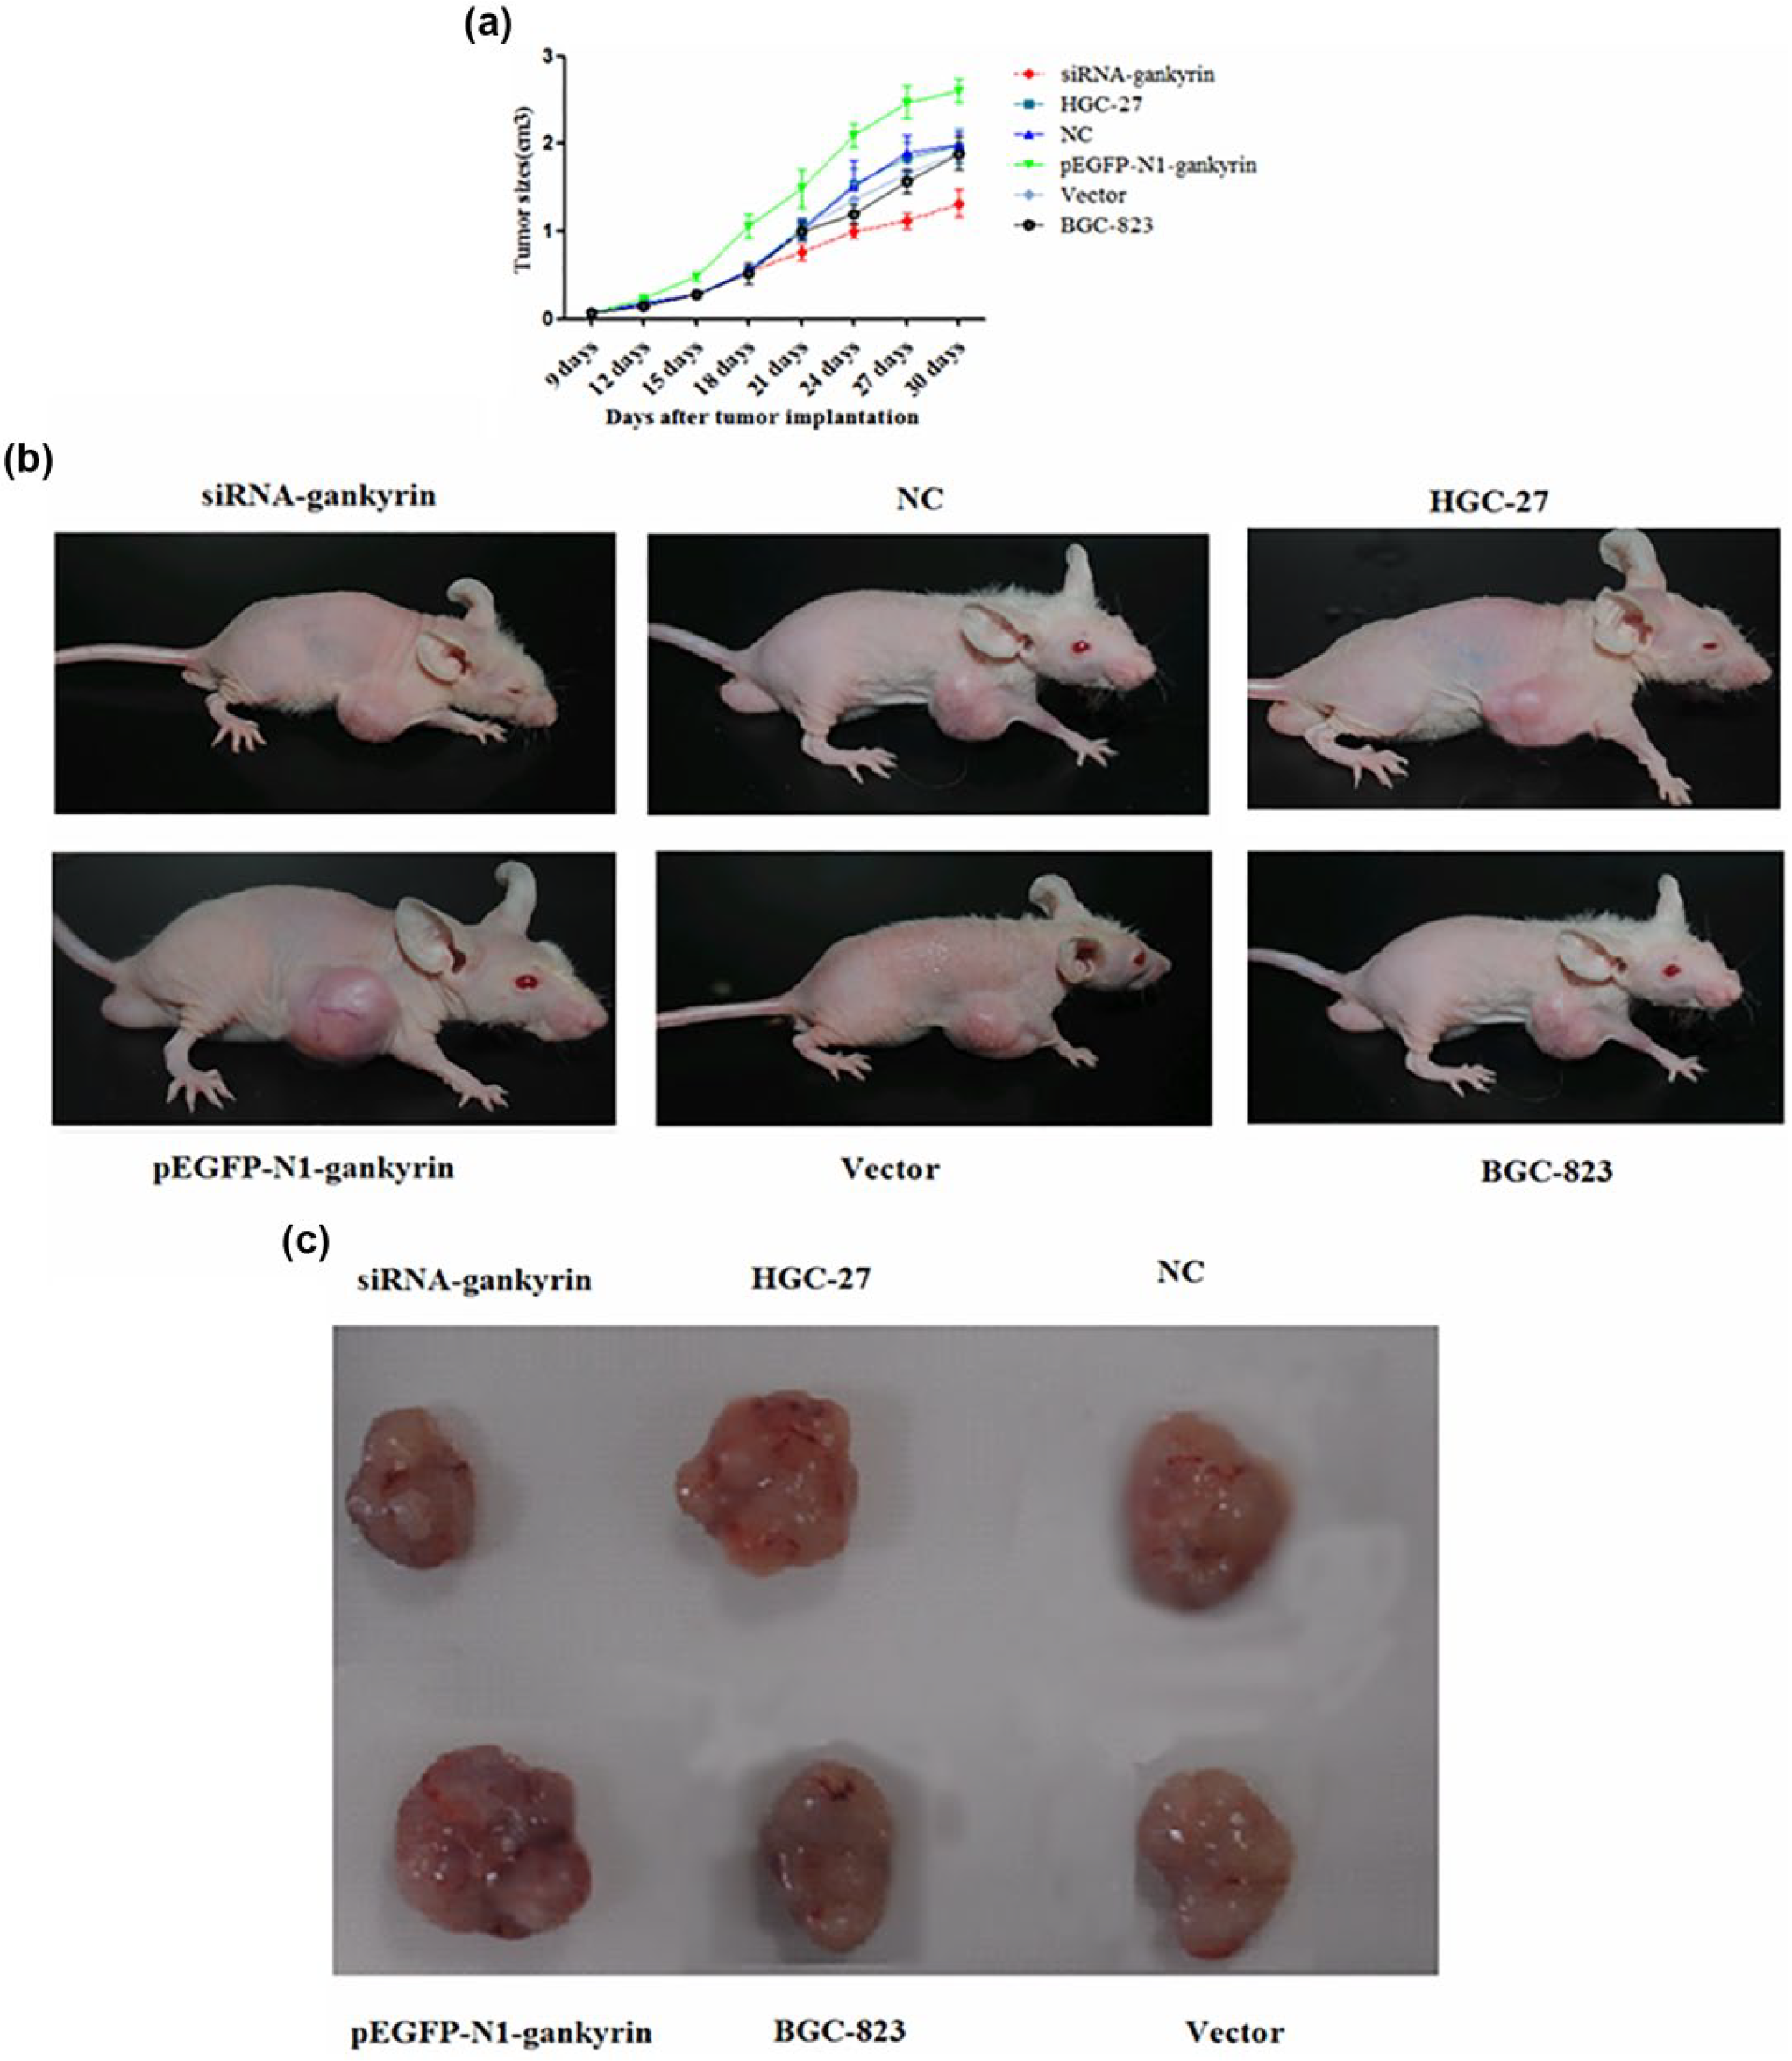
Gankyrin increased the proliferation of gastric cancer cells in vivo. (a) The tumor growth curve of transfected cells in nude mice. (b, c) Representative tumors formed by transfected cells in nude mice.
Gankyrin promoted cell cycle progression of GC cells by regulating cell cycle–related proteins and by activating PI3K/AKT signaling pathway
The above cell cycle analysis results (Figure 3) indicated that gankyrin could promote the progression of cells from the G1 phase to the S phase. To further analyze the molecular mechanism by which gankyrin promotes cell cycle progression, a RT-PCR and western blot analysis were performed to detect the expression changes in cell cycle–related genes. As shown in Figure 5((a1)–(f1) and (g)), our results indicated that the mRNA expression levels of cyclin D1, cyclin E, and PCNA were decreased in siRNA-gankyrin-HGC-27 cells, but the mRNA expression levels of Rb, p27, and p53 were increased compared to parental and control cells. As shown in Figure 5(a3)–(f3), these changes were confirmed by western blot. However, the trend was reversed in BGC-823 cells transfected with the full-length human gankyrin vector compared to parental and control cells. Moreover, the protein expression levels of PI3K/AKT signaling pathway, such as PI3K, AKT, p-PI3K, and p-AKT, were decreased in siRNA-gankyrin-HGC-27 cells, but increased in pEGFP-N1-gankyrin-BGC-823 cells (Figure 5(h) and (i)).

Gankyrin promoted cell cycle progression of gastric cancer by targeting cell cycle–related proteins and by activating PI3K/AKT signaling pathway. (a1, b1, c1, d1, e1, f1, a2, b2, c2, d2, e2, f2, g) RT-PCR analysis of cyclin D1, cyclin E, PCNA, Rb, p27, and p53. (a3, b3, c3, d3, e3, f3, h, i) Western blot analysis of cyclin D1, cyclin E, PCNA, Rb, p27, p53, PI3K, AKT, p-PI3K, and p-AKT. 1: siRNA-gankyrin-HGC-27 group, 2: NC, 3: HGC-27, 4: pEGFP-N1-gankyrin-BGC-823 group, 5: vector, 6: BGC-823.
Functions of gankyrin on chemosensitivity through regulation of the apoptosis of GC cells
Downregulation of gankyrin enhanced chemosensitivity of GC cells
After the treatment combined siRNA-gankyrin with 5-FU, the IC50 (half maximal inhibitory concentration) of 5-FU was 6.17 ± 0.20, 9.13 ± 0.21, and 8.93 ± 0.15 µg/mL for siRNA-gankyrin-HGC-27 group, NC group, and HGC-27 group, respectively. After the treatment combined siRNA-gankyrin with cisplatin, the IC50 of cisplatin was 0.97 ± 0.07, 1.32 ± 0.13, and 1.25 ± 0.09 µg/mL for siRNA-gankyrin-HGC-27 group, NC group and HGC-27 group, respectively.
The IC50 of siRNA-gankyrin-HGC-27 cells was significantly lower when compared with HGC-27 group and NC group (Figure 6(a), p < 0.05). These results indicated that siRNA-gankyrin treatment could enhance chemosensitivity to 5-FU and cisplatin in GC cells in vitro.

Functions of gankyrin on chemosensitivity through modulation of the apoptosis of gastric cancer cells. (a) IC50 was measured by MTT assay. (b1, b2) Hoechst 33258 staining was performed to detect the apoptotic morphology of HGC-27 cells (magnification of all figures ×400). (c1, c2) Hoechst 33258 staining was performed to detect the apoptotic morphology of BGC-823 cells. (d) Annexin V-FITC staining was performed to detect the apoptotic rate of HGC-27 cells. (e) The apoptotic rate of BGC-823 cells was measured by Annexin V-FITC staining. (f1, f2, g1, g2) Western blot analysis of caspase 3 and caspase 9 (1: siRNA-gankyrin + cisplatin/5-FU group, 2: NC + cisplatin/5-FU group, 3: siRNA-gankyrin group, 4: NC group, 5: HGC-27 group, 6: pEGFP-N1-gankyrin-BGC-823 + cisplatin/5-FU group, 7: vector + cisplatin/5-FU group, 8: pEGFP-N1-gankyrin group, 9: vector, 10: BGC-823). (f1, g1) Treated with cisplatin. (f2, g2) Treated with 5-FU.
We next tried to investigate whether the chemosensitivity-enhancing effect of siRNA-gankyrin in GC cells was due to the increase in apoptosis. Hoechst 33258 staining and Annexin V-FITC flow cytometric assay were performed to assess the apoptotic process in these cells. Hoechst 33258 staining revealed morphological features of apoptosis in siRNA-gankyrin-treated cells, including chromatin condensation and nuclear disintegration. Hoechst staining showed that siRNA-gankyrin obviously increased the apoptotic cells compared with the other control groups (Figure 6(b1) and (b2), p < 0.05). In Annexin V-FITC analysis, siRNA-gankyrin significantly promoted apoptosis of HGC-27 cells after treatment with 5-FU or cisplatin, when compared with the other control groups (Figure 6(d)). Furthermore, the protein expressions of caspase 3 and caspase 9 in siRNA-gankyrin cells after treatment with 5-FU or cisplatin were also significantly upregulated (Figure 6(f1), (f2), (g1), and (g2)), which were consistent with the above results.
Taken together, these results suggested that downregulation of gankyrin enhanced chemosensitivity to 5-FU and cisplatin through inducing cell apoptosis in GC cells.
Upregulation of gankyrin decreased chemosensitivity of GC cells
After the treatment combined pEGFP-N1-gankyrin with 5-FU, the IC50 of 5-FU was 18.60 ± 1.27, 12.23 ± 0.40, and 11.71 ± 0.66 µg/mL for pEGFP-N1-gankyrin-BGC-823 group, vector group, and BGC-823 group, respectively. After the treatment combined pEGFP-N1-gankyrin with cisplatin, the IC50 of cisplatin was 3.58 ± 0.32, 2.50 ± 0.09, and 2.38 ± 0.11 µg/mL for pEGFP-N1-gankyrin-BGC-823 group, vector group, and BGC-823 group, respectively.
The IC50 of pEGFP-N1-gankyrin-BGC-823 cells was significantly higher when compared with BGC-823 group and vector group (Figure 6(a), p < 0.05). These results indicated that pEGFP-N1-gankyrin treatment reduced chemosensitivity to 5-FU and cisplatin in GC cells in vitro. Hoechst staining indicated that pEGFP-N1-gankyrin obviously decreased the apoptotic cells compared with the other control groups (Figure 6(c1) and (c2), p < 0.05). In Annexin V-FITC analysis, pEGFP-N1-gankyrin significantly inhibited apoptosis of BGC-823 cells after treatment with 5-FU or cisplatin, when compared with the other control groups (Figure 6(e)). Furthermore, the protein expressions of caspase 3 and caspase 9 in pEGFP-N1-gankyrin cells after treatment with 5-FU or cisplatin were also significantly downregulated (Figure 6(f1), (f2), (g1), and (g2)).
Discussion
GC is a major global health threat. Patients with advanced-stage disease require multiple-modality treatments. Despite considerable advances in surgery, neoadjuvant chemotherapy, radiation therapy, and preoperative treatment, GC remains a clinical challenge due to the invasive features and high proliferation of GC cells. 11 Although some molecular pathways and genes have been identified as being involved in gastric carcinogenesis, further studies are required to find new markers for therapeutic targets and early diagnosis. Studies reported that gankyrin played an important role in tumorigenesis in HCC, esophageal squamous cell carcinoma, and colorectal cancer.3,6,7 Some studies reported that gankyrin was associated with multi-drug resistance in HCC and non-small-cell lung cancer.12,13
In this study, we investigated the relationship between gankyrin and gastric carcinogenesis. The results (Figure 1) indicated that gankyrin expression was significantly higher in GC tissues than in non-cancerous tissues. Gankyrin expression was detected (Figure 2) in four GC cells (MGC-803, BGC-823, HGC-27, and SGC-7901). These findings showed that gankyrin might play an important role in gastric carcinogenesis. Subsequent biological experiments (Figure 3) and nude mouse experiment (Figure 4) suggested that gankyrin promoted cell proliferation and growth in vitro and in vivo. After downregulation or upregulation of gankyrin expression, the results indicated that gankyrin enhanced GC cell proliferation by promoting G1/S progression in vitro. Therefore, gankyrin played an important role in gastric carcinogenesis.
To analyze the possible mechanism through which gankyrin promoted GC cell cycle progression, the expression levels of cell cycle–related proteins and PI3K/AKT pathway–related proteins in transfected cells, parental cells, and control cells were detected by western blot (Figure 5). As is known to all, p53 is a tumor suppressor that regulates a great number of genes in response to oncogene activation and DNA damage. Low levels of stress or DNA damage could enhance the level of p53 necessary for the maintenance of G1 arrest. 14 As a negative regulator of Rb and p53, gankyrin played a key role in tumorigenesis. After binding to MDM2, gankyrin negatively modulated p53 by increasing proteasomal degradation.15,16 The results of our study suggested that downregulation of gankyrin promoted p53 expression, which suppresses cell cycle progression. To detect the cell cycle–related proteins and PI3K/AKT pathway–related proteins, cyclin D1, cyclin E, PCNA, Rb, p27, p53, PI3K, AKT, p-PI3K, and p-AKT were analyzed. The CDK4/cyclin D1/PCNA complex had been reported to induce Rb phosphorylation in the G1-to-S phase transition.17,18 Studies reported that cyclin E/CDK2 phosphorylated Rb to promote G1 progression.19,20 P27 is a member of the Cip/Kip family of CDK inhibitors that suppress the cyclin D1–CDK4 complex and cyclin E–CDK2 complex and regulate the G1-to-S transition. 21 Our study indicated that downregulation of gankyrin induced cell cycle arrest in the G1-to-S transition and inhibited cell cycle progression by decreasing cyclin E, cyclin D1, and PCNA expression and increasing Rb, p53, and p27 expression, whereas upregulation of gankyrin led to the converse results. Moreover, our study showed that downregulation of gankyrin decreased the expression levels of PI3K/AKT pathway–related proteins, such as PI3K, p-PI3K, AKT, and p-AKT, whereas upregulation of gankyrin led to the opposite outcomes. Taken together, our study indicated that gankyrin promoted GC cell proliferation by modulating cell cycle–related proteins and activating PI3K/AKT signaling pathway. 22
The relationship between gankyrin and chemosensitivity was also evaluated in this study. The results showed that downregulation of gankyrin enhanced chemosensitivity to 5-FU and cisplatin in gastric cancer cells, whereas upregulation of gankyrin led to the opposite results (Figure 6).
To investigate the possible mechanism by which gankyrin affects chemosensitivity of GC cells, subsequent biological experiments (MTT, Hoechst staining, Annexin V-FITC assay, and western blot) indicated that downregulation of gankyrin enhanced chemosensitivity to 5-FU and cisplatin through inducing cell apoptosis, whereas upregulation of gankyrin decreased chemosensitivity through inhibition of cell apoptosis.23,24
In conclusion, gankyrin overexpression in GC was associated with tumorigenesis. Downregulation of gankyrin expression significantly suppressed cancer cell proliferation in vitro and in vivo. Downregulation of gankyrin expression enhanced chemosensitivity to 5-FU and cisplatin. However, upregulation of gankyrin expression led to the opposite outcomes. The results of this study indicated that gankyrin played an important role in gastric carcinogenesis by promoting cell cycle progression and by activating PI3K/AKT signaling pathway. Gankyrin could be considered as a novel cancer therapeutic target for enhancing chemosensitivity to 5-FU and cisplatin.
Footnotes
Declaration of conflicting interests
The author(s) declared no potential conflicts of interest with respect to the research, authorship, and/or publication of this article.
Funding
The author(s) disclosed receipt of the following financial support for the research, authorship, and/or publication of this article: This work was supported by the National Natural Science Foundation of China (nos 81071650 and 81201803).
Open access
This article is distributed under the terms of the Creative Commons Attribution License which permits any use, distribution, and reproduction in any medium, provided the original author(s) and the source are credited.