
Abstract
This study aimed to analyze the expression of microRNAs in relation to p53 status in breast cancer cells and to delineate the role of Moesin in this axis. We used three isogenic breast carcinoma cell lines MCF7 (with wild-type p53), 1001 (MCF7 with mutated p53), and MCF7-E6 (MCF7 in which p53 function was disrupted). MicroRNA expression was analyzed using microarray analysis and confirmed by real-time polymerase chain reaction. The 1001 clone with mutant p53 showed 22 upregulated and 25 downregulated microRNAs. The predicted targets of these 47 microRNAs were >700 human genes belonging to interesting functional groups such as stem cell development and maintenance. The most significantly downregulated microRNAs in the p53-mutant cell line were from the miR-200 family. We focused on miR-200c which targets many transcripts involved in epithelial-to-mesenchymal transition including Moesin. We found that Moesin was expressed in 1001 but not in its p53 wild-type parental MCF7 consistent with the observed mesenchymal features in the 1001, such as vimentin positivity, E-cadherin negativity, and ZEB1 positivity in addition to the morphological changes. After Moesin silencing, the p53-mutant cells 1001 reverted from mesenchymal-to-epithelial phenotype and showed subtle reduction in migration and invasion and loss of ZEB1 and SNAIL expression. Interestingly, Moesin silencing restored the 1001 sensitivity to Doxorubicin. These results indicate that loss of miR-200c, as a consequence of p53 mutation, can upregulate Moesin oncogene and thus promote carcinogenesis. Moesin may play a role in metastasis and drug resistance of breast cancer.
Introduction
Tumor suppressor protein p53 is the most significant tumor suppressor protein in the cell. The gene encoding p53 protein (TP53 gene) was found to be mutated in up to 50% of human solid tumors. Various types of cellular stress and DNA damage stabilize p53 protein which, in turn, regulates essential cellular responses related to DNA damage such as cell-cycle arrest, repair, senescence, or apoptosis. p53 carries out these functions by acting as a transcriptional factor and through inducing the expression of microRNAs (miRNAs).1–4 The latter are short (20–25 nucleotide long) endogenously expressed, non-coding RNAs. They regulate the expression of about 30% of the known genes by binding to and degrading their target messenger RNAs (mRNAs) through incomplete complementary binding. In consequence, miRNAs control many critical cellular functions such as apoptosis, cell proliferation, growth suppression, and senescence.3,4
In the early phase of this work, we addressed the effect of p53 status on the miRNA profile in a breast cancer cell line model including two isogenic cell lines: one p53 wild-type (MCF7) and the other is p53 mutated (1001). 1001 clone cells express cancer stem cell–like markers, exhibit epithelial-to-mesenchymal transition (EMT)-like features, and perform autophagy, which are features associated with advanced malignancy.5,6 Using microRNA expression profiling, we found that miRNA expression was significantly altered according to p53 status, where 47 miRNAs were dysregulated in the p53-mutant cell line. The two most significantly downregulated miRNAs were miR-141 and miR-200c. We focused on miR-200c as miRNA 200 family plays an important role in EMT.4,7,8 There are five members of the miR-200 family of microRNAs, located in two clusters on chromosome 1 (miR-200a, miR-200b, and miR-429) and on chromosome 12 (miR-141 and miR-200c).9,10 It is well established that miR-200c targets a group of genes which play a role in EMT such as ZEB1 and ZEB2. A double-negative feedback loop operates between ZEB family of transcription factors and the miR-200 family to regulate EMT in different cell systems, including breast cancer cells. 7 More recent data from mouse breast cancer cells showed that miR-200c suppressed transforming growth factor-β (TGF-β)/bone morphogenetic protein (BMP) signaling, promoted epithelial gene expression, and suppressed cell invasion by regulating a wide array of genes including Crtap, Fhod1, Smad2, Map3k1, Tob1, Ywhag/14-3-3γ, Ywhab/14-3-3β, Smad5, Zfp36, Xbp1, Mapk12, and Snail. 8 In clinical samples, comparison of miRNA microarray signature of 43 primary epithelial cancers from colon, bladder, breast, and lung to their matched lymph node metastases revealed that miR-200c and other miR-200 family members were downregulated in metastases compared to primary tumors, which suggested that these specific miRNAs could be directly involved in cancer metastasis. 11 Additionally, miR-200c was associated with chemosensitivity and metastasis of claudin-low breast cancer 9 and colorectal cancer 12 and was also associated with osteosarcoma progression and its lung metastasis. 13
Moesin (for membrane-organizing extension spike protein) is another interesting target of miR-200c that may be involved in EMT. Moesin is a 68-kDa protein with 577 amino acids encoded by the MSN (Hel70, IMD50) gene located on chromosome Xq12 in humans. Moesin is a member of the ERM (Ezrin, Radixin, and Moesin) protein family. These proteins act as cross linkers between plasma membranes and actin-based cytoskeleton.14–16 The gene sequence for MSN neither contains a signal sequence nor a transmembrane domain. This sequence suggests that it is not incorporated into the plasma membrane in the classical way. Moesin amino acid sequence shares sequence identity with three other proteins: 72% with Ezrin 37% with an N-terminal region of band 4.1 (erythrocyte membrane protein band 4.1 (EPB41)) and 23% with talin. The structural relationship with these three cytoskeletal proteins suggests that Moesin is a cytoskeletal component. Moesin is localized near or at the plasma membrane and is involved in basic cellular processes like cell recognition, motility, invasion, differentiation, and cell growth. Moesin is expressed in initial filopodia of migrating cells preceding actin polymerization.14–16 Moesin was found to be associated with the EMT phenotype and was required for cytoskeletal remodeling in mammary epithelial cells 17 and was also required for invasion and lung metastasis by melanoma cells. 18 Moesin mRNA expression was associated with expression of other EMT genes in breast cancer cells. 19 Moesin protein expression in clinical breast cancer specimens was remarkably higher in those subtypes of breast cancer with poor outcome including the triple-negative, basal, and metaplastic (spindle cell carcinoma/carcinosarcoma) subtypes compared to other subtypes.19,20 Conversely, Moesin was associated with the node-negative (non-metastatic) breast carcinomas and was proposed as a marker for selecting patients who should not receive aggressive adjuvant chemotherapy. 21 Therefore, we set out to elucidate the role of Moesin in breast cancer.
The aims of this study are to address the effect of p53 status on the miRNA profile in breast cancer and to analyze the role of the target gene Moesin in carcinogenesis and response to therapy.
Materials and methods
Cell lines and cell culture
We used three isogenic breast carcinoma cell lines MCF7 (wild-type p53), 1001 (MCF7 with mutated p53),2,22,23 and MCF-E6 (MCF7-p53-knockout clone in which p53 function was disrupted by transfection with the human papilloma virus type-16 E6 gene). 24 MCF7 cell line was first isolated in 1970 from malignant metastatic pleural effusion of a woman having breast adenocarcinoma. It retains several ideal characteristics particular to the mammary epithelium, for example, positivity for estrogen receptors (ER) and cytokeratin and non-reactive to desmin and vimentin (mesenchymal markers). When grown in vitro, MCF7 is capable of forming domes and appears like epithelial cells that grow in monolayers with doubling time of 38 h. MCF7 had a wild-type p53 gene sequence (American Type Culture Collection (ATCC, Manassas, VA, USA)). Subclone 1001 was established from tumor necrosis factor (TNF)-resistant clone of the parental MCF7 (RA-1) as previously described 23 and it acquired TP53 mutation (R280K) as confirmed by DNA sequencing. 2 HeLa cell line was isolated from adenocarcinoma of the uterine cervix in which p53 expression was reported to be low, but it expressed twist and vimentin and have been proposed as a positive control for these antibodies and for EMT phenotype (ATCC). The cell lines were generously provided by Professor Salem Chouaib (Institut National de la Santé et de la Recherche Médicale, University of Paris-Sud and Université Paris-Saclay, France) and were cultured in RPMI 1640 supplemented with 10% fetal calf serum, 1 mM sodium pyruvate, and 1× penicillin and streptomycin (Sigma-Aldrich, St. Louis, MO, USA). All cells were maintained at 37°C in a humidified 5% CO2 incubator and were split when their confluency reached 90% according to supplier instructions.
MicroRNA microarray analysis
High-quality RNA was extracted by the TRIzol solution according to supplier’s protocol (Thermo Fisher Scientific, Waltham, MA, USA). Total RNA was quantified using the NanoDrop 1000 spectrophotometer (Thermo Fisher Scientific) and concentrations were adjusted to 100 ng/µL and submitted to miRNA microarray in duplicates, using the Agilent 8x60K v16 chips.
MicroRNA microarray profiling
The miRNA Microarray System with miRNA Complete Labeling and Hybridization Kit (Agilent Technologies, Santa Clara, CA, USA) was used according to the manufacturer’s recommended protocol. The input for the Agilent miRNA labeling system was 100 ng total RNA. All samples were dephosphorylated by incubation with calf intestinal phosphatase (CIP) at 37°C in a heat block for 30 min and incubated in 100% dimethyl sulfoxide (DMSO) at 100°C for 7 min for denaturation. All samples were labeled with pCp-Cy3 using T4 ligase by incubation at 16°C for 2 h. Micro Bio-Spin 6 chromatography columns (Bio-Rad Laboratories, Hercules, CA, USA) were used for purification of the labeled RNA. After complete drying, the samples were prepared for hybridization by adding nuclease-free water, Hyb Spike-In solution, 10× GE Blocking Agent, and 2× Hi-RPM Hybridization Buffer. Samples were hybridized to a custom-designed 8x60k v16.0 Agilent microarray for 20 h. The custom microarray covered miRNAs from miRBASE version 16.0. Hybridizations were performed in hybridization chambers (Agilent Technologies) for 20 h at 55°C and the slides were washed using 2 mL of 10% Triton X-102 at 40°C. Arrays were scanned at a resolution of 5 μm using an Agilent Scanner.
Quantitative real-time polymerase chain reaction
Total RNA extraction for quantitative real-time polymerase chain reaction (qRT-PCR) was done using Norgen RNA/DNA/Protein Purification kit according to the provided protocol (Norgen Biotek Corp., Thorold, ON, Canada). Reverse transcription of RNA to acquire complementary DNA (cDNA) was done using GoScript Reverse Transcription System Kit according to the supplier’s protocol (Promega, Fitchburg, WI, USA). A total of 5 μL mixture was made (RNA = 5 μg/reaction, Primer Oligo (dT)15 = 0.5 μg/reaction, nuclease-free water). The mixture was incubated at 70°C for 5 min, immediately cooled using ice for 5 min, and centrifuged for 10 s. A volume of 15 μL of reverse transcription mix/cDNA reaction was prepared (GoScript 5× Reaction Buffer = 4.0 μL, MgCl2 1.5–5 mM = 4.0 μL, PCR nucleotide mix = 1.0 μL, Recombinant RNAs in Ribonuclease Inhibitor 20 units, and GoScript Reverse Transcriptase = 1.0 μL; completed the volume with nuclease-free water). This was then mixed with 5 μL of RNA-primer mix. Annealing was done in a block at 25°C for 5 min and extended in a heat block at 42°C for 1 h. The cDNA was estimated by NanoDrop machine and its concentration was adjusted to 100 ng/reaction. For PCR, QuantiTect SYBR Green PCR Kit and QuantiTect Primer Assay (Hs_MSN_1_SG; QIAGEN, Hilden, Germany) were used. Reaction was set up for two-step RT-PCR. A total of 50 μL mix was prepared for each reaction (25 μL of master mix, 5 μL of primer assay, cDNA 100 ng, and RNase-free water to complete volume).
Total protein extraction and western blot analysis
Cell lysates were made using radioimmunoprecipitation assay (RIPA) buffer (150 mM NaCl; 1% NP-40; 0.5% deoxycholic acid; 0.1% sodium dodecyl sulfate (SDS); 50 mM Tris-HCl pH 7.6; and 1× protease/phosphatase inhibitors (Cell Signaling Technology, Danvers, MA, USA)). Protein concentration was quantified using the bicinchoninic acid (BCA) protein assay (Thermo Fisher Scientific). Approximately 30 µg of total protein was subjected to sodium dodecyl sulfate–polyacrylamide gel electrophoresis (SDS-PAGE; 7.5% resolving gel and 4% stacking gel). The gel, with the separated proteins, was transferred to a polyvinylidene difluoride (PVDF) membrane (Bio-Rad Laboratories) using a Trans-Blot® TurboTM Blotting System (Bio-Rad Laboratories) according to the standard transfer protocol. The membrane was blocked for 1 h at room temperature using 5% non-fat dry milk (Sigma-Aldrich) in 1× Tris-buffered saline with Tween 20 (TBST; TBS + 1% Tween), followed by incubation with the primary antibody overnight at 4°C on a shaker. The primary antibody against Moesin (clone Q480, rabbit polyclonal; Cell Signaling Technology) was diluted in the ratio of 1:1000. Other antibodies were against p53 (clone DO-1, mouse monoclonal; Santa Cruz), E-cadherin (clone 24E10, rabbit monoclonal antibody; Cell Signaling Technology), vimentin (rabbit polyclonal, clone R28E; Cell Signaling Technology), CD44 (clone 156-3C11, mouse monoclonal; Cell Signaling Technology), ZEB1 (CAI12550, rabbit polyclonal; Abcam), Snail (rabbit polyclonal, clone C15D3; Cell Signaling Technology), and Beta-actin (clone 13E5, rabbit monoclonal; Cell Signaling Technology). Primary antibodies were used at 1:1000 or at recommended dilutions by suppliers. Next, the membrane was washed with 1× TBST three times for 10 min each. Then, it was incubated with horseradish peroxidase (HRP)–labeled secondary antibody for 1 h at room temperature (anti-rabbit IgG HRP-linked antibody at dilution of 1:2000; Cell Signaling Technology). After washing with 1× TBST for 10 min three times, the HRP-labeled membrane was incubated with substrate (Pierce™ ECL Western Blotting Substrate, Thermo Fisher Scientific, Waltham, MA, USA) for 1 min, exposed to film (Kodak Cl-XPosure TM Film; catalog No: 34090; Thermo Fisher Scientific), developed, and fixed. Pictures were then evaluated and scanned.
Gene silencing by siRNA interference
Transfection was done according to Thermo Fisher Scientific protocol for “forward-transfections-lipofectamine” available from https://www.thermofisher.com/. For Moesin, silencing two validated siRNAs, Hs_MSN_5 and siRNA_MSN_8 (FlexiTube siRNA20nmol; QIAGEN) were used. For Anti-miR and Pre-miR transfection, siRNAs from Ambion (Life Technologies) were used. All siRNAs were reconstituted at 50 μM concentration. After 24 h of the first transfection, the same procedure was repeated for second transfection. Cells were collected or lysed for further analysis 48 h after second transfection.
Immunofluorescence actin staining and confocal microscopy
Cells transfected with silencer or control siRNA and siRNAs Hs_MSN_5 and siRNA_MSN_8 were grown on glass cover slips in six-well plates and incubated at 37°C for 24 h until they reached 30%–40% confluency. Media were discarded and cells were washed gently with 1× phosphate-buffered saline (PBS). Cells were then fixed with 4% paraformaldehyde (PFA) for 30 min at room temperature. PFA was discarded and permeabilization was done by adding 0.1% Triton and incubating at room temperature for 30 min. Blocking was done with 10% fetal bovine serum (FBS) and cells were incubated at room temperature for 30 min. Then, fluorescently labeled phalloidin, Rhodamine phalloidin (0.13 U/mL; F-actin probe conjugated to the red-orange fluorescent dye, tetramethylrhodaminne), was added to the cells in six-well plates, incubated at room temperature for 1 h in a dark room, and washed three times with 1× PBS. Then, the cover slips were removed carefully and mounted onto the glass slides and sealed with colorless nail polish and allowed to dry. The cell morphology was analyzed using confocal immunofluorescence microscopy.
Invasion assay
For the invasion assay, we used QCMTM High Sensitivity Non-cross-linked Collagen Invasion Assay kits, available from Millipore (Billerica, MA, USA), and followed the supplied manufacturer protocol. Briefly, the assay was performed using a modified chamber with filter inserts (pore size 8 μm) coated with Matrigel in 24-well dishes. Approximately 0.5 million cells were prepared in serum-free media (RPMI 1640). In all, 250 µL of the cell suspension was added into the inserts (top chamber) and 500 μL of 15% FBS-containing media was added to the bottom chamber. After 48-h incubation, cells remaining in the top chamber were removed and 400 μL of cell stain was applied to the invasion chamber insert for 15 min. After several washes with water, the inserts were dried, viewed under the microscope, and photographed. Inserts were then transferred into 200 μL of extraction buffer and allowed to incubate for 15 min at room temperature. The dye mixture was then assessed by a plate reader at a wavelength of 630 nm.
Wound-healing assay
Cells were cultured in six-well plates until they reached absolute confluency. Two parallel lines were drawn by a marker at the bottom of the well to present the wound mark. Media were aspirated and cells were washed twice with 1× calcium-free PBS. A wound was made using P10 pipette tip, then washed again with calcium-free PBS, and re-incubated with fresh media at 37°C. Wound was estimated in 8-h intervals.
Drug treatment and sulforhodamine B assay
The IC50 concentration of drugs used in the experiments was prepared by serial dilution in Dulbecco’s Modified Eagle’s Medium (DMEM) prior to performing the experiment. The IC50 concentrations were retrieved from previously published literature.25–27 The highest DMSO concentration did not exceed 1% for drugs dissolved in DMSO. The cytotoxicity of the drugs was determined using the sulforhodamine B (SRB) method as we described earlier. 28
Results
Western blot analysis confirmed p53 status in the cell lines
MCF7, the breast cancer cell line with wild-type p53, showed no detectable protein expression on western blot as expected because wild-type p53 is regularly degraded. However, the 1001 subclone which has mutated p53 showed an intense p53 staining proving that the point-mutation (R280K) in p53 prevents its degradation and is therefore stabilized and abundant in the cell line though not functional. MCF7/E6, which is the third isogenic sub-line of MCF7 that has knocked out p53, showed no p53 protein as expected also (Figure 1(a)). Similar results were obtained by immunofluorescence (data not shown).

(a) Expression of p53 protein in MCF7, 1001, and MCF7-E6 (E6). Western blot analysis of p53 in the three cell lines MCF7, 1001, and E6. The p53 protein is stabilized in 1001 because of the mutation. β-actin was used as loading control. (b) Microarray heat map of miRNA expression. The summary heat map of the miRNA library screening in the three cell lines is shown. Red color represents miRNAs that were upregulated and green color represents miRNA that were downregulated. (c) TaqMan qRT-PCR for hsa-miR-200c in MCF7 versus 1001. Significantly increased expression of miR-200c in MCF7 cells as compared to 1001 cells was detected by qRT-PCR of four different samples. The level of expression of miR-200c in 1001 cells was adjusted at 1. The cell line signals were compared to two internal controls RNU44 and U6.
Differential expression of miRNAs according to p53
At the cut-off level of two-fold, many microRNAs were found to be altered in comparison to the parental cell line (as shown in Figure 1(b)). Three miRNAs were upregulated and seven were downregulated in MCF7-E6, compared to MCF7 (Table 1). The predicted targets of these 10 altered miRNAs were >100 known human genes belonging to functional groups such as the negative regulators of the epidermal growth factor receptor (EGFR) signaling and the extracellular matrix proteins. The 1001 clone with mutant p53 showed 22 upregulated and 25 downregulated miRNAs (Tables 2). The predicted targets of these 47 miRNAs were >700 human genes belonging to interesting functional groups such as stem cell development and maintenance. The detailed microarray data analyses and results will be published in a separate report.
Differentially expressed miRNAs in MCF7-E6 versus MCF7.

Fold change in the MCF7-E6 (the p53 knockout cell) versus MCF7.
Differentially expressed miRNAs in 1001 versus MCF7.
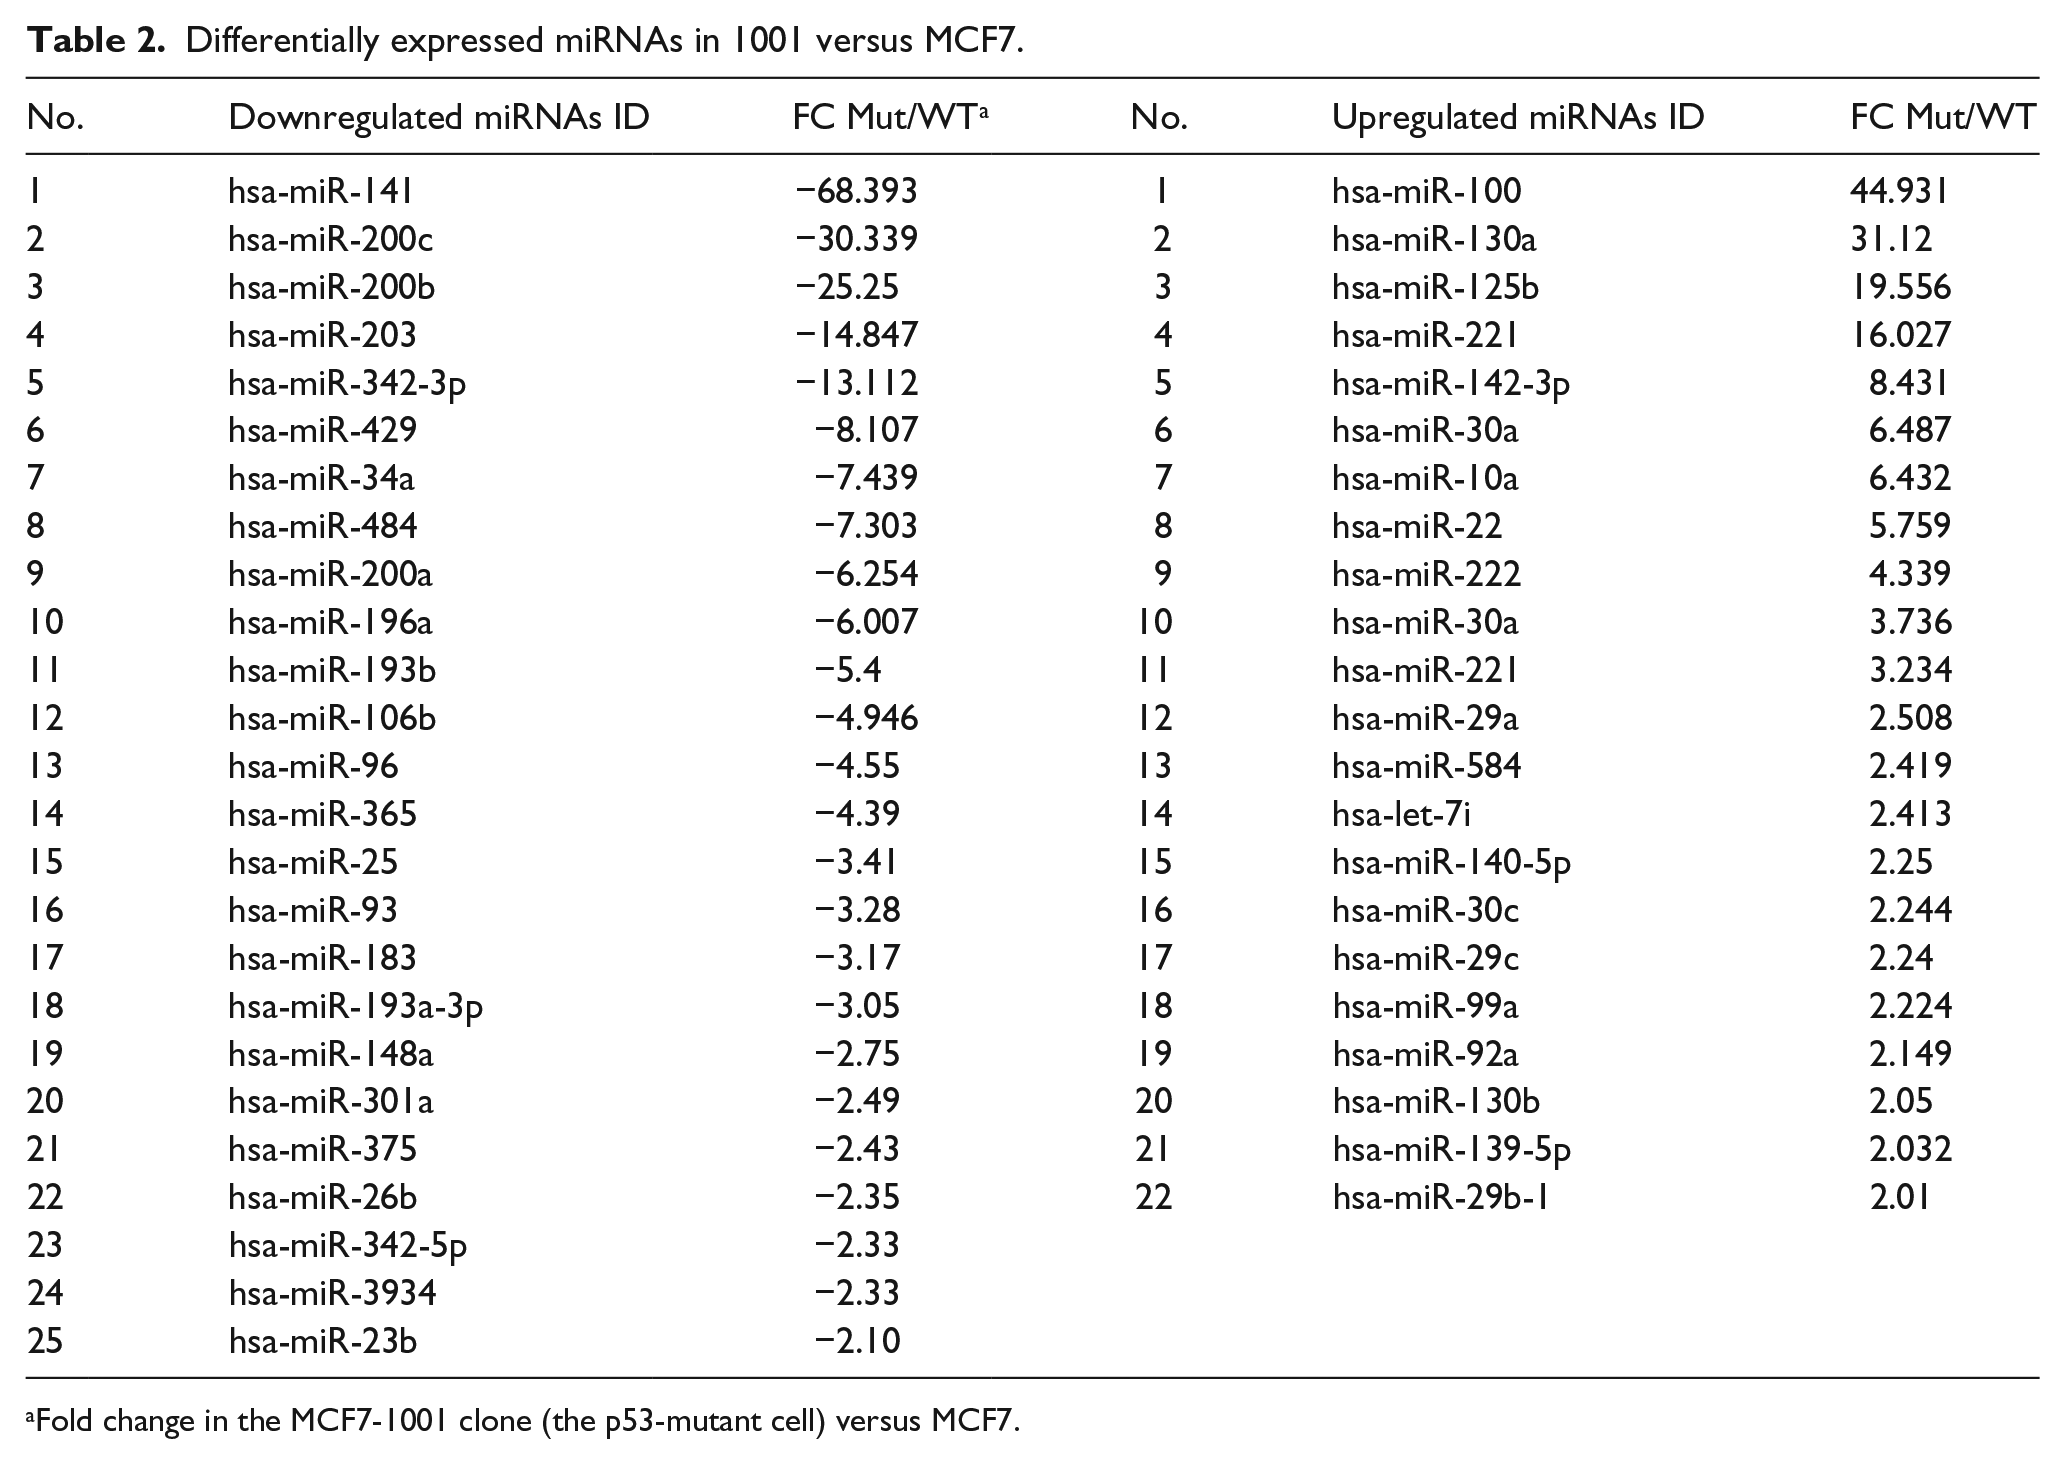
Fold change in the MCF7-1001 clone (the p53-mutant cell) versus MCF7.
Given the more profound impact of the p53 mutation observed in 1001 compared to the p53 knockout MCF7-E6, we focused on the 1001 cell line because it also represents the most common way of inactivation of p53 in human tumors. The two most significantly downregulated miRNAs in 1001 versus MCF7 were miR-141 and miR-200c and we focused on miR-200c as explained in the introduction.
RT-PCR and western blot confirmed differential expression of miR-200c and Moesin, respectively
We confirmed the differential expression of miR-200c in the cell lines by RT-PCR (Figure 1(c)). The experiment was done on four different samples and each sample was repeated twice. The levels of miRNAs were plotted against two internal controls, that is, RNU44 and U6. The results showed that MCF7 cells exhibit significant high levels of miR-200c in comparison to 1001 cells (Figure 1(c)). MiR-200c is known to target many transcripts that are involved in EMT, which was a distinctive feature of 1001 as compared to its parental line MCF7. We chose to explore the miR-200c target protein “Moesin” because of its potential role in EMT (as described above). Western blotting showed that Moesin was differentially expressed in our model where it was expressed in p53-mutant cell line but not in wild-type cell line (Figure 2(a)). There was a trend of decreased Moesin expression when 1001 cells were transfected with pre miR-200c confirming that MSN gene is a target of miR-200c in our model.

(a) Western blot analysis to detect expression of Moesin in 1001 versus MCF7 cells. Moesin is expressed in 1001 cells but not in MCF7 cells. HeLa cells were used as positive control for Moesin expression. (b) Western blot analysis to validate mesenchymal and epithelial phenotypes of 1001 cells and MCF7 cells, respectively. HeLa cell line was used as positive control for mesenchymal features. The MCF7 cells express the epithelial marker E-cadherin, while 1001 cells express the mesenchymal marker, vimentin, ZEB1, and CD44.
Mesenchymal features of 1001 are consistent with its Moesin expression
Consistent with previous observations, we were able to confirm some of the mesenchymal features of the p53-mutant cell 1001.5,6 The wild-type MCF7 cell line showed epithelial morphology by simple observation under inverted microscope. The non-wild-type p53 mutants changed from epithelial- to spindle-shaped single cells or clusters without well-defined cell-to-cell contacts when seeded at low density. We confirmed that 1001 expressed vimentin, lost E-cadherin, and expressed ZEB1 and CD44 as compared to its parental cell MCF7 (Figure 2(b)). The migration capacity of the1001 cells was increased compared to MCF7. MCF7-E6 showed an increased migration rate compared to the wild-type cell line but less than that of 1001 (Figure 3).
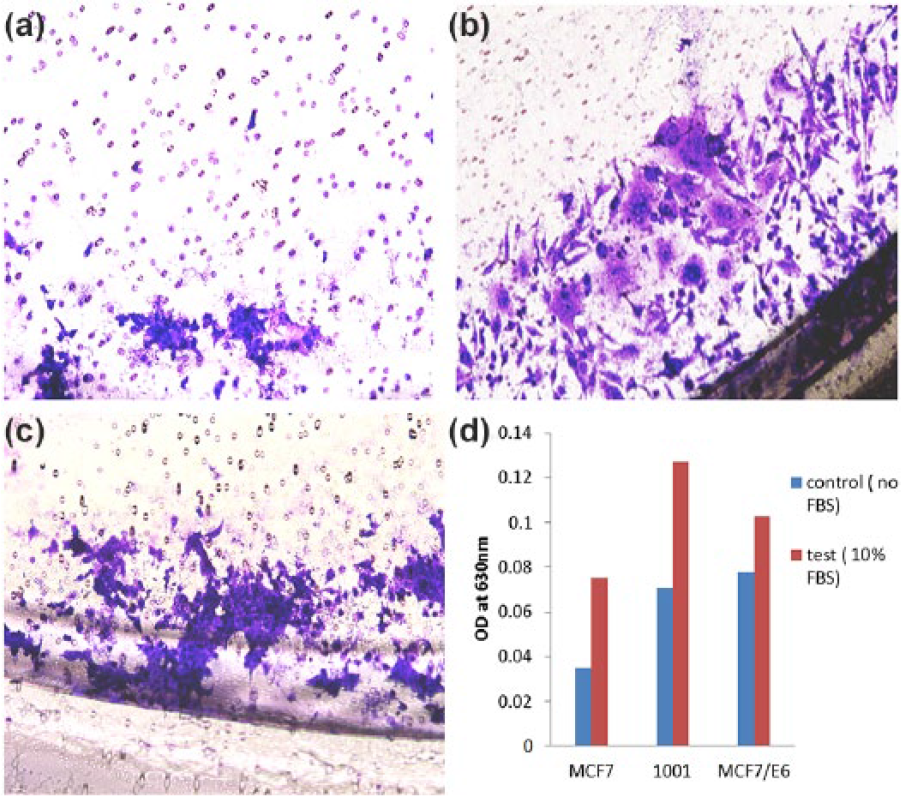
Cell invasion assay after 48 h. (a) MCF7, (b) 1001, (c) MCF7-E6, and (d) optical density reading of migrated cells using plate reader after extraction and staining. 1001 cells showed higher invasion and invasive cells had a more aggressive morphology.
Invasion assays revealed that 1001 cell line is more aggressive compared to MCF7. The number of invaded cells from clone 1001 was significantly higher (500 per high power field) in comparison to the parental MCF7 (around 50 per high power field). Also, 1001 cells that have invaded showed the anaplastic, aggressive malignant cell morphology such as large size, increased nuclear/cytoplasmic ratio, coarse, clumped chromatin, prominent nucleoli, and increased cytoplasmic extensions as compared to MCF7 (Figure 3). These finding prompted us to explore the potential role of Moesin in the EMT.
Moesin silencing caused mesenchymal-to-epithelial reversion
We silenced the expression of Moesin in the p53-mutant cells 1001 by siRNA transfection. Western blotting confirmed about 90% efficiency of the siRNA transfection (Figure 4). The cell morphology reverted back from spindle mesenchymal phenotype to rounded epithelial phenotype after Moesin silencing as detected by confocal microscopy (Figure 5). We also found subtle reduction in migration and invasion as well as loss of ZEB1 and SNAIL expression after Moesin silencing in 1001 cells. The effect of Moesin silencing on vimentin and E-cadherin expression was subtle.

Western blot analysis of 1001 whole cell lysates after silencing of Moesin by siRNA transfection. Two validated siRNAs (Hs_MSN_5 and siRNA_MSN_8) were used. Experiment was repeated twice. Here, western blot revealed that both siRNAs reduced the expression of Moesin with efficiency reaching about 90% when transfected with the two siRNAs in combination.
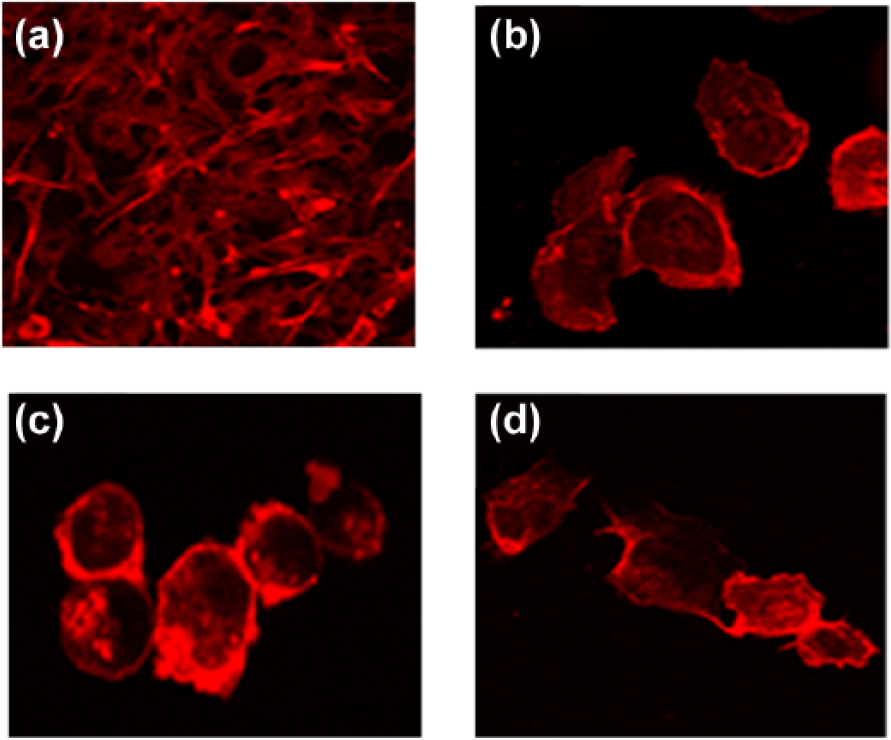
Confocal fluorescent micrographs of 1001 cells after phalloidin (Rhodamine) F-actin staining. Silencing of Moesin in 1001 cells is accompanied by change in cell morphology from spindly mesenchymal type to rounded epithelial type. (a) 1001 cells retaining their mesenchymal phenotype when transfected with control siRNA. (b)–(d) 1001 cells acquiring epithelial phenotype when transfected with siRNA5, siRNA8, and siRNA5+8, respectively.
Moesin silencing restored sensitivity to standard chemotherapy
The 1001 cell line was more resistant to standard chemotherapeutic agent doxorubicin compared to the p53 wild-type MCF7 parental cell. Interestingly, Moesin silencing restored the 1001 sensitivity to doxorubicin (Figure 6).

Response of the cell lines to increasing dose of doxorubicin. Both 1001 and 1001 transfected with control siRNA (All*) were more resistant to doxorubicin compared to the MCF7 parental cell. The 1001 transfected with the Moesin silencer (siRNA) became less resistant to the drug.
Discussion
The first major finding of this work was the identification of a set of miRNAs associated with p53 alterations in breast cancer cells. The p53-mutant clone revealed higher number of miRNA alterations than the p53 knockout clone. This suggests that p53 mutations, rather than loss, have a more profound effect on microRNA expression. This observation is consistent with, and supported by, the overall situation in primary tumors where p53 is most commonly deregulated by mutations (http://p53.iarc.fr/), combined with or without loss of the wild-type allele. 1 The TP53 gene mutation in the 1001 cell line is “R280K” which has a deleterious loss of functional effect on the p53 protein and it was commonly found in a wide range of primary tumors including breast cancer as well as in a number of other cell lines (http://p53.iarc.fr/). We have shown that this mutation has a profound effect on miRNA expression because 47 miRNAs were deregulated in our microarray analyses after taking a stringent two-fold cut-off level (Tables 1 and 2). Most of these miRNAs have a well-established or putative role in carcinogenesis. A recent systematic analysis has identified 22 miRNAs that have a well-established role in breast cancer development and metastasis and a connection with p53. Of these 22 p53-breast cancer miRNAs, 7 were in our list of 1001 versus MCF7 (miR-200c, miR-200b, miR-203, miR-342, miR-34a, miR-22, and miR-222) and 3 were in MCF7-E6 versus MCF7 list (miR-148b, miR-22, and miR-342). 29 Of these miRNAs, 5 were among the top 7 downregulated ones in 1001 versus MCF7 comparison. Thus overall, our data were consistent with, and adds more relevant information to, the recent literature on this topic.
Four members of the miR-200 family (miR-141, miR-200c, miR-200b, and miR-429) were remarkably present among the top six downregulated miRNAs by p53 mutation in our model. The miR-200 family plays a well-established role in tumor migration, EMT, and metastasis. The same family showed an emerging role in response to therapy and development of chemoresistance in different tumor types. 30 Many studies showed that different miR-200 family members can target and regulate ZEB1 and ZEB2 transcription factors which in turn can regulate the miR-200s in a negative feedback loop. 31 Additionally, p53 can regulate some of the miR-200 members and hence ZEB1 and ZEB2 in agreement with our findings. 4 The consequence of these interactions is the regulation of EMT, tumor cell invasion, and intravasation. The latter is a well-characterized action of miR-200 in multiple tumors of different lineages including breast and colon cancers. 30 Interestingly, miR-200 members can target EMT via multiple mechanisms independent of ZEB1 and ZEB2 and can also interact with and regulate many other signaling pathways that have an established or putative roles in EMT such as TGF-β.32,33 Moreover, repression of endogenous miR-200 expression by oncogenic signals including activated K-RAS is suggested to be an important step in carcinogenesis. 34 Not surprisingly, suppression of miR-200 was associated with chemoresistance and increased metastatic potential in many cancer cell types such as colon cancer12,35 and claudin-low breast cancer. 9 Many of the above features were represented in our p53-mutant breast cancer cell (1001) which showed clear mesenchymal features and also resistance to killing by some anticancer agents as described previously.5,6,23 Therefore, we investigated one of the promising potential targets of miR-200c, which is Moesin.
Moesin protein was highly expressed in the 1001 cells consistent with its EMT features and loss of miR-200c. This cell line demonstrated accelerated cell invasion and migration which was diminished after Moesin silencing. This finding is consistent with the earlier reports that suggested Moesin’s role in the initial stages of cell motility and invasion. 16 Furthermore, Moesin silencing in 1001 reversed its morphology and induced loss of ZEB1 and SNAIL expression. Even though further analyses is needed to dissect these complex relations, it is clear that Moesin plays a profound role in EMT as the maintenance of high levels of EMT markers was related to Moesin levels. Our data were consistent with Li et al., 36 who showed that miR-200b or miR-200c could repress breast cancer metastasis through ZEB-1-independent but Moesin-dependent pathway in an orthotopic xenograft model of breast cancer metastasis. Furthermore, Moesin expression in clinical specimens was associated with estrogen-receptor negative subtypes of breast cancer which could explain the poor prognosis associated with these subtypes. 37 Another study found that Moesin expression was much higher in metaplastic carcinoma (carcinosarcoma/spindle cell carcinoma) of the breast which is a subtype characterized by the morphology of EMT and aggressive clinical features. 19 Moesin mRNA expression was associated with upregulation of other EMT genes. 19 Additionally, Moesin overexpression was associated with metastasis in triple-negative breast cancers. 20
We also showed that silencing of Moesin alone restored the sensitivity to doxorubicin in the p53-mutant cell clone, 1001. This is intriguing since response to doxorubicin is known to depend upon intact p53. 38 Evidence was provided that TNF-α resistance and p53 mutation, as found in 1001 clone, were correlated with mesenchymal phenotype and a reorganization of the actin cytoskeleton. DNA microarray on 1001 cells showed upregulation of the gene LCP-1 that encodes for L-plastin, an F-actin binding protein. L-plastin in its phosphorylated form is necessary and sufficient to confer cell resistance to TNF-α. This finding suggests that actin cytoskeleton is no longer considered as only a structural framework but also plays a role in execution phase of cell death. 39 Recent studies supported the role of Moesin in response to therapy and development of drug resistance because the functions of the multidrug resistance mediator, P-glycoprotein, were shown to depend upon the integrity of the ERM complex in breast cancer cells. 40
In conclusion, we showed that loss of miR-200c as a consequence of p53 mutation in breast cancer cells upregulated significant oncogene products, such as Moesin, and promoted carcinogenesis. Moesin may play a role in metastasis and drug resistance of the aggressive subtypes of breast cancer cells. After further characterization in aggressive breast cancer tissue samples, Moesin might be considered as a potential target for personalized medicine in patients with refractory and/or metastatic breast cancer.
Footnotes
Acknowledgements
The authors thank Dr Salem Chouaib for supplying the cell lines and valuable advices and Dr Jerome Thiery, Dr Muhammad Zaeem Noman, Andres Tittarelli (all from INSERM and Gustave Roussy, University of Paris-Sud, Université Paris-Saclay, France), and Ms Harini Sampath (SIMR, University of Sharjah) for technical assistance/advice.
Declaration of conflicting interests
The author(s) declared no potential conflicts of interest with respect to the research, authorship, and/or publication of this article.
Funding
The author(s) disclosed receipt of the following financial support for the research, authorship, and/or publication of this article: This work was supported by Terry Fox Foundation for Cancer Research-UAE and the University of Sharjah grants to W.M.A.-R.