
Abstract
Interleukin-10 is involved in carcinogenesis by supporting tumor escape from the immune response. The aim of this study was to assess the single nucleotide polymorphisms, −1082A/G, −819T/C and −592A/C, in interleukin-10 gene promoter in inflammatory breast cancer compared to non–inflammatory breast cancer and association of these polymorphisms with interleukin-10 gene expression. We enrolled 105 breast cancer tissue (72 non–inflammatory breast cancer and 33 inflammatory breast cancer) patients and we determined the three studied single nucleotide polymorphisms in all samples by polymerase chain reaction restriction fragment length polymorphism and investigated their association with the disease and with various prognostic factors. In addition, we assessed the expression of interleukin-10 gene by real-time quantitative reverse transcription polymerase chain reaction and the correlation between studied single nucleotide polymorphisms and interleukin-10 messenger RNA expression. We found co-dominant effect as the best inheritance model (in the three studied single nucleotide polymorphisms in non–inflammatory breast cancer and inflammatory breast cancer samples), and we didn’t identify any association between single nucleotide polymorphisms genotypes and breast cancer prognostic factors. However, GCC haplotype was found highly associated with inflammatory breast cancer risk (p < 0.001, odds ratio = 43.05). Moreover, the expression of interleukin-10 messenger RNA was significantly higher (p < 0.001) by 5.28-fold and 8.95-fold than non–inflammatory breast cancer and healthy control, respectively, where GCC haplotype significantly increased interleukin-10 gene expression (r = 0.9, p < 0.001).
Introduction
Breast cancer ranks as a leading cause of death in women worldwide and it represents 11.9% of all cancer worldwide. 1 Indeed, genetic variations such as alleles, sequence variants, and chromosomal structural variants play a vital role in increasing the risk of breast cancer incidence.2,3
Inflammatory breast cancer (IBC) is an aggressive and fatal form of breast cancer that is more prominent among young women and is characterized by a high number of axillary lymph node metastases at the time of presentation, poor prognosis, and low survival rate.4–8
Cytokines, strong modulators of the immune system, and growth factors secreted by carcinoma cells or tumor-associated immune cells play a significant role in motility, invasion, and poor prognosis of breast cancer in general and the aggressive phenotype IBC. 9 In a previous study, we showed that macrophages isolated from the tumor microenvironment during breast surgery of IBC highly secrete tumor necrosis factor (TNF)-α, monocyte chemoattractant protein-1 (MCP-1)/CCL2, interleukin (IL)-10 and IL-8, cytokines which possess chemotactic properties and induce invasion and motility of carcinoma cells in three-dimensional models.
IL-10 is considered as a pleiotropic anti-inflammatory cytokine and has been reported to exert tumor inhibition in several cancers through activation of natural killer (NK) cells,10,11 prevention of angiogenesis,11–14 or other different mechanisms particularly in breast cancer. 15 On the contrary, other studies reported that IL-10 induces tumor progression through inhibition of a large number of cytokines such as IL-1a, IL-1b, TNF-α, IL-6, IL-8, IL-12, and IL-18 which play a vital role in tumor immune surveillance.16,17 Moreover, IL-10 affects antigen-presenting cells (APC) which act on T-helper cells and prevent their differentiation to Th1 and Th2 and thus prevent the production of their associated cytokines, 18 and this suggests IL-10 role in facilitating cancer immune escape. 19
Cytokines are encoded by highly polymorphic genes. Polymorphism in genes especially within promoter or other regulatory sequences potentially affects their production and may result in increased risk factor or poorer prognosis in certain cancer patients. 20
IL-10 gene is located on chromosome 1, at 1q31-1q32 and is composed of five exons and four introns. 21 Around 665 single nucleotide polymorphisms (SNPs), the most common form of genetic variation, are registered in the SNP database (http://www.ncbi.nlm.nih.gov/snp), in the whole IL-10 genome to date (2016). The three IL-10 promoter SNPs, rs1800896 (−1082A/G), rs1800871 (−819T/C), and rs1800872 (−592A/C), are the most commonly studied SNPs in various diseases and are supposed to be associated with differential levels of gene transcription. 22
Polymorphisms in the IL-10 gene are found to play important role in cancer progression. Studies showed that IL-10 −1082A/G SNP was associated with poor prognosis of head and neck cancer, 23 oral cancer, 24 oral squamous cell, 25 cutaneous malignant melanoma, 26 prostate cancer,27,28 digestive cancer, 29 and cervical carcinoma. 30 IL-10 −819C/T SNP found to be associated with the risk of lung cancer, 31 urothelial bladder cancer, 32 and head and neck cancer. 23 IL-10 −592A/C was found to be associated with the risk of lung cancer, 31 non-Hodgkin’s lymphoma, 33 and cervical cancer. 34
In breast cancer, studies conducted by Smith et al., 35 Kong et al., 36 and AlSuhaibani et al., 37 and meta-analysis 38 showed no association between IL-10 −1082A/G polymorphism and breast cancer incidence. 28 Other studies detected an increase in IL-10 −1082AA genotype frequency in breast cancer patients compared to that in normal controls.39,40 Interestingly, IL-10 −819T/C polymorphism was found to be associated with high risk of breast cancer among East Chinese population. 41 On the contrary, an association of IL-10 −592C/A promoter polymorphism with the reduced risk of breast cancer was reported; however, no association was found between IL-10 −592C/A SNP and clinicopathological data as tumor size, histological grade, and steroid receptor status. 42 Statistically, breast cancer is the most common female malignancy among Egyptian women as recorded by National Cancer Institute (NCI), Egypt. The most recent statistical study stratified Egypt geographically into three sectors and their data revealed that among Egyptian women, breast cancer showed the highest frequencies among all cancers in Lower, Middle, and Upper Egypt—33.8%, 26.8%, and 38.7%, respectively. 43
Indeed, different biomarkers associated with certain cancer types have not been studied in Egyptian cancer patients. Recently, a previous study found that polymorphisms in IL genes (IL-6 and IL-10) are found to be associated with breast cancer disease progression in Egyptian patients. Analysis of IL-10 −1082G/A SNP showed no difference between breast cancer patients (n = 80) and control subjects (n = 80); however, patients with genotype AA had a large tumor size than those with AG or GG genotypes.37,44
In this study, we investigated the incidence rate of the most prominent SNPs (−1082A/G, −819T/C, and −592A/C) in IL-10 gene promoter in non-IBC and IBC patients and their impact on IL-10 gene expression. Interestingly, GCC haplotype was significantly higher in frequency in IBC patients and was significantly associated with over-expression of IL-10 messenger RNA (mRNA) than other haplotypes estimated in both IBC and non-IBC.
Materials and Methods
Patients and samples
We obtained Institutional Review Board (IRB) approval from the ethics committee of Ain Shams University, Cairo, Egypt. Each patient signed a consent form to participate in the study and to publish the results. Depending on the clinical and pathological diagnosis, we recruited 105 breast cancer patients (72 non-IBC and 33 IBC), in this study, between October 2010 and October 2014. The patients’ clinical pathological data were obtained from their medical records and other prognostic factors were derived from hospital charts. Carcinoma tissues from non-IBC and IBC patients, blood samples of healthy volunteers, and healthy breast tissues obtained from women undergoing mammoplasty were used in this study.
DNA extraction and genotyping of IL-10 by polymerase chain reaction restriction fragment length polymorphism
DNA was extracted from fresh breast carcinoma tissues obtained during modified radical mastectomy (MRM) and from blood samples of healthy volunteers, using the GeneJET™ Genomic DNA purification kit as described in the kit guidelines.
Genotyping of IL-10 promoter SNPs was performed by polymerase chain reaction restriction fragment length polymorphism (PCR-RFLP), and PCR-specific primers for each SNP region were designed as previously described. 45 Studies showed that PCR-RFLP technique is affordable and the exact genotyping can be achieved accurately.46–50 PCR was carried out in a 25-µL total volume using 1 µL of each forward and reverse primer pairs (10 pmol/µL), 3 µL of DNA, containing about 250 ng DNA, 12.5 µL of EmeraldAmp® MAX PCR green master mix (TaKaRa, Dalian), and 7.5 µL of RNase-free water. The PCR thermal profile started with an initial denaturation at 94°C for 5 min followed by 35 cycles at 94°C for 45 s; at 58°C for −1082A/G, 59°C for 819T/C, and 58°C for −592A/C; 45 s at 72°C; and a final elongation at 72°C for 10 min.
SNPs in the IL-10 gene promoter were genotyped by RFLP analysis, a technique that detects genetic variations in homologous DNA sequences, as previously described. 45 Two units of each restriction enzyme were used in DNA digestion. For −1082 SNP, we digested PCR product with MnlI (Vivantis, Selangor Darul Ehsan, Malaysia) at 37°C for 3 h and resulted in 106 bp, and 33 bp with allele −1082G and 139 bp with allele −1082A. While for −819 SNP we incubated PCR product overnight with MaeIII (Roche Diagnostic GmbH, Penzberg, Germany) at 55°C which resulted in 125 bp, and 84 bp for allele −819C and 209 bp for allele −819T. For −592 SNP, we digested the PCR product with RsaI (Vivantis) for 1 h at 37°C and resulted in 236 bp, and 176 bp for allele −592A and 412 bp for allele −592C. To assure genotyping quality and validity, we repeated our experiments three times changing one or more parameters each time using the least concentration of DNA that could be detected on gel, extending the time of digestion up to 8 h and/or using higher concentration of the restriction enzyme (as all used enzymes lack any non-specific endonuclease activities as mentioned per the enzymes’ protocols). Our results showed consistency with the various conditions, thus we used optimum conditions.
Assessment of IL-10 mRNA expression by real-time quantitative reverse transcription PCR
Total RNA was extracted from frozen breast tissue samples by RNeasy Mini kit (Qiagen) following the manufacturer’s protocol and then 1 µg of RNA was reversed transcribed into complementary DNA (cDNA), using the iScript cDNA Synthesis Kit (Bio-Rad, Hercules, CA, USA) as described in the manufacturer’s manual.
We conducted quantitative reverse transcription polymerase chain reaction (qRT-PCR) to assess transcription levels of IL-10 mRNA in specimens of healthy tissue, non-IBC and IBC tissue samples using previously described primers (F: 5-GTGGAGCAGGTGAAGAATGC-3 and R: 5-GCCACCCTGATGTCTCAGTT-3). 47
PCR was carried out in a reaction volume of 20 µL containing 10 µL of SYBR green master Mix, 2.5 µL of cDNA, 1 µL (10 pmol) of each forward and reverse primers, and 5.5 µL of nuclease-free water. PCR was performed using Applied Biosystems (step one plus) thermocycler and thermal profile involved initial denaturation step at 95°C for 10 min, then followed by 45 cycles at 94°C for 15 s and 60°C for 1 min. Melting curve analysis was also conducted to ensure the reaction specificity. Glyceraldehyde 3-phosphate dehydrogenase (GAPDH) was used as a reference gene. 6
Experiments were conducted in duplicates and threshold cycle differences (ΔCt) were then averaged and results were normalized to endogenous control GAPDH expression fold to compensate PCR inter-variation and calculations have been done according to the 2−ΔΔCt formula.
Statistical analysis
Clinical pathological statistical data are represented as mean ± standard deviation (SD) and differences between both non-IBC and IBC patients were determined by Student’s t-test and Fisher’s exact test by using SPSS 18.0 software. 51
Association analysis between polymorphisms and disease was also be assessed by either a chi-square test or Fisher exact test. The odds ratio (OR) and 95% confidence interval (CI) were also calculated to assess the corresponding strengths of association under the co-dominant, dominant, and recessive models.
Linkage disequilibrium (LD) was determined by calculating the D′ statistic that is the deviation between the expected haplotype frequency (under the assumption of no association) and the observed frequency. Also, we determined the correlation (r) to show how strong these SNPs would be inherited as one block. All association analysis was performed by SNPStats online software in which p < 0.05 is considered statistically significant (Table b and c in Supplementary material). 52
Results
Clinical and pathological features of breast cancer patients
Clinical and pathological data of breast cancer patients are presented in Table 1. We found that non-IBC patients had a statistically significant (p < 0.001) low number of positive metastatic lymph nodes compared to IBC patients. Furthermore, the status of lymphovascular invasion and presence of dermal lymphatic emboli was significantly lower in non-IBC patients (p < 0.001) than in IBC patients.
Clinical and pathological characterization of non-IBC and IBC breast cancer patients.

IBC: inflammatory breast cancer; SD: standard deviation; SE: standard error; PR: progesterone receptor.
Data are reported as mean ± SD.
p values are calculated using aStudent’s t-test or bFisher’s exact test.
Significant results p-value (p < 0.005) are in bold.
Significant results p-value (p < 0.001) are in bold.
Genotype and allele frequencies of IL-10 SNPs (−1082A/G, −819T/C, and −592A/C)
Genotyping of IL-10 SNPs was conducted in non-IBC and IBC tissue samples using PCR-RFLP (Figure 1). We tested genotype frequencies of the three studied SNPs for Hardy–Weinberg equilibrium (HWE) (Table a in Supplementary material). We found that the genotypes were in HWE in healthy volunteers and both non-IBC and IBC disease group and genotype distribution is as follows: for −1028 A/G (p = 0.7 and p = 0.31, p = 0.67), for −819T/C (p = 0.47 and p = 0.6, p = 1), and for −592A/C (p = 0.68 and p = 0.44, p = 0.67) in control and in non-IBC and IBC, respectively.
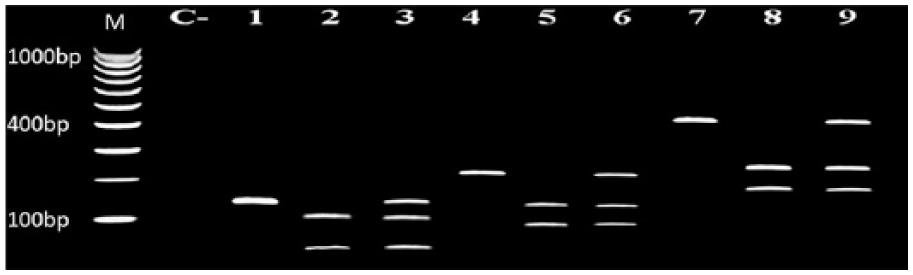
Genotyping of the −1082A/G, −819T/C, and −592A/C SNPs in IL-10 promoter by PCR-RFLP. Agarose gel electrophoresis of PCR-RFLP showing IL-10 SNP genotyping in BC patients. Lanes 1, 2, and 3: Representative for SNP IL-10 −1082A/G, in which lane 1: homozygous for wild-type allele A (139 bp); lane 2: for mutant allele G (106 + 33 bp); and lane 3: heterozygous A/G. Lanes 4, 5, and 6: Representative for SNP IL-10 −819T/C, in which lane 4: homozygous for wild-type allele T (209 bp); lane 5: homozygous for mutant type allele C (125 + 84); and lane 6: heterozygous T/C. Lanes 7, 8, and 9: Representative for SNP IL-10 −592A/C, in which lane 7: homozygous for mutant allele C (412 bp); lane 8: homozygous for wild-type allele A (236 + 176); and lane 9: heterozygous A/C. Lane C represents negative control. Lane M: 100 bp DNA marker.
The genotype and allele frequencies of IL-10 gene −1082A/G, −819T/C, and −592A/C polymorphisms are summarized in Table 2. We compared the genotype distribution of IL-10 gene polymorphisms among healthy volunteers and both non-IBC and IBC patient groups. Our results showed that the co-dominant inheritance was the best inheritance model (according to AIC and BIC) in the three studied SNPs as follows, for –1082 A/G, p < 0.0001 in both non-IBC and IBC, while for –819 T/C, p < 0.0001 in non-IBC and p < 0.05 in IBC and as for –592 A/C, p < 0.0001 in both non-IBC and IBC (Table 2). Also, we tested SNP distribution between non-IBC and IBC patients and the statistical analysis revealed no significant difference in −1082A/G, −819 T/C, and -592A/C SNPs for various inheritance models.
Genotype and allele distribution of IL-10 polymorphisms (−1082A/G, −819T/C, and −592A/C).

IBC: inflammatory breast cancer.
Best model according to the Akaike Information Criteria (AIC) and Bayesian Information Criteria (BIC).
Significant p values using bSNPstats or cSPSS.
Comparison between control and non-IBC.
Comparison between control and IBC.
Comparison between non-IBC and IBC.
Significant results (p < 0.05).
Significant results (p < 0.001).
Significant results (p < 0.0001).
In comparing allele distribution between control samples and non-IBC as well as IBC, our data revealed significant increases in G, C, and C alleles of the three SNPs, −1082A/G, −819T/C, and -592A/C respectively, in non-IBC (p < 0.0001) and IBC (p < 0.0001 except C allele of SNP −819 (p < 0.001)) (Table 2). On the contrary, our results did not show any significant difference in allele distribution between non-IBC and IBC.
Association between SNP genotypes and prognostic factors
We calculated the Nottingham Prognostic Index (NPI); prognostic tool combines only three factors, lymph node involvement, tumor size, and histological grade, for each patient (72 non-IBC and 33 IBC). 53 According to NPI, patients were grouped into three categories: good prognosis group (GPG), moderate prognosis group (MPG), and poor prognosis group (PPG). In the non-IBC group, there were 25% GPG, 67% MPG, and 8% PPG, while in IBC group, there were 0% GPG, 85% MPG, and 15% PPG. In studying the association between genotype and calculated NPI, we did not identify any significant difference (Table 3). Also, we investigated the association between SNP genotypes and various clinicopathological characteristics independently (tumor size, tumor grade, axillary lymph node metastasis, pathology, ER, PR, and Her-2), of non-IBC and IBC patients but we also did not identify any association between SNP genotypes and various prognostic factors (data not shown).
Analysis of SNP genotype interactions with Nottingham Prognostic Index. a

SNP: single nucleotide polymorphism; IL: interleukin; IBC: inflammatory breast cancer; CI: confidence interval.
p value and odd ratio (OR) were calculated using SNPStats software program.
Nottingham Prognostic Index (NPI) was calculated using an online calculator (http://farmacologiaclinica.info/scales/nottingham-prognostic-index/) for each patient in both non-IBC and IBC group. Patients were grouped under three categories: good prognosis group (GPG), moderate prognosis group (MPG), and poor prognosis group (PPG).
Haplotype analysis of the IL-10 promoter gene
The association between haplotypes of the IL-10 promoter gene polymorphism and breast cancer risk was further conducted. LD was not strong between −819T/C and −1082A/G (D′ = 0.4, 0.5), −592A/C and −1082A/G (D′ = 0.4, 0.5), and −592A/C and −819T/C (D′ = 0.4, 0.5) in non-IBC and IBC, respectively. Eight possible haplotypes were demonstrated in our case–control study. The most frequent haplotype was ATA (46%) in the healthy volunteer group, while GCC haplotype was the most frequent haplotype in non-IBC (38%) and IBC (47%). However GCC haplotype was found in association with both non-IBC and IBC disease risk when both compared to healthy volunteers but there was an over-increase in the risk of IBC (p < 0.001, OR = 43.05) (Tables 4 and 5).
Haplotype frequency estimation and association with response to non-IBC patients in comparison to healthy volunteers group.

IBC: inflammatory breast cancer; OR: odds ratio; CI: confidence interval.
Haplotype frequencies are shown for each level of control and IBC group. The cumulative frequency is useful to decide which haplotypes are rare and the risk for every haplotype will be compared with respect to the reference category.
p value and OR were calculated using SNPstats software.
Haplotype represented as the most frequent haplotype which plays as a reference haplotype.
Global haplotype association p value <0.0001; significant results at p < 0.005.
Haplotype frequency estimation and association with response to IBC patients in comparison to healthy volunteers group.

IBC: inflammatory breast cancer; OR: odds ratio; CI: confidence interval.
Haplotype frequencies are shown for each level of control and IBC group. The cumulative frequency is useful to decide which haplotypes are rare and the risk for every haplotype will be compared with respect to the reference category.
p value and OR were calculated using SNPstats software.
Haplotype represented as the most frequent haplotype which plays as a reference haplotype.
Global haplotype association p value <0.0001; significant results at p < 0.001.
mRNA expression of IL-10 by qRT-PCR and its association with haplotypes
The expression level of IL-10 mRNA was determined by qRT-PCR (Figure 2). Our results revealed an increased expression of IL-10 gene in non-IBC and IBC by 3.67- and 8.95-fold than healthy control samples, respectively. Furthermore, real-time PCR results revealed a higher significant expression of IL-10 mRNA (p < 0.001) by more than five in IBC tissues compared to non-IBC.

mRNA expression of IL-10 by qRT-PCR. Bars represent IL-10 mRNA expression as mean ± standard error in healthy tissue, non-IBC and IBC tissue. Data were analyzed using Students t-test.
Using SNPstats software, we found that GCC haplotype was the most correlated with increased expression of IL-10 when we assessed the influence of IL-10 haplotype polymorphism on the expression of IL-10 mRNA. Thus, we categorized patients into two haplotype groups, GCC, and non-GCC group, and compared the expression of IL-10 gene in samples with GCC haplotype and those with non-GCC haplotypes. Our results showed that samples with GCC haplotype have a markedly significant increase in IL-10 expression by 4.6- and 6.6-fold higher (r = 0.9, p < 0.001) than non-GCC haplotypes in non-IBC and IBC, respectively (Figure 3(a)). We also compared IL-10 expression in non-IBC and IBC samples with GCC haplotypes, and we found that IL-10 gene expression was significantly higher in IBC (p < 0.001) by 6.3-fold than in non-IBC (Figure 3(b)).

Correlation between IL-10 gene expression and various haplotypes. (a) Bars represent the correlation between IL-10 mRNA expression (as mean ± standard error) in non-IBC and IBC tissues GCC and non-GCC haplotypes. Data were analyzed using Students t-test. (b) Bars represent the correlation between IL-10 mRNA expression (as mean ± standard error) in healthy donors, non-IBC and IBC samples and GCC occurrence. Data were analyzed using chi-square test.
Discussion
Indeed, mutations in cytokine promoter gene sequences may change specific transcription factor recognition sites and thus result in transcriptional activation and cytokine production.54–56 Therefore, many genetic studies were conducted to investigate the correlation of IL-10 gene polymorphisms with various immune-mediated diseases. IL-10 -1082 A/G and its association with various diseases were the only studied SNP in Egyptian population such as psoriasis, 57 HBV, 58 Behcet’s disease (BD), 59 and various types of tumors.37,60
Herein, we studied the three SNPs, −1082A/G, −819T/C and −592A/C, in the IL-10 gene promoter and their effect on gene transcription in both non-IBC and IBC patients in comparison to healthy volunteers group. We found AG and GG genotypes, which were estimated as a co-dominant, of IL-10 −1082A/G were associated with increased risk in non-IBC and IBC patients. Based on OR, our data showed that GG genotype is more likely to be correlated with increased risk of IBC.
Our results agreed with previous studies conducted on various types of cancer as nasopharyngeal carcinoma (NPC), 61 oral cancer, 24 non-Hodgkin’s lymphoma, and meta-analysis for gastric cancer 62 and lung cancer. 63 Previous studies conducted on breast cancer patients reported no association between GG genotype and breast cancer risk.35,36,64,65 On the contrary, some other studies found GG genotype as a protective factor against breast cancer,35,40 and other studies suggested that AA genotype plays a risk factor in breast cancer etiology.39,40,42
According to the published literatures, only two studies conducted on Egyptian population and included only −1082G/A SNP in IL-10 gene promoter in breast cancer patients and they did not detect any significant difference in distribution of genotypes but the tumor size was significantly larger in breast cancer patients with AA genotype. 37
There are a number of recognition sites in the promoter of the IL-10 gene, including API, PEA1, and an ETS-like element. 66 The polymorphism A/G at position −1082 in the IL-10 gene promoter lies within the ETS-like recognition site 66 and that consequently affects the binding of this transcription factor. 67
As for IL-10 −819T/C SNP, we found that TT and TC genotypes were correlated with reduced risk of non-IBC, and CC genotype showed no association with non-IBC risk, while TC and CC genotypes were correlated with the increased risk of IBC. Previous meta-analysis studies showed that −819TT genotype was more protective for gastric cancer in Asians, while CT and CC genotypes, as dominant effect, presented as risk factors for cervical and ovarian cancer. 68 Another study showed that TC and TT genotypes had a significant association with urothelial bladder cancer and might be used as a molecular marker for the disease, while some other studies conducted on breast cancer in Han Chinese and Iranian populations reported no association.33,32,36,64
Regarding −592A/C our study suggested that -592 AA+AC genotypes are more likely to be correlated with reduced risk of non-IBC and there was no association of CC genotype with the risk of non-IBC, while AC and CC genotypes were correlated with the increased risk of IBC. Our results agree with study conducted on Austrian breast cancer patients that showed that AA genotype was less frequent among patients than controls; 42 other study revealed that AA genotype associated with protection or the reduced risk of breast cancer, 42 while another study showed that CC genotype associated with the development of non-Hodgkin’s lymphoma in AIDS patients; 33 and studies conducted on breast cancer in Iranian and Chinese patients showed no association of the disease with the frequency of genotypes. None of the three studied SNPs of IL-10 gene promoter showed any association with clinical pathological characteristics of patients (tumor size, tumor grade, axillary lymph node metastasis, pathology, ER, PR, and Her-2. Our results are in accordance with studies conducted by Langsenlehner et al. 42 and Korobeinikova et al. 49 on breast cancer which showed that SNP genotypes were not associated with tumor size, histological grading, ER or PR status, and age at diagnosis. While other studies reported an association with disease prognosis, for instance −1082AA genotype found to be associated with higher lymph node involvement and higher tumor size, 36 another one showed association with PR expression and not associated with the rest of prognostic factors. 64
Regarding the haplotypes estimated in this study, we found a significant correlation between GCC haplotype in IBC patients in comparison to healthy control group, while ATA haplotype is the most frequent among healthy volunteer group. Previous studies showed that IL-10 (−1082, −819, and −592) GCC/ATA haplotype was suggested to be a risk factor for breast cancer oncogenesis and severe disease, 69 NPC, 61 skin squamous cell carcinoma after renal transplantation, 70 and oral risk compared with ATA haplotype, 71 while other studies found no statistically significant correlation between haplotypes in breast cancer patients in comparison to healthy controls.36,64,72
Also, previous studies detected high levels of IL-10 mRNA expression in breast cancer 73 renal cancer, 74 ovarian cancer, 75 primary malignant melanomas, and melanoma metastases as compared with normal specimen. 76
Similarly, we found increased levels of IL-10 mRNA expression in IBC compared to non-IBC and healthy control group. In addition, we tested the correlation between expression level of mRNA in relation to the studied SNP haplotypes. Interestingly, we found that GCC haplotype was more frequent among non-IBC and highly significant among IBC patients and was associated with high production. Therefore, we can consider GCC haplotype may be a risk factor for IBC risk. A previous study identified polymorphisms in the promoter region of IL-10 and analyzed their effect upon IL-10 transcription and showed that IL-10 SNP haplotype were associated with differential IL-10 expression in vitro, whereas ATA haplotype was associated with decreased IL-10 expression compared with GCC haplotype. 77 Also, previous case–control studies reported that GCC/ATA haplotype, which was associated with high production, was found in a higher frequency in all breast cancer patients and the high-risk group, 69 gastric cancer,78,79 and lymphoma. 33
In conclusion, we detected that the polymorphic AG and GG genotypes for −1082A/G; TC and CC genotypes for −819T/C SNP; and AC and CC genotypes for −592A/C SNP were significantly associated with the risk of IBC but could not contribute to the progression of the disease. Regarding SNP haplotypes estimated, GCC haplotype was significantly associated with the risk of IBC, while ATA haplotype was the most frequent among healthy volunteers. Also, our study detected a high expression of IL-10 mRNA in IBC compared to non-IBC and healthy control group. In relation to mRNA expression with SNP haplotypes, GCC haplotype recorded the highest expression level of transcription compared to other estimated non-GCC haplotypes. Therefore, we assumed that the presence of GCC haplotype may increase the risk of the development of the disease and might contribute, beside other factors, in the over-expression of IL-10 gene in aggressive breast cancer phenotype IBC.
Footnotes
Acknowledgements
The study was conducted at the Cancer Biology Research Laboratory (CBRL), Department of Zoology, Faculty of Science, Cairo University, Giza, Egypt. The authors would like to thank Dr Heba Bassiony, Assistant Professor of Molecular Biology (Department of Zoology, Faculty of Science, Cairo University) for her assistance with statistical analysis. S.S. and S.K.E.-S. contributed equally to this work.
Declaration of conflicting interests
The author(s) declared no potential conflicts of interest with respect to the research, authorship, and/or publication of this article.
Funding
The author(s) received no financial support for the research, authorship, and/or publication of this article.
References
Supplementary Material
Please find the following supplemental material available below.
For Open Access articles published under a Creative Commons License, all supplemental material carries the same license as the article it is associated with.
For non-Open Access articles published, all supplemental material carries a non-exclusive license, and permission requests for re-use of supplemental material or any part of supplemental material shall be sent directly to the copyright owner as specified in the copyright notice associated with the article.