
Abstract
Triple-negative breast cancer is a kind of breast cancer with poor prognosis and special biological behavior, which lacked endocrine therapy and targeted therapy. We investigate the effect of human APE1 (apurinic/apyrimidyl endonuclease 1), a rate-limiting enzyme of base excision repair, on the prognosis in triple-negative breast cancer and drug sensitivity of olaparib. The expression of APE1 was detected by immunohistochemistry in the triple-negative breast cancer tissues and its effect on survival of triple-negative breast cancer patients was followed. To find whether APE1 effect the drug sensitivity in triple-negative breast cancer cells, the APE1-knockout HCC1937 cell line (triple-negative breast cancer cell line) was established by CRISPR/Cas9 system. Then, we use the wild-type and knockout one to test the drug sensitivity of olaparib. The expression of APE1 in triple-negative breast cancer tissues was significantly higher than that in the adjacent tissues (85.6% vs 14.4%) and its expression was related to tumor size (p < 0.05). We also found that it is an independent prognostic factor in patients with triple-negative breast cancer (overall survival, p = 0.01). In vitro assay, the half maximal inhibitory concentration of olaparib in HCC1937-APE1-KO was significantly increased (17.22 vs 91.85 μM) compared to the wild type. The growth curve showed that olaparib had a stronger lethality on HCC1937 compared to HCC1937- APE1-KO (p < 0.05 on day 3). HCC1937 resulted in more mitotic G2/M arrest and increased apoptosis rate after treatment with 40 μM of olaparib, while HCC1937-APE1-KO did not change significantly. When HCC1937 was treated with different concentrations of olaparib, it was found that APE1 expression decreased more significantly at 15 μM of olaparib was. In HCC1937-APE1-KO, the expression of endogenous poly (ADP-ribose) polymerase 1 was also less than that of HCC1937. These results suggested that the expression of APE1 was an important basis for the maintenance of poly (ADP-ribose) polymerase 1, and the deletion of APE1 may be related to the resistance of olaparib.
Keywords
Introduction
The mutation rate of BRCA1/2 in triple-negative breast cancer (TNBC) is 9%–28%. 1 BRCA1/2 is the key gene in homologous recombination (HR), and its mutation could increase the drug sensitivity of DNA damage drugs and DNA repair inhibitors. Results of an international multi-center Phase II clinical study in 2011 shows that chemotherapy plus iniparib (poly (ADP-ribose) polymerase (PARP1) inhibitor) group, compared to chemotherapy alone, extended the median progression-free survival from 3.6 months to 5.9 months (HR = 0.57) and the median overall survival from 7.7 months to 12.3 months (HR = 0.59) in the late TNBC. 2 When PARP1 is inhibited, intracellular accumulation of single-stranded DNA breaks in the DNA replication process may convert to double-stranded DNA damage. Thus, BRCA1/2 deficient cells, which cannot efficiently repair double-strand breaks (DSBs), have high sensitivity to PARP1 inhibitors. 3
Although there is a high mutation rate of BRCA1/2 in TNBC, Phase II clinical trial of PARP1 inhibitor olaparib has not reached desired effect in TNBC. 4 It was published that the efficacy rate of PARP1 inhibitors was 31.7% in BRCA1/2-mutated ovarian cancer while only 12.9% in breast cancer. 4 Thus, except for BRCA1/2, there may be other molecules affecting the efficacy of PARP1 inhibitors. Early studies have shown that when BRCA1 was mutated, PARP1 inhibitors have an effect on different types of DNA repair molecules, including p53 and phosphatase and tensin homolog (PTEN). 5 APE1, a key factor in base excision repair (BER), was abnormally expressed in a variety of tumors including breast cancer tissues.6,7 We also tested the expression of APE1 in TNBC tissues and found its effect on prognosis in TNBC patients. As APE1 and PARP1 can combine with the same site in BER pathway, we speculated that APE1 may be a key factor affecting the drug sensitivity of olaparib (PARP1 inhibitor). Therefore, we established HCC1937-APE1-KO (BRCA-mutated TNBC cell line) by CRISPR (clustered regularly interspaced short palindromic repeats)/Cas9 system to observe the drug sensitivity of olaparib.
Material and methods
Compounds and reagents
Olaparib (AZD2281) was purchased from Selleck Chemicals (USA). Mouse anti-human APE1 antibody and goat anti-mouse secondary antibody were purchased from Santa Cruz Biotechnology (USA). Cell Counting Kit-8 (CCK-8) was purchased from Dojindo Molecular Laboratories (Japan). Annexin V-FITC/PI Apoptosis Detection Kit was purchased from BD Biosciences (USA). RPMI-1640 medium and fetal bovine serum (FBS) were purchased from HyClone (USA).
Cell lines and culture
The BRCA-mutated human breast cancer cell line HCC1937 was cultured in 10% FBS and 1% penicillin/streptomycin.
Paitents included
We selected 108 patients who were diagnosed with TNBC and were treated in Changhai Hospital, Ruijing Hospital, and Shanghai Huangpu District Central Hospital as well as 71 adjacent tissues for control, from 2001 to 2011. All the cases had definite pathological diagnosis and results of immunohistochemistry (IHC) including tumor stage, age, lymph node metastasis, and so on. Patients were followed up by telephone, outpatient department, and Shanghai Center for Disease Control.
Construction of tissue microarray
First, paraffin blocks were marked and the representative positions were chosen to be studied through hematoxylin and eosin (H&E) staining. Then, prepared tissue chips were arrayed into a blank paraffin block using a tissue microarray (TMA) spotting instrument (Beecher Instruments, USA) and each location was accurately labeled. Finally, tissue array block was cut into 4 µm-thick sections for immunohistochemical staining.
IHC
We analyzed the expression of APE1 protein using IHC. First, tissue slices were incubated for overnight in 4°C with mouse anti-human APE1 antibody (dilution ratio—1: 400). Then, they were incubated with goat anti-mouse secondary antibody (Santa Cruz Biotechnology; dilution ratio—1: 1000) at room temperature for 30 min. The results were photographed with 3,3′-diaminobenzidine (DAB) substrate under the microscope. Finally, they were stained with hematoxylin and photographed again.
Evaluation of immunohistochemical staining
We used double-blind method. The results were considered by two experienced pathologists and were judged twice when there was any difference in the opinion. The results were evaluated by two scoring method. According to the degree of coloration, intensities of nuclear staining were classified as follows: 0 = no staining, 1 = low staining, 2 = medium staining, and 3 = high staining. Meanwhile, the staining levels were calculated by the proportion of positive cells: 0 ⩽ 5%, 1 = 6%–25%, 2 = 26%–50%, 3 = 51%–75%, and 4 > 75%.
For the final results, the product of intensities and staining levels were multiplied, and the proportion of more than 50% was considered as high level expression. Human epidermal growth factor receptor 2 (HER-2) expression was evaluated according to the American Society of Clinical Oncology (ASCO) and the College of American Pathologists (CAP), up to 30% and uniformly colored membrane could be represented by (+++) and the IHC (+++) defined it as HER-2 positive or HER-2 overexpression. HER-2 (++) was detected again by fluorescence in situ hybridization (FISH). HER-2 was defined positive when FISH result was greater than 2.2 or negative when FISH result was less than 1.8. HER-2 (−) and HER-2 (+) were directly defined as negative. It was identified as estrogen receptor (ER) or progesterone receptor (PR)-positive when the percentage of positive level in nuclei staining was higher than 10%. TNBC means ER(−)/PR(−)/HER-2(−).
Statistical analyses
The experimental results and clinical data were statistically analyzed using SPSS 18.0 for three times. The statistical significance of differences of the expression of APE1 protein in different tissues as well as the relationship between APE1 expression and clinicopathological parameters in breast cancer was analyzed by Fisher’s exact test. Univariate analysis was performed using Kaplan–Meier survival curves while multivariate analysis was performed using Cox proportional hazards regression model. Experimental data were expressed as mean ± standard deviation (mean ± SD). Grouped t test was used to compare the mean between two groups. p < 0.05 was considered to be statistically significant.
CCK-8 assay
To test half maximal inhibitory concentration (IC50), cells were inoculated into 96-well plates (3 × 10³–5 × 10³/well) and treated with olaparib to make the final concentration of drug in each group up to 3.125, 6.25, 12.5, 25, and 50 μM. After 48 h, 10 μL of CCK-8 was added to each well and incubated for another 2 h in the incubator. At different time points (0, 24, 48, 72, 96, and 120 h), 10 μL of CCK-8 was added to each well treated with olaparib (20 μM) and incubated for 2 h to detect the cell growth curve. Finally, the optical density (OD) value at 450 nm was read by an automatic microplate reader.
Flow cytometry
The experimental group was treated with 40 μM of olaparib and incubated for 72 h. The cells were resuspended in 500 μL of 1× binding buffer, were added with 3 μL of 20 μg/mL Annexin V, and incubated for 15 min in the dark, followed by addition of 3 μL of 50 mg/mL of propidium iodide (PI). Sufficient mixing was needed before cells were detected on the machine. The drug-untreated cells were considered as controls for fluorescence compensation adjustment. All the results were conducted three times.
CRISPR construction
CRISPRs were programmed by http://crispr.mit.edu (Zhang Lab at MIT). Then, we inserted them into pX335 CRISPR/Cas9 vector (Zhang Lab) as per Zhang’s protocol (http://www.genome-engineering.org/crispr/wp-content/uploads/2014/05/CRISPR-Reagent-Description-Rev20140509.pdf). The target sequences of APE1 are GATCTGGGGGGTCCTCATAC.
Results
High expression of APE1 in TNBC tissues
APE1 was found in both TNBC and adjacent tissues, and APE1 expression in breast cancer tissues was higher than that in adjacent tissues. APE1 was localized in nucleus and cytoplasm of the two kinds of tissues (Figure 1). In 108 cases of TNBC samples, positive rate of high APE1 expression in TNBC and adjacent tissues was 85.6% and 14.4%, respectively. The expression of APE1 in cancer tissues was significantly higher than that in adjacent tissues (p < 0.001, Table 1).

The expression of APE1 in TNBC tissues and adjacent tissues. (a) The expression of APE1 was high in TNBC tissue, which was brown and localized in nucleus and cytoplasm (light microscope: 200×). (b) The expression of APE1 was low in adjacent tissue, which is light yellow (light microscope: 200×).
APE1 expression in TNBC and adjacent tissues.

APE1: apurinic/apyrimidyl endonuclease 1; TNBC: triple-negative breast cancer.
APE1 and clinicopathological parameters in TNBC
In 108 patients with TNBC, Fisher’s exact test also found that higher expression of APE1 was more likely to occur in larger tumor loads (p = 0.0119, Table 2).
Relationship between APE1 and clinicopathological characteristics in TNBC.

APE1: apurinic/apyrimidyl endonuclease 1; TNBC: triple-negative breast cancer.
p < 0.05 was considered to be statistically significant and the bold-faced value means p < 0.05.
The influence of APE1 expression on the prognosis of patients with TNBC
Apart from 15 patients who could not be followed up, the APE1 expression and prognosis of patients with TNBC were analyzed. The median survival time of low and high APE1 expression group was 82.00 and 66.9 months, respectively. The overall survival of the low APE1 expression group was significantly higher than high APE1 expression group (p = 0.0054, Figure 2). Further analysis using the Cox proportional hazards regression model revealed that APE1 expression was an independent predictor of overall survival in patients with TNBC (p = 0.040, Table 3).

Survival curve of TNBC patients.
Cox proportional hazards regression model analysis results of TNBC patients.
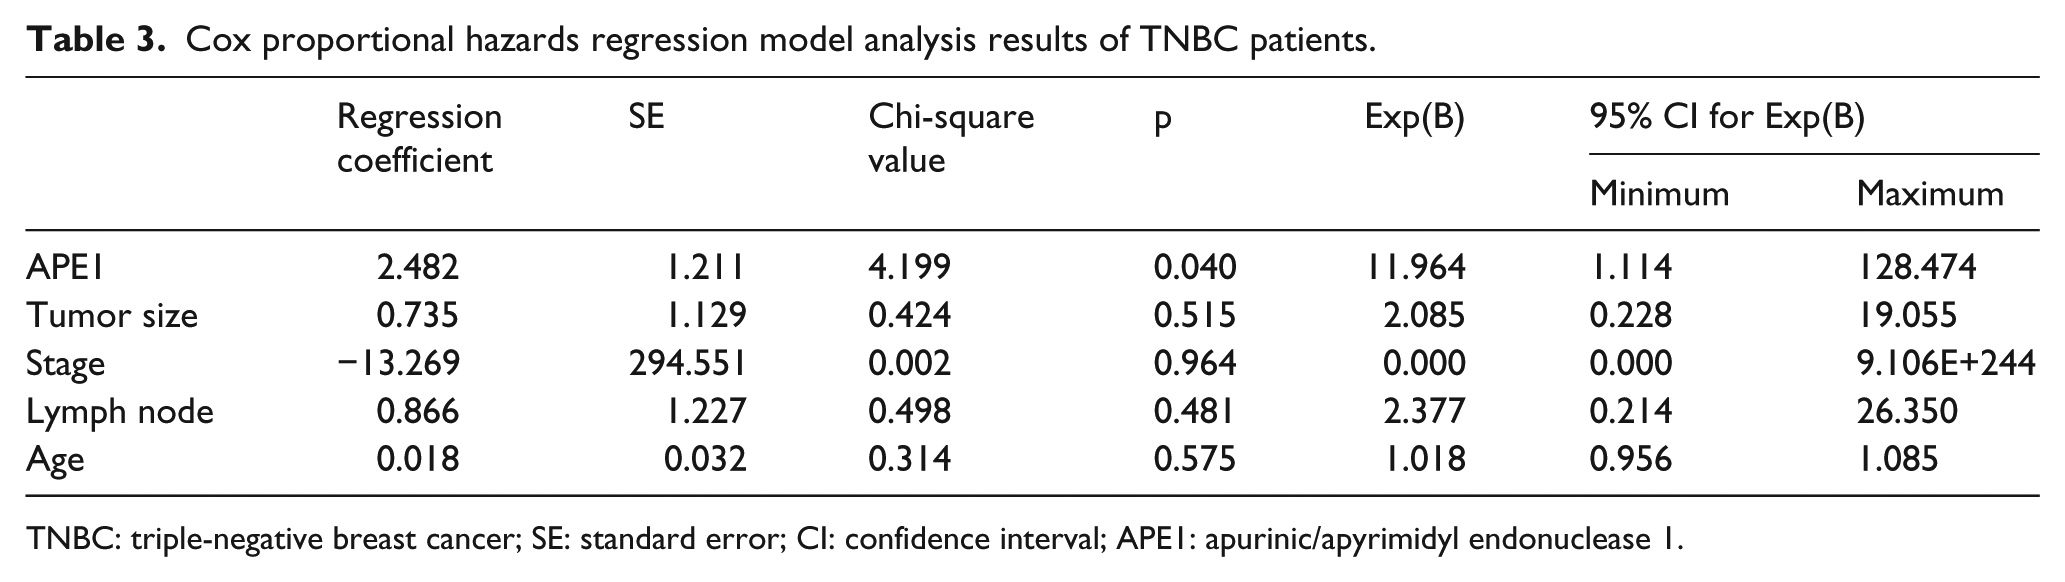
TNBC: triple-negative breast cancer; SE: standard error; CI: confidence interval; APE1: apurinic/apyrimidyl endonuclease 1.
APE1-knockout and wild-type HCC1937
Untreated wild-type and APE1-knockout HCC1937 (TNBC cells) were cultured for 5 days, and the growth curve shown below suggested that there was no significant difference between the two kinds of cells (Figure 3).

Growth curves of HCC1937 (WT) and HCC1937-APE1-KO (KO). (a) WT represents HCC1937 and KO represents HCC1937-APE1-KO. They were not treated with drugs, and OD value was measured by CCK-8 for 5 days. (b) Group t test result of data presented in (a), and there was no significant difference between them. The above results represent three independent experiments.
The IC50 of cisplatin for 72 h on HCC1937 and HCC1937-APE1-KO was found to be 0.525 μM and 0.458 μM, respectively. There was no statistically significant difference between them, indicating that BRCA mutant cell is sensitive to cisplatin and APE1-knockout will not affect the sensitivity (Figure 4(a) and (b)).

Sensitivity of HCC1937, HCC1937-APE1-KO, and HCC1937-RES cell lines to different drugs (WT: HCC1937; KO: HCC1937-APE1-KO; RESCUE: HCC1937-RES). (a) WT and KO were treated with cisplatin for 72 h, and inhibition rate was calculated. (b) Group t test result of data presented in (a), and there was no significant difference between them. (c) WT and KO were treated with 20 μM of olaparib for 5 days, and the OD value was detected daily using CCK-8. (d) Group t test result of data presented in (c). (e) WT, KO, and RESCUE were treated with 20 μM of olaparib for 5 days, and OD value was detected daily using CCK-8. (f) Group t test result of data presented in (e) (*p < 0.05, **p < 0.01, *** p < 0.001, and ****p < 0.0001). The above results represent three independent experiments.
Growth curves showed that olaparib had 68% and 27% inhibition on wild-type and APE1-knockout HCC1937 on the day 5, demonstrating that PARP1 inhibitor is more effective against wild-type HCC1937 (Figure 4(c) and (d)). Then, APE1-knockout HCC1937 was transfected with APE1 plasmid and stable HCC1937-RES was screened out. The growth curves of HCC1937-RES and HCC1937 showed similar sensitivity to olaparib, indicating that APE1 was correctly knocked out in this experiment and eliminated the possibility of off-target (Figure 4(e) and (f)). IC50 results showed that the IC50 of olaparib for HCC1937-APE1-KO was significantly increased compared with HCC1937, indicating that wild type is more sensitive to PARP1 inhibitor (Figure 5).
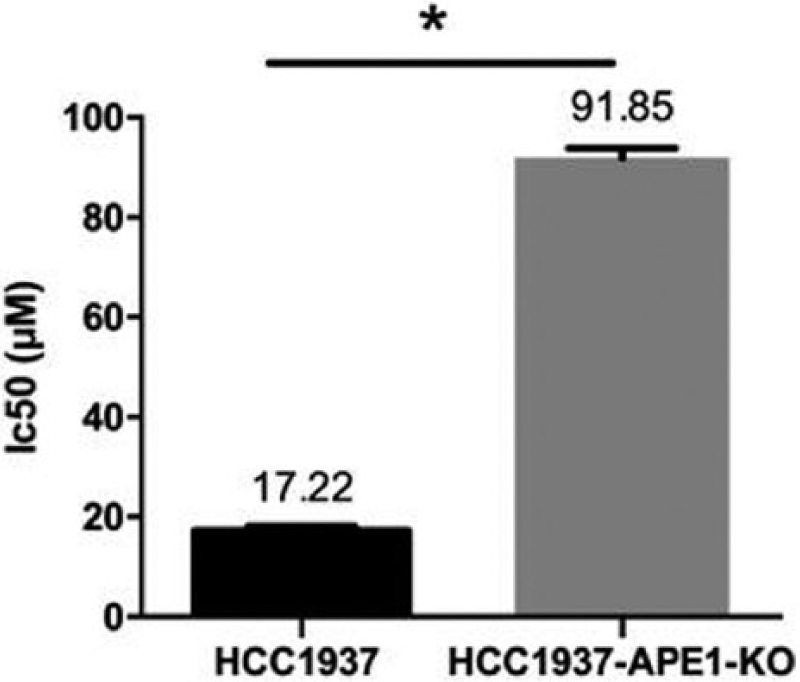
IC50 of olaparib for HCC1937 and HCC1937-APE1-KO using group t test (*p < 0.05).
Thereafter, olaparib caused more evident mitotic G2/M block after 72 h treatment on HCC1937, while no significant change was found in HCC1937-APE1-KO (Figure 6(a)). After being treated with 40 μM of olaparib, the apoptosis rate of HCC1937 was significantly increased compared to HCC1937-APE1-KO (Figure 6(b)). The above data show that olaparib had a stronger killing effect in wild-type HCC1937, while knocking out APE1 may cause resistance to olaparib.

Apoptosis and cell cycle arrest induced by olaparib (AZD2281) in HCC1937 and HCC1937-APE1-KO cell lines. (a) HCC1937 and HCC1937-APE1-KO cell lines were treated with 40 μM of olaparib for 72 h. Cell apoptosis was measured by flow cytometry with Annexin V-FITC/PI and PI staining. (b) Apoptotic rates of HCC1937 and HCC1937-APE1-KO after olaparib treatment were compared using group t test. The above results repeated for three times (*p < 0.05).
Endogenous expression of APE1 and PARP1
To find endogenous expression of APE1 and PARP1, different concentrations of PARP1 inhibitor olaparib (AZD2281) and cisplatin were set for HCC1937 (TNBC cells). APE1 expression decreased when treated with 10 μM of olaparib (Figure 7(a) and (c)). In HCC1937-APE1-KO, the expression of endogenous PARP1 was also less than that of wild-type HCC1937 (Figure 7(b) and (d)). These results indicated that endogenous APE1 and PARP1 could regulate each other.

Relationship between the expression of APE1 and PARP1 in HCC1937 and HCC1937-APE1-KO cell lines. (a) HCC1937 cells were treated with 0.8 μM of cisplatin, 5 μM of olaparib (AZD2281), 10 μM of olaparib, or 15 μM of olaparib for 48 h. The expression of APE1 was assessed by western blotting. DMSO and β-actin were used as controls. (b) Expression of endogenous PARP1 in HCC1937 and HCC1937-APE1-KO cell lines using western blotting. (c) The bar chart of APE1/β-actin (*p < 0.05 vs lane 1). (d) The bar chart of PARP1/β-actin (*p < 0.05 vs HCC1937). The above results repeated for three times.
Discussion
Cancer is a disease that is caused by multiple gene mutations which may result in abnormal expression of proteins related to DNA repair. When the DNA chain cannot be repaired immediately, the accumulation of DNA damage can finally lead to tumorigenesis. Quite a number of DNA repair genes have been linked to the onset of cancer, and the most common one is BRCA1 in breast cancer. 8 APE1 is also a DNA repair gene located on human chromosome 14 q11.2-12 with four introns and five exons. It has two main functions: acts as a key enzyme in BER and a coactivator of transcription factors in redox reaction.
Olaparib, one of the PARP inhibitors, has recently been approved by the Food and Drug Administration (FDA) in patients with advanced and BRCA-mutated ovarian cancer as monotherapy. However, the results of PARP1 inhibitor in patients with TNBC, containing a proportion of BRCA mutations, are not satisfactory. As APE1 and PARP1 are both important enzymes in BER, we speculated that APE1 may be one key gene that may affect the efficacy of PARP1 inhibitors.
To verify our idea, first, the expression of APE1 was examined in TNBC tissues, and results showed APE1 expression in TNBC was significantly higher than adjacent tissues (85.6% vs 14.4%). In TNBC, high expression of APE1 was more likely to occur in larger tumor group, which means a poor prognosis. Moreover, APE1 expression was closely related to overall survival (the median survival time was 82.0 months for low APE1 expression group, while it was 66.9 months high expression group, p = 0.0054). Our results suggested that APE1 overexpression was associated with more malignant clinical manifestations in TNBC, and detecting its expression level may be an early biomarker of breast cancer.
Our previous study has shown that APE1 suggested poor prognosis in breast cancer, which was similar to the studies in non–small cell lung cancer 6 and liver cancer. 7 As PARP1 and APE1 are both key enzymes of BER, the expression of APE may affect the efficacy of PARP1 inhibitor. To explore this project, we established a stable APE1-knockout cell line HCC1937 by CRISPR/Cas9 system.
The results showed that PARP1 expression was lower in APE1-knockout HCC1937 than in wild type, indicating that the expression of endogenous PARP1 reduced as APE1 decreased, and the two factors may have a lot of cooperation in the BER. Moreover, after adding olaparib in HCC1937, it was detected that APE1 decreased more obviously with the increase of olaparib. However, APE1 expression in cisplatin group did not change significantly, which indicated that APE1 expression reduced as PARP1 decreased and APE1 changed only when olaparib was used. As we considered APE1 and PARP1 to be interdependent, IC50 was measured by CCK-8 experiment. APE1-knockout has resulted in increase in IC50 of olaparib significantly compared with wild type, indicating that wild type was more sensitive to PARP1 inhibitor. However, IC50 of cisplatin did not show much difference in those two kinds of cells, which may be due to the reason that BRCA-mutated HCC1937 itself was too sensitive to cisplatin that it was hard to reflect the variety of sensitivity. Although there was no significant difference in growth curve of APE1-knockout HCC1937 and the wild-type one, APE1-knockout cell was inhibited more apparently than wild-type cell after the addition of olaparib, also illustrating that knocking out APE1 makes a negative effect on drug sensitivity of olaparib. Then, the conclusion had been verified by flow cytometry, wild-type HCC1937 treated with olaparib resulted in more obvious G2/M arrest than control group, and APE1-knockout cell showed no significant changes. After treatment with 40 μM of olaparib, the percentage of apoptotic cells of wild-type HCC1937increased more significantly than HCC1937-APE1-KO. The data above showed that the use of PARP1 inhibitor in wild-type HCC1937 has better effect, while APE1-knockout may develop resistance to olaparib. According to the results, it is presumed that APE1 and PARP1 in BER may be assisting each other, and one’s function and expression will reduce when the other one is cut down.
Published literatures suggest that the mechanism of interaction between APE1 and PARP1 may be as follows: PARP1 binds to AP (apurinic/apyrimidinic) site to recruit downstream repair protein in BER, while APE1 cuts a basic site in DNA skeleton to remove AP site so that the replication fork can continue. A study found that APE1 expression will reduce after knocking down PARP1 in HeLa cell and PARP1 expression also reduced when APE1 was knockdown. 9 It was also found that the RNA expression of APE1 cannot be detected in extraction of PARP1−/− MEF. These experiments proved that APE1 and PARP1 have a collaborative relationship. Recent study of Khodyreva et al. 10 showed that purified APE1 strongly activated PARP1 self-poly-ADP-ribosylation synthesis and concluded that the combination of PARP1 on AP site can recruit APE1 and protect the site until APE1 start AP site resection. To explore the specific site, Peddi et al. 11 found that Arg177, an unique protein in mammalian APEs, was extremely important for APE1. Wild-type APE1 prevented PARP1 from binding to DNA damage site in cells, while R177A mutated APE1 protein could not inhibit PARP1’s binding. In summary, PARP1 and APE1 cooperate with each other in BER and PARP1 binds to AP site to protect this site until APE1 arrives.
Above all, our study found in BRCA1-mutated TNBC cell lines, knocking out APE1 will cause drug resistance to olaparib. It suggests that patients may be needed to detect expression of APE1 before using olaparib. Based on the outcomes of clinical trials so far, only a limited number of studies have shown that APE1 was related to survival time, we still expect to use this key site to kill breast cancer cells. APE1 inhibitors are currently being developed and some are in clinical trials.
Undeniably, APE1 gene is a tumor-associated hotspot in recent years, and its abnormal expression in a variety of tumors has been verified. APE1 is a crucial gene in BER, and its function affects the drug sensitivity of PARP1 inhibitor. As the targeted population of PARP1 inhibitors remain to be explored, APE1 is worth to develop its potential value in the treatment of breast cancer.
Footnotes
Acknowledgements
Tianran Chen, Chuan Liu, and Heng Lu contributed equally to this work and are co-first authors.
Declaration of conflicting interests
The author(s) declared no potential conflicts of interest with respect to the research, authorship, and/or publication of this article.
Funding
The author(s) disclosed receipt of the following financial support for the research, authorship, and/or publication of this article: This study was supported by Natural Science Foundation of the People’s Republic of China (No. 81372854 and No.81572591). The funders had no role in study design, data collection and analysis, decision to publish, or preparation of the manuscript.