
Abstract
Endometrial cancer is the most common gynecologic malignancy, about 80% of which is endometrial endometrioid carcinoma. Dysregulation of spindle assembly checkpoint plays a vital role in endometrial endometrioid carcinoma tumorigenesis and progression. The purpose of this study was to explore how tyrosine threonine kinase, a spindle assembly checkpoint–related protein, promotes the endometrial endometrioid carcinoma progression. We found that both messenger RNA and protein levels of tyrosine threonine kinase in endometrial endometrioid carcinoma tissues are higher than those in normal endometrial tissues, and its expression is associated with tumor stages. Genetic depletion of tyrosine threonine kinase by RNA interference in two endometrial endometrioid carcinoma cell lines significantly inhibits cell proliferation and induces apoptosis. Mechanistically, depletion of tyrosine threonine kinase induces G2/M cell cycle arrest and triggers caspase-dependent cell apoptosis. Collectively, tyrosine threonine kinase is significantly upregulated in endometrial endometrioid carcinoma, and downregulation of tyrosine threonine kinase can suppress endometrial endometrioid carcinoma cell proliferation and promote apoptosis via G2/M cell cycle arrest. Our study demonstrates that tyrosine threonine kinase can be a potential therapeutic target for endometrial endometrioid carcinoma treatment.
Keywords
Introduction
Endometrial cancer is the most common gynecologic malignancy, and about 80% of these cancers are endometrial endometrioid carcinoma (EEC).1,2 Multiple genes have been reported to play essential roles in EEC initiation and progression, but the underlying molecular mechanisms are still unclear.3,4 Our previous study demonstrated a novel pathway, miR193-5p-YY1-APC, involved in EEC progression, 5 and subsequently we also uncovered that PCDH10-Wnt/β-catenin-metastasis associated lung adenocarcinoma transcript 1 (MALAT1) pathway regulates EEC development. 6 More recently, we found that PCDH10-DEPDC1-caspase signaling may be a novel regulatory axis in EEC carcinogenesis. 7 We speculated that there might be other unknown oncogenic or tumor suppressive factors, regulated by PCDH10, that promote EEC development.
We previously did a whole genome RNA-sequencing screening and found several potential downstream targets of PCDH10, 7 including tyrosine threonine kinase (TTK). TTK, also known as monopolar spindle 1 (Mps1), is a dual specificity kinase that phosphorylates both tyrosine and serine/threonine residues. 8 TTK was first identified in a yeast genetic screen, and silencing of this gene in the spindle pole body (SPB) led to an aberrant monopolar spindle. 9 TTK is one of the spindle assembly checkpoint (SAC), and it facilities the alignment of chromosomes on the metaphase plate in mitosis, 10 which is associated with cell cycle progression. TTK is critical for the correct alignment of all chromosomes and subsequently proper attachment to the mitotic spindle.11,12 The upregulation of TTK has been found in different cancer types including anaplastic thyroid carcinoma (ATC), breast cancer, human hepatocellular carcinoma (HCC), and pancreatic ductal adenocarcinoma (PDAC),13–16 which suggests it may act as an oncogene in these cancers. The upregulation of TTK was associated with cell proliferation and chromosomal instability in ATC. 13 Consistently, in PDAC, the loss of TTK resulted in genomic instability and chromosomal missegregation. On the contrary, knockdown of TTK inhibited cell growth and induced cell apoptosis in PDAC. 14 In addition, it has been reported that high levels of TTK correlated with high histological grade, and knockdown of TTK resulted in remarkable decreased cell growth and increased cell death in breast cancer. 15 The potential reason may be that high levels of TTK indirectly inhibited apoptosis by hyperactivating BubR1, which has been shown to suppress caspase activities.17,18 Liu et al. 16 reported that TTK promoted HCC cell proliferation, while using TTK inhibitor, HCC cell growth was decreased. Collectively, these studies suggest that TTK plays key roles in tumorigenesis and may serve as a novel target for diagnosis and/or therapy in multiple human cancers. However, to our best knowledge, the TTK expression levels and its role in EEC are still unknown.
In this study, we found that TTK is significantly upregulated in EEC cell lines as well as human EEC tumors. Functional study demonstrated that knockdown of TTK inhibits EEC cell growth as well as induces cell apoptosis in EEC cell lines (AN3CA and HEC-1-B). Furthermore, we investigated the clinical significance and prognostic value of TTK in EEC.
Materials and methods
Cell culture
Human endometrial cancer cell lines, AN3CA, HEC-1-B, HEC-1-A, KLE, and RL95-2, were obtained from American Tissue and Cell Culture (ATCC, Rockville, MD, USA) and cultured as recommended.
Tissue samples
Tissue samples were obtained from December 2014 to December 2015, from the Department of Obstetrics and Gynecology of the Affiliated Hospital of Guilin Medical University. Four groups of samples were collected: normal endometrium (n = 33), endometrial hyperplasia without atypia (n = 16), endometrial atypical hyperplasia (n = 21), and endometrial cancer (n = 63). Normal endometrial tissue specimens were obtained from women who underwent hysterectomy or endometrial curettage for endometrial-unrelated diseases, such as uterine myoma or prolapse. Clinical staging was performed according to the International Federation of Gynecology and Obstetrics (FIGO) criteria. The Clinical Research Ethics Committee of the Affiliated Hospital of Guilin Medical University approved all the specimens obtained, clinical information collected, and experimental procedures conducted. Five normal endometrium tissues were snap-frozen in liquid nitrogen for further western blot analysis, with the rest for immunohistochemistry (IHC).
Oligonucleotides and transfection
Small interfering RNAs (siRNAs) against TTK or control oligos were obtained from GenePharma (Shanghai, China). In each case, the concentration for transient transfection was 100 nmol/L. The oligonucleotides for TTK silencing were synthesized as follows—5′-GUGGCAGAGAAUUGACAAUTT-3′ (forward) and 5′-AUUGUCAAUUCUCUGCCACTT-3′ (reverse). All the transfection was done using Lipofectamine 2000 (Invitrogen, Carlsbad, CA, USA) according to the manufacturer’s instructions.
Reverse transcription and real-time polymerase chain reaction
Total RNA was extracted using TRIzol Reagent (Invitrogen, Carlsbad, CA, USA) according to the manufacturer’s instructions. NanoDrop 2000 (Thermo Fisher Scientific, Waltham, MA, USA) was utilized to quantify the extracted RNA concentration. Reverse transcription (RT) reaction was performed using M-MLV Reverse Transcriptase (Promega, Madison, WI, USA). For the quantitative real-time polymerase chain reaction (PCR), the relative messenger RNA (mRNA) level of TTK was normalized against glyceraldehyde 3-phosphate dehydrogenase (GAPDH) in each sample. All reactions were performed in triplicate using ABI PRISM7900HT Real Time System and SYBR green dye (TaKaRa, Otsu, Japan). The primer sequences were as follows—5′-TCAAGGAACCTCTGGTGTCA-3′ (forward) and 5′-GGTTACTCTCTGGAACCTCTGGT-3′ (reverse).
Western blotting
Cells were lysed in lysis buffer (50 mM Tris (pH 7.4), 0.1% sodium dodecyl sulfate (SDS), 1 mM ethylenediaminetetraacetic acid (EDTA), and protease inhibitor cocktail (Sigma-Aldrich, St Louis, MO, USA). Samples were loaded to 10% SDS–polyacrylamide gel electrophoresis (PAGE) and transferred onto nitrocellulose membranes. The blot was incubated with blocking solution (5% nonfat milk and 0.05% Tween 20 in phosphate-buffered saline (PBS)) for 1 h at room temperature, then incubated with primary antibodies for overnight at 4°C, and then with secondary antibody for 1 h. The specific primary antibodies were as follows—anti-TTK (dilution: 1:1000; Abcam, Cambridge, UK), anti-PARP (1:1000; #9541s; Cell Signaling Technology, CST, USA), anti-caspase-3 (1:750; #ab44976; Abcam), anti-BCL-2 (1:800; Proteintech, Wuhan, China), anti-Bax (1:800; Proteintech), β-actin (1:1000; #TA09; ZSGB-BIO, Beijing, China), and α-tubulin (1:2000; #sc-23948; Santa Cruz, CA, USA). The immunostaining signal of protein was visualized with imaging system (ABI, Thermo Fisher Scientific, USA).
IHC
TTK expression was determined by immunohistochemical staining as described previously. 19 IHC on paraffin-embedded sections was performed using following antibody—TTK (1:200; #ab11108; Abcam).
H-score analysis
The intensity of TTK expression in endometrial sections was graded and calculated as previously. 6 Briefly, histochemical score (H-score) = ΣPi (i + 1), where i was the intensity of staining (0 = negative, 1 = weak, 2 = moderate, and 3 = strong), and Pi was the percentage of cells stained at each intensity (0%–100%). The H-scores were measured in glandular epithelium. Two pathologists scored the sections independently. In the event of discrepancies in scores, slides were re-examined and agreed on by both observers. The final scores for TTK staining in each endometrial compartment were obtained by taking the mean of the agreed-on scores for each compartment (glandular epithelium). The Ki67 staining data were from the pathological reports. The Ki67 positive rate below 10% was defined as Ki67 staining negative, otherwise defined as Ki67 staining positive.
MTS assay
CellTiter 96® AQueous One Solution Cell Proliferation Assay ((3-(4,5-dimethylthiazol-2-yl)-5-(3-carboxymethoxy phenyl)-2-(4-sulfophenyl)-2H-tetrazolium) (MTS), Promega) was used to detect the cell proliferation rate. Cells (5×10³ per well) were cultured on 96-well plate. After 48 h of transfection, 20 µL of the CellTiter 96 AQueous One Solution Reagent (Promega) was added to each well and incubated for 4 h at 37°C. The absorbance at 490 nm was measured using an uQuant Microplate Reader (Bio-Tek Instruments, Winooski, VT, USA). All experiments were performed in triplicate.
Immunofluorescence
The immunofluorescence (IF) staining procedures were similar with the IHC staining. IF on paraffin-embedded sections was performed with the following antibodies—Ki67 (1:100; Santa Cruz Biotechnology) and P-H3 (1:200; Cell Signaling Technology). However, the secondary antibody was fluorescent labeled (donkey anti-goat Alexa Fluor 594 (#ab150132; Abcam) and donkey anti-rabbit Alexa Fluor 488 (#ab150061; Abcam)). The samples were incubated with the secondary antibody in room temperature andkept in the dark for 1 h. The sections were subsequently mounted with 4′,6-diamidino-2-phenylindole dihydrochloride (DAPI; Roche, Mannheim, Germany) to stain the nuclei and preserve fluorescent signals. The fluorescent signals were analyzed with fluorescence microscopy (Olympus BX50, Hamburg, Germany) and digitally photographed. All samples were imaged with the 400× objective lens.
Fluorescence-activated cell sorting analysis
For cell apoptosis analysis, Annexin V/7-aminoactinomycin D (7-AAD) apoptosis assay kit (eBioscience, San Diego, CA, USA) was used following the protocol provided by the cell apoptosis manufacturer. Cells seeded on a six-well plate were transfected with siRNA. After 48 h of transfection, the cells were harvested and washed twice with cold PBS and re-suspended for binding at a concentration of 1 ×10⁶ cells/mL. Fluorochrome-conjugated Annexin V (5µL) and 7-AAD Viabiliity Staining Solution (5µL) were added into prepared cell suspension, and the mixtures were incubated for 20 min at room temperature in dark. The fluorescence of 10,000 cells was determined using the flow cytometry (BD FACSAria™ III, BD Biosciences, San Jose, CA, USA). For cell cycle analysis, Cell Cycle and Apoptosis Analysis Kit (#C1052; Beyotime, Haimen, China) was used. Cells were fixed with 70% ethanol, treated with RNase, stained with propidium iodide, then sorted and quantified with the flow cytometer (BD FACSAria™ III).
Statistical analysis
The statistical analyses were performed using SPSS 18.0 software (SPSS, Chicago, IL, USA). The two-tailed Student’s t test was used to evaluate the significance of quantitative variables. The bar charts were drawn using GraphPad Prism version 5.01 (GraphPad Prism Version 5.01, Inc., San Diego, CA, USA). All data were expressed as mean ± standard error of the mean (SEM) or mean ± standard deviation (SD), as appropriate. Differences were considered as significant when p < 0.05.
Results
TTK is upregulated in EEC cells and tumors
To explore its role in EEC development, we first examined TTK expression in five EEC cell lines, AN3CA, HEC-1-B, HEC-1-A, RL95-2, and KLE by quantitative RT-PCR (qRT-PCR) using microdissected normal endometrial tissues as normal control (NC). Our data showed that TTK was significantly upregulated in all the five EEC cell lines compared with the normal tissues (Figure 1(a)). We then measured the protein level of TTK by western blotting. Consistently, TTK was also upregulated in EEC cell lines (Figure 1(b)). Furthermore, immunohistochemical detection of TTK was performed on paraffin-embedded sections of 33 normal specimens, 16 endometrial hyperplasia without atypia, 21 endometrial atypical hyperplasia, and 63 EEC tissues. The signals from TTK staining are classified as weak, moderate, or strong (Figure 1(c)). Besides, TTK signals increase along with the sequence that normoal endometrium (NE), endometrial hyperplasia without atypia, endometrial atypical hyperplasia, and EEC according to TTK H-scores (Figure 1(d)). Collectively, the above results suggested that TTK was upregulated in EEC lines and primary tumors, which indicated that TTK may promote EEC development.

TTK is overexpressed in EEC cell lines and primary tumors. (a) Expression of TTK in five EEC cell lines using three microdissected normal (N) endometrial tissues as control. (b) Expression of TTK in above samples with beta-actin as control. (c) Detection of TTK expression with IHC in paraffin-embedded sections of normal endometrial specimens, endometrial hyperplasia without atypia, endometrial atypical hyperplasia, or EEC. Representative images for different levels of staining signals (negative from normal tissue, weak endometrial simple hyperplasia, moderate endometrial complex hyperplasia, and strong from tumor tissues) were shown above (magnification = 400×; scale bar = 50 µm). (d) The H-scores of (1) TTK in normal endometrial specimens, (2) endometrial hyperplasia without atypia, (3) endometrial atypical hyperplasia, and (4) EEC were shown. Data were presented by box-whisker plot. The line within each box represents the median of TTK H-scores; the upper and lower edges of each box represent the 75th and 25th percentile, respectively; the upper and lower bars indicate the highest and lowest values, respectively (NS: not significant; ***p < 0.001).
Correlation between TTK expression and EEC clinicopathological features
We further investigated the correlation between TTK expression and EEC clinicopathological features. TTK H-scoring was positively correlated with an ascending FIGO stage (p = 0.000); however, no significant association was found between TTK H-score and other clinicopathological features, including grade, myometrium invasion, and lymph node invasion. Detailed results are shown in Table 1. In addition, we further analyzed the correlation between TTK H-score and Ki67 signals in endometrioid endometrial carcinoma. Interestingly, Ki67 signals were also positively correlated with higher TTK H-score (p = 0.035; Table 2).
The association between clinicopathological features and TTK staining score in human EEC.

TTK: tyrosine threonine kinase; EEC: endometrial endometrioid carcinoma; FIGO: International Federation of Gynecology and Obstetrics.
Sixteen tumors were not graded.
Correlation between Ki67 and TTK staining score in human EEC.

TTK: tyrosine threonine kinase; EEC: endometrial endometrioid carcinoma.
TTK promotes EEC cell proliferation
To further evaluate the oncogenic function of TTK on EEC progression, we examined the effect of TTK knockdown on EEC cell proliferation by siRNA transfection in AN3CA and HEC-1-B cells, with a nontargeting sequence (siNC) transfection as control. TTK protein level was significantly decreased in siTTK group compared with that of siNC group (Figure 2(a) and (b): left). Cell proliferation was then assessed by MTS assay, which revealed a decrease by 30% in siTTK group (siTTK vs siNC; Figure 2(a) and (b): right). This was strengthened by IF staining of Ki67, which revealed a 40% (Figure 2(c)) and 50% (Figure 2(d)) decrease of positively stained cells relatively, as well as IF staining of phospho-Histone3 (P-H3; Figure 2(e) and (f)). Altogether, these data demonstrated that TTK promoted EEC cell proliferation.
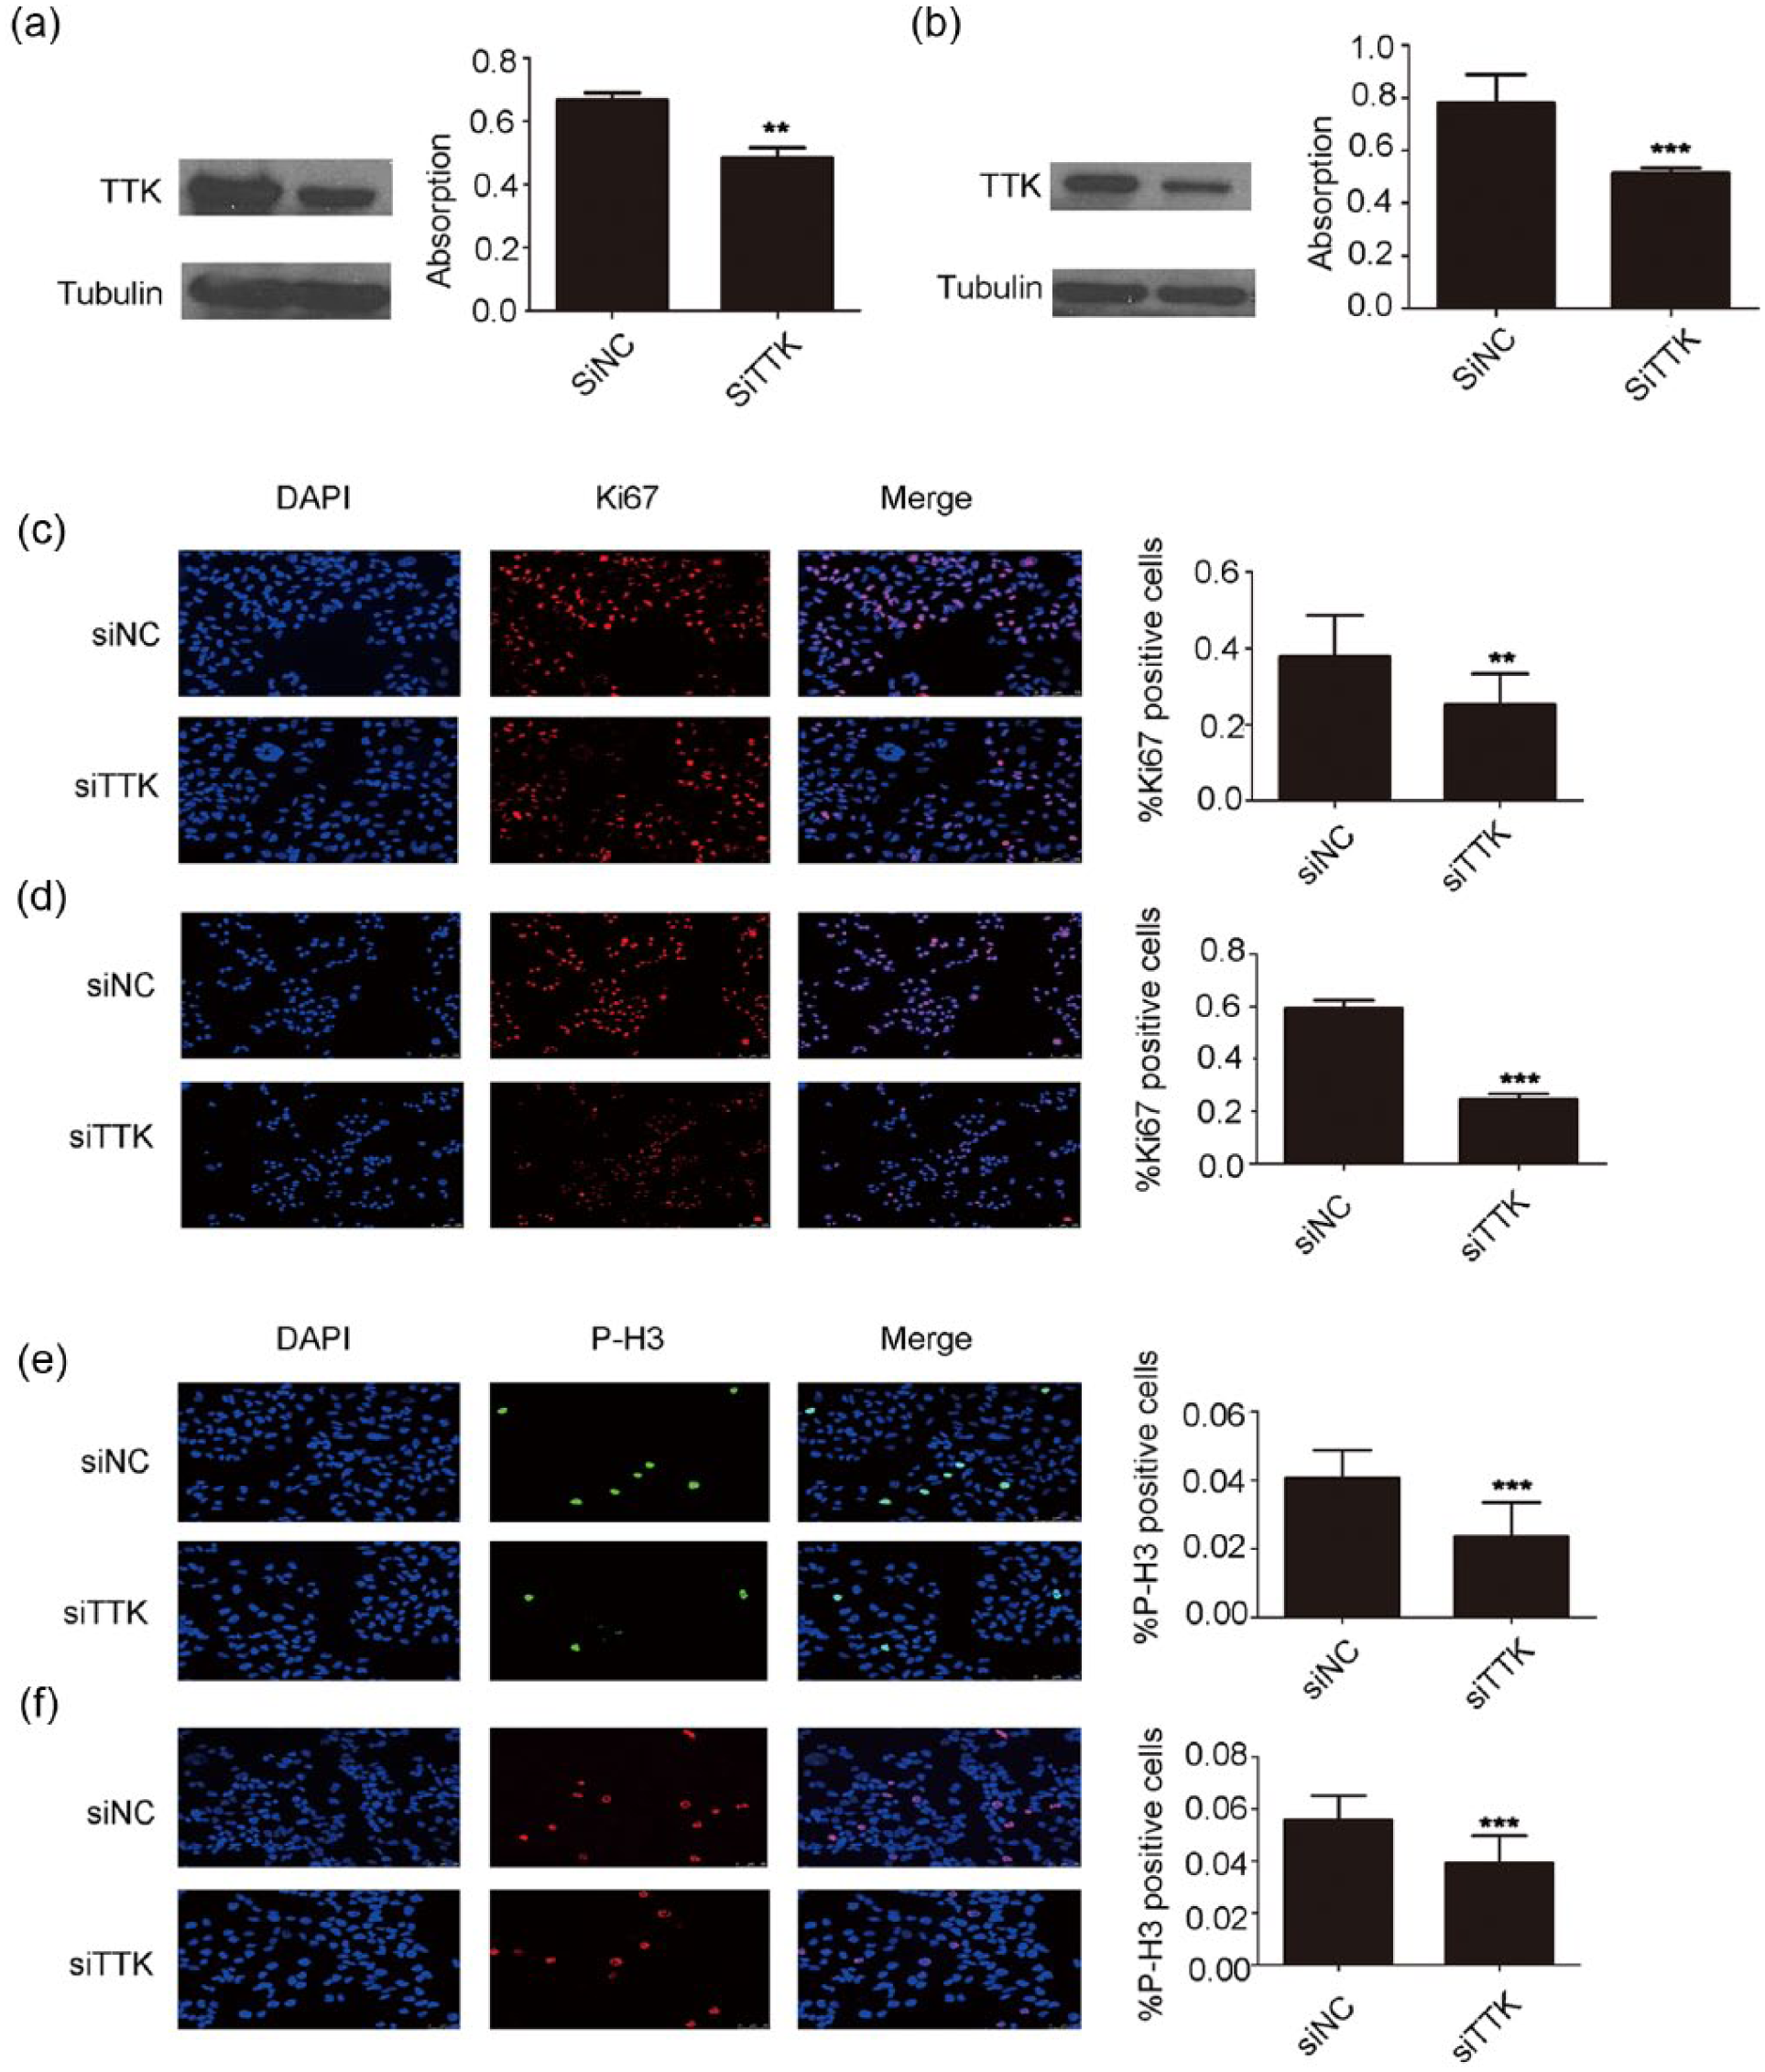
TTK promotes EEC cell proliferation. (a) Left: depletion of TTK by siRNA in AN3CA cells. Right: measurement of cell proliferation in siNC-or siTTK-transfected cells by MTS assay. The data are plotted as mean ± SD based on three independent experiments. (b) Knockdown of TTK by siRNA oligos inhibits HEC-1-B cell proliferation as revealed by MTS assay. (c and d) Left: IF staining of Ki67 was performed in siNC- or siTTK-transfected AN3CA and HEC-1-B cells, respectively, at 48 h after transfection. Right: Ki67 positively stained cells were shown as percentage of DAPI positive cells. (e and f) Left: IF staining of phospho-Histone3 (P-H3) was performed on siNC- or siTTK-transfected AN3CA and HEC-1-B cells, respectively, at 48 h after transfection. Right: cells stained by P-H3 positively were shown as percentage of DAPI positive cells. Data were plotted as mean ± SD (**p < 0.01; ***p < 0.001).
Knockdown of TTK induces apoptosis and cell cycle arrest in EEC cells
To determine how EEC cell proliferation was promotedby TTK, we first investigated TTK function on cell apoptosis. Annexin V–PE double staining revealed that downregulation of TTK reduced the alive cell population (Q3; Figure 3(a) and (b): right) while increased the late apoptotic population (Q2; Figure 3(a) and (b): right). The representative data were shown in Figure 3(c). Moreover, knockdown of TTK increased apoptosis markers like cleaved poly (ADP-ribose) polymerase (PARP) and caspase-3 (Figure 3(d)), demonstrated by western blotting. However, no significant differences were observed in bcl-2 and bax expression between siTTK and siNC groups in both AN3CA and HEC-1-B cell lines (Figure 3(d)). We next explored the effects of TTK on cell cycle. A significant delay in G2/M progression was observed in HEC-1-B and AN3CA cells (Figure 4). In sum, downregulation of TTK inhibits EEC cell proliferation and induces apoptosis via G2/M cell cycle arrest.
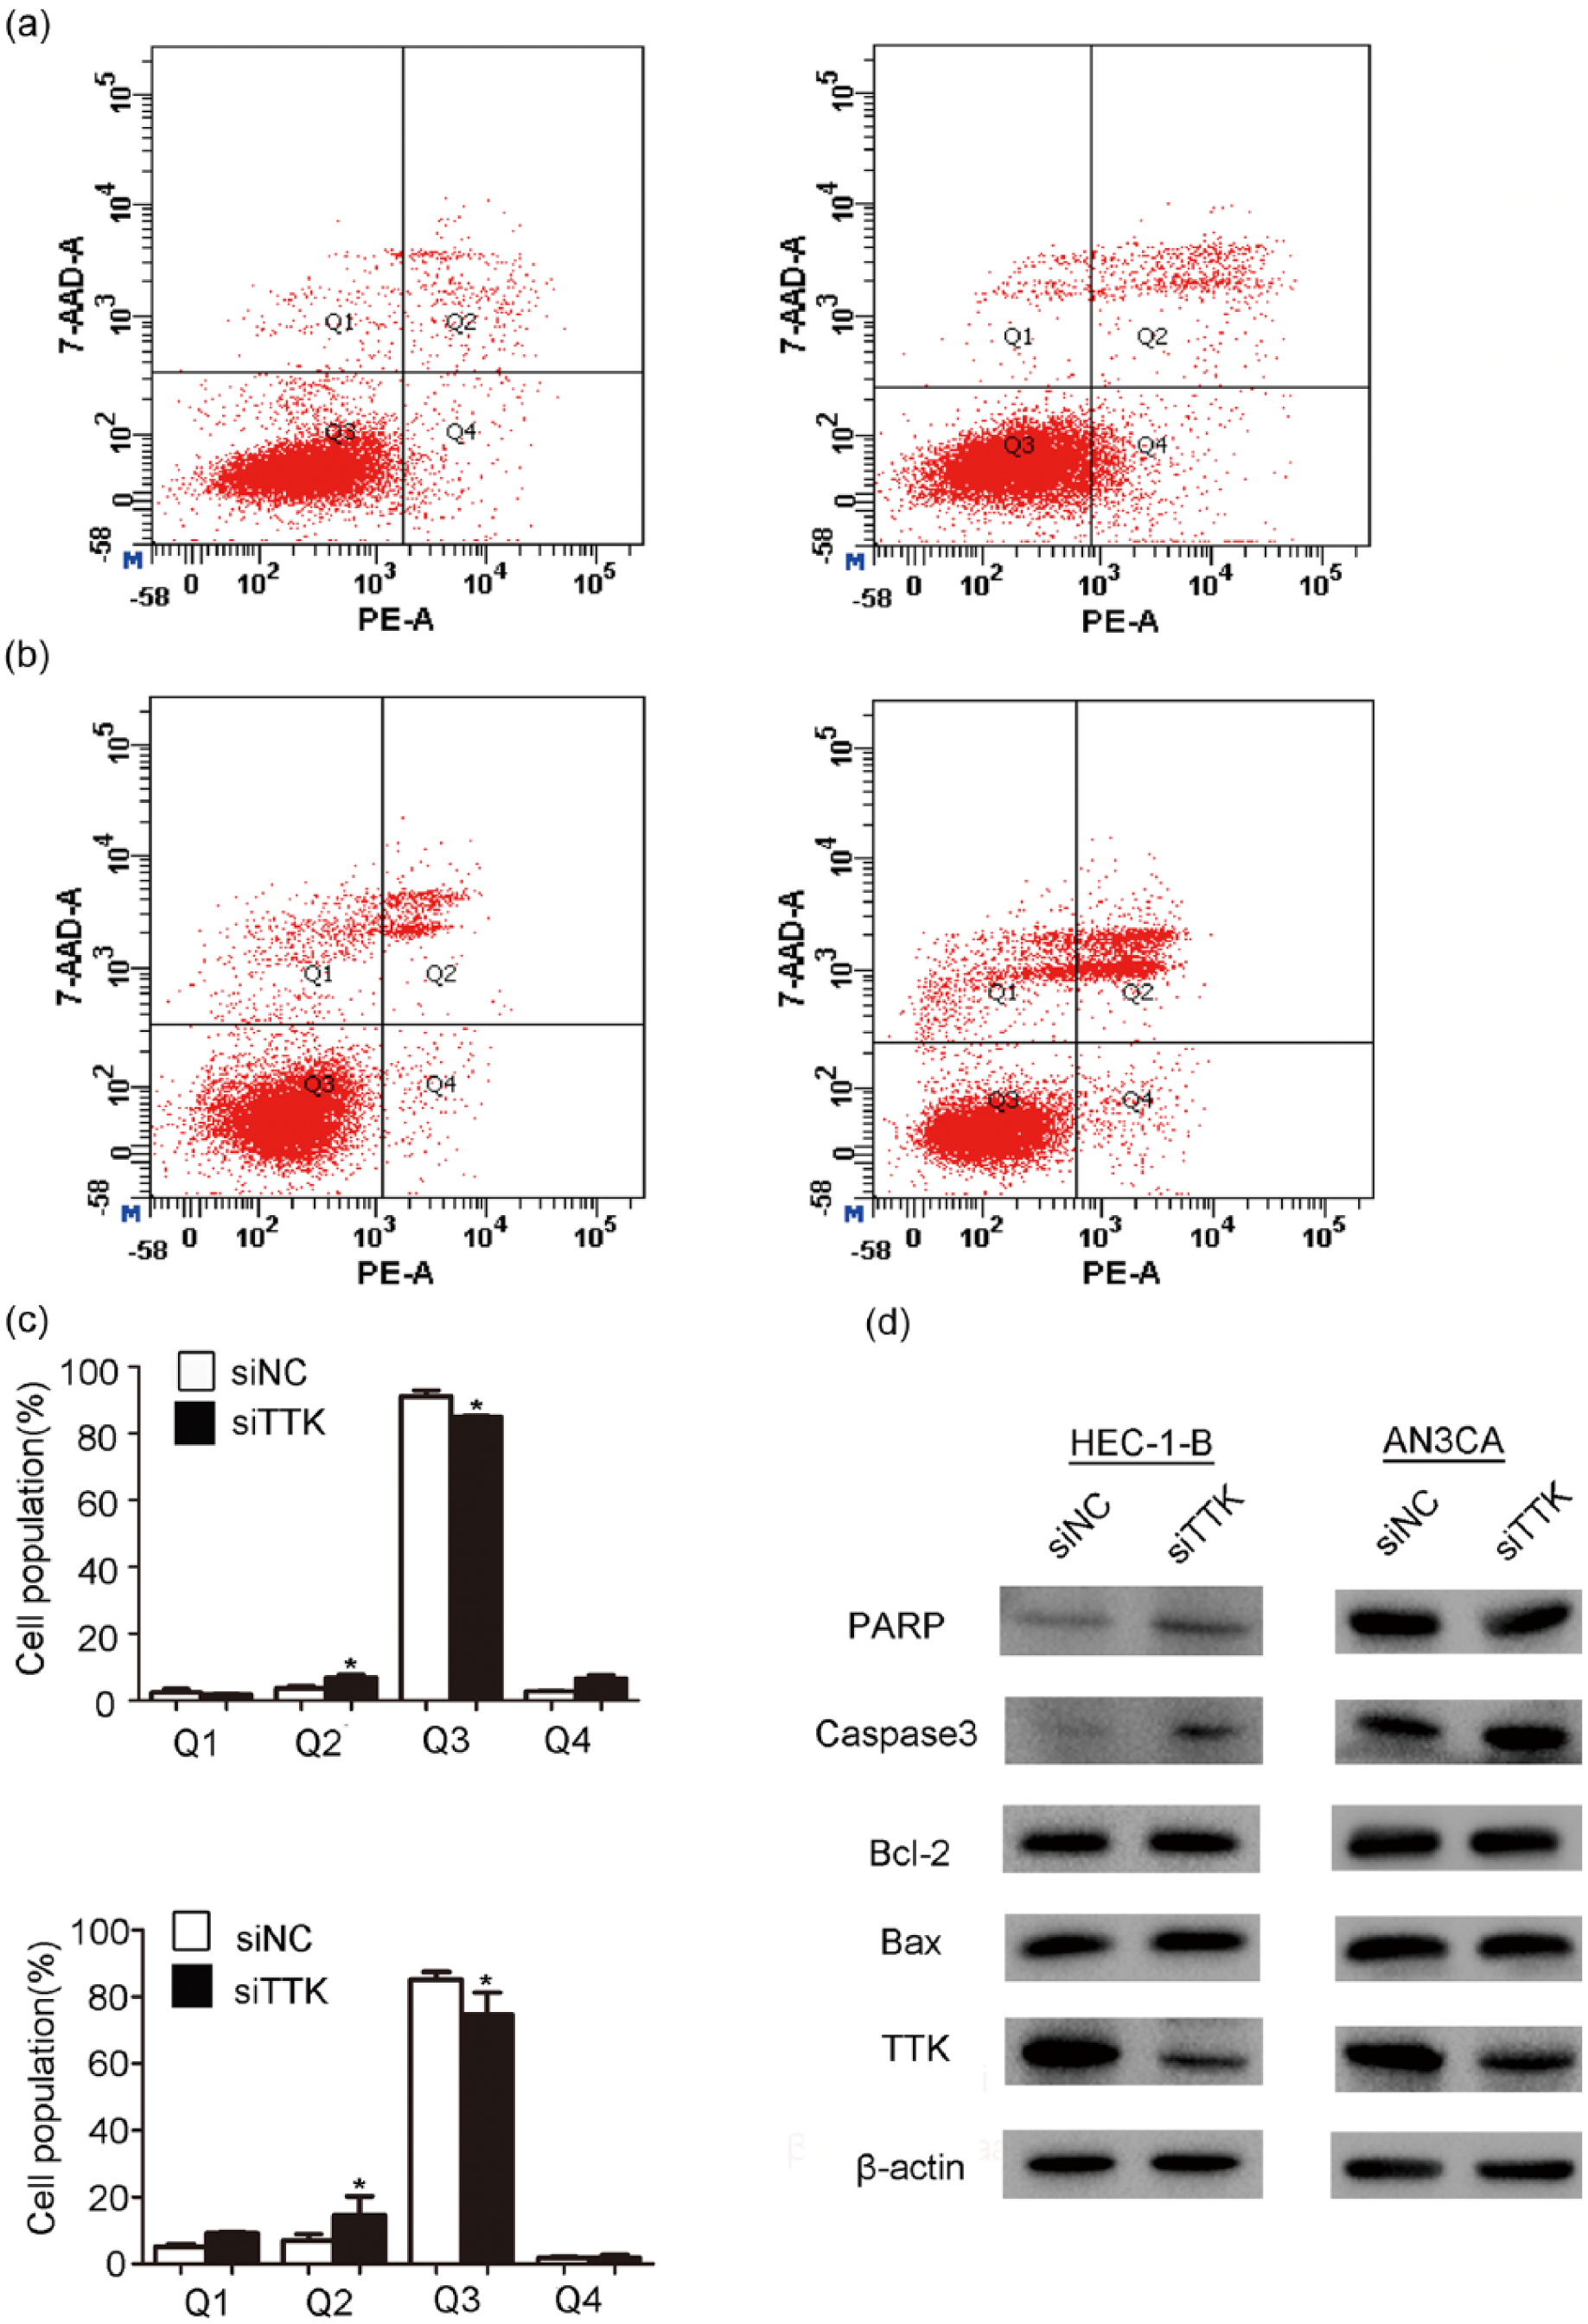
TTK induces EEC cell apoptosis. (a) Flow cytometry analyses were performed. AN3CA cells were stained with Annexin V/PE. (b) Flow cytometry analyses via Annexin V/PE staining in HEC-1-B cells. (c) Percentage of cells in each phase (Q1: necrotic cell, Q2: late apoptotic, Q3: viable, and Q4: early apoptotic) was calculated based on three independent experiments. Data are plotted as mean ± SD (*p < 0.05). (d) Western blotting was used to determine the protein expression levels of apoptotic factors at 72 h after siRNA transfection in AN3CA and HEC-1-B cells. Data are representative of at least three independent experiments. Beta-actin serves as loading control.

TTK induces cell cycle arrest. FACS determined relative cell numbers in each cell cycle phase. The PI staining was used to measure the cell cycle in AN3CA (top) and HEC-1-B (bottom) cells after transient inhibition of TTK. Data were plotted as mean ± SD (*p < 0.05).
Discussion
In this study, we showed that TTK was upregulated in both EEC cell lines and human EEC tissues, which indicates that TTK may be an oncogene in EEC development. Besides, high TTK expression level was associated with late EEC FIGO stage, but no significant association was observed with other clinicopathological features, such as grade, myometrium invasion, and lymph node invasion. Further functional studies demonstrated that knockdown of TTK inhibited cell growth and induced apoptosis via G2/M cell cycle arrest. Taking together, our data suggest that TTK contributes to EEC development and may be a potential therapeutic target for EEC treatment.
The expression pattern of TTK has been investigated across different cancer types, including thyroid carcinoma, breast cancer, lung cancer, PDAC, prostate cancer, melanoma, glioblastoma, medulloblastoma, and HCC,3–16,20–25 and TTK expression was upregulated in all these cancer types. Consistently, higher TTK levels were associated with poorer prognosis, including human HCC and breast cancer.21,26 In this study, we found that TTK expression levels were positively correlated with EEC FIGO stages. Miao et al. 27 found that TTK was significantly correlated with tumor grade and recurrence-free survival (RFS). Their study revealed that the median RFS was 3.53 months in TTK-high patients with recurrent HCC, whereas the median RFS was 12.48 months in TTK-low patients. Al-Ejeh et al. 28 reported that TTK mRNA expression levels were associated with age, tumor size, and tumor grade in breast cancer. Meanwhile, they found that high TTK protein levels significantly correlated with aggressive histological features, like pushing tumor border, nuclear pleomorphism, lymph node involvement, and higher mitotic scores. Here, we also showed that high TTK protein level was associated with high Ki67 expression in EEC, a well-known cell proliferation marker. Ki67 was a proliferation marker used in clinic in endometrial cancer. 29 Consistently, high TTK mRNA and protein levels were significantly correlated with high ki67 expression in breast cancer. 28
Several studies in different cancer types are focusing on the oncogenic functions and underlying mechanisms of TTK,13–16,20–25 and the most of these studies claimed that knockdown of TTK can inhibit cancer cell proliferation and induce cell apoptosis. Liang et al. 21 found that ectopic expression of TTK promoted HCC cell proliferation, while decreased TTK expression inhibited HCC cell growth. Similar results also came from the study by Liu et al.; 16 they found that there was significant demethylation on TTK promoter area in HCC samples and revealed that TTK oncogenic functions were dependent on Akt mediated pathways. These data were partly consistent with a recent study which claimed that knockdown of TTK efficiently inhibited HCC cell growth and decreased HCC cell aggressiveness, as well as increased cell senescence, death, and autophagy. 30 Meanwhile, Kaistha et al. 14 published that PDAC cell proliferation was significantly attenuated by TTK knockdown, whereas apoptosis was significantly increased, which suggested TTK shared common oncogenic activities among different cancer types. Consistently, the fraction of apoptotic cells was significantly increased in PDAC cells after being exposed to TTK inhibition. 31 Indeed, TTK inhibition had anti-proliferation effects on a variety of cell lines and xenograft tumors. 32 However, TTK kinase inhibitor significantly decreased medulloblastoma cell growth and increased apoptosis. 20 Our results confirmed that knockdown of TTK induced EEC cell apoptosis, which was also supported by a latest study showing that the apoptosis pathways were triggered after TTK inhibition, including the decrease of apoptotic factors such as Annexin A1, caspase-7, and GZMB (granzyme B) and the activation of mitochondrial-dependent apoptotic signaling pathways with releasing cytochrome c. 33 TTK was also involved in the apoptosis of p53-deficient cells after DNA damage, 34 while in ATC cells TTK transcriptional promoter is negatively controlled by p53. 13
In Sum, this study suggested that, in AN3CA and HEC-1-B cells, siTTK induced a G2/M arrest, which is shown in Figure 4. These data were supported by IF staining of P-H3 (Figure 2(e) and (f)), which indicated the late-G2/M cell cycle marker. 35 Consistently, previous studies showed that TTK is a critical regulator of mitosis in medulloblastoma, and TTK kinase inhibitor induced a G2/M arrest. 20 Also in ovarian cancer cells, there was a reduction in G1 phase and a flattening in G2/M phase when using TTK kinase inhibitor. 32
Despite the above findings, the detailed mechanisms of how TTK was involved in cancer proliferation and apoptosis were still unclear. One functional study in colon cancer cells demonstrated that TTK promoted tumorigenesis by increasing genome instability, 36 which was consistent with other study indicating that the TTK deletion in pancreatic cancer cells resulted in chromosomal missegregation. 14 It had been documented that chromosomal instability and aneuploidy were generally considered to promote carcinogenesis.37,38 Moreover, tetraploid cells were killed by TTK depletion that may be associated with the intrinsic apoptosis pathway activation, such as releasing the pro-apoptotic cytochrome c from mitochondria and activating caspases. 39 Further molecular studies in this field are still required.
A particular strength of our study was that we first examined TTK expression in EEC clinical samples and EEC cell lines. However, the potential weakness of this study was that we just analyzed the phenotypic changes in EEC, but the underlying molecular mechanisms were not elucidated in detail. Further studies are needed to evaluate the oncogenic effects of TTK in vivo in xenograft tumor mouse models. The mitotic functions of TTK kinases and their upregulation in some tumors have prompted the identification of Mps1 inhibitors, which can work as anti-cancer drugs. 8 Moreover, several new TTK inhibitors have been recently described, and some of them showed encouraging therapeutic effects in medulloblastoma, glioblastoma multiforme, HCC, and PDAC,16,20,31,40,41 with the mechanisms that they can arrest cancer cell proliferation by their polyploidization and their demise. 42 Therefore, an increasing number of researchers have focused on this area. Thus, TTK may be a promising therapeutic target for EEC treatment.
Collectively, this study suggests that TTK acts as an oncogene in EEC carcinogenesis by promoting cell proliferation and anti-apoptosis. The detailed molecular mechanisms of how TTK was involved in EEC development require further investigations.
Footnotes
Authors’ note
Author Jiamiao Zhang is now affiliated to the Department of Reproductive Center, The Fourth Affiliated Hospital of Nantong University, China. Author Yihua Yang is now affiliated to Department of Reproductive Center, First Affiliated Hospital of Guangxi Medical University, China.
Declaration of conflicting interests
The author(s) declared no potential conflicts of interest with respect to the research, authorship, and/or publication of this article.
Funding
The author(s) disclosed receipt of the following financial support for the research, authorship, and/or publication of this article: The studies were supported by the National Natural Science Foundation of China (Project Nos 81360386 and 81560245) and Guangxi Science Foundation for Young Scholars (Project No. 2013GXNSFBA019165).