
Abstract
In cholestasis, increases in bile acid levels result in the generation of reactive oxygen species and the induction of DNA damage and mutation. It is believed that bile acid accumulation is associated with liver tumorigenesis. However, the mechanism that underpins this phenomenon remains to be elucidated. Mcl-1, which is overexpressed in hepatic cells, is a pro-survival member of the Bcl-2 family. In this study, we observed that Mcl-1 potently suppresses the repair of bile acid–induced abasic (apurinic/apyrimidinic) sites in DNA lesions. Upon exposure of hepatic cells to glycochenodeoxycholate, one of the major conjugated human bile acids, we observed an increase in AP site accumulation along with induction of poly(ADP-ribose) polymerase and XRCC1 (X-Ray Repair Cross Complementing 1). In addition, accumulation of Mcl-1 was observed in the nuclei of QGY-7703 cells in response to glycochenodeoxycholate stimulation. Knockdown of endogenous Mcl-1 by RNA interference significantly accelerated the repair of DNA lesions in glycochenodeoxycholate-treated cells. However, unlike XRCC1, poly(ADP-ribose) polymerase was induced following Mcl-1 knockdown. Conversely, poly(ADP-ribose) polymerase suppression was observed following glycochenodeoxycholate treatment of cells overexpressing Mcl-1. Moreover, AP-site counting analyses revealed that DNA repair activity was enhanced in cells overexpressing poly(ADP-ribose) polymerase under glycochenodeoxycholate stress conditions. It is well known that poly(ADP-ribose) polymerase plays a crucial role in the base excision repair pathway. Thus, our findings suggest that Mcl-1 suppresses base excision repair by inhibiting poly(ADP-ribose) polymerase induction following glycochenodeoxycholate-induced DNA damage. These results potentially explain how bile acid accumulation results in genetic instability and carcinogenesis.
Introduction
Patients with chronic and advanced-stage cholestasis have a higher risk of developing hepatocelluar carcinoma (HCC) and bile duct cancer. 1 In cholestasis, impaired bile flow leads to an accumulation of bile acids in the liver. The build-up of bile acids is responsible for hepatocyte and biliary injury and inflammation. This occurrence diminishes the ability of the liver to regenerate. Furthermore, resultant toxin-induced liver injuries and repair cycles are considered contributing factors in tumor promotion. 2 High levels of bile acids can disrupt the cell membrane, impair mitochondrial function, stimulate reactive oxygen species (ROS) synthesis, and induce DNA damage and mutation. 3 Recent studies have revealed that continuous bile acid–mediated stress results in DNA single-strand breaks (SSBs) and apurinic/apyrimidinic (AP)-site generation.4,5
It has been estimated that under normal physiological conditions, 20,000–50,000 AP sites are generated on a daily basis in individual cells. AP sites are the most common form of DNA damage in eukaryotic cells. 5 In eukaryotes, the stability of the genome is safe-guarded by DNA repair systems. Although there are multiple DNA repair pathways, base excision repair (BER) is the predominant pathway involved in the repair of AP sites and single-base damage. 6 BER is also primarily responsible for removing specific small non-bulky lesions from the genome. The BER pathway is triggered by the activity of DNA glycosylases, which recognize and remove specific damaged or inappropriate bases, thereby forming AP sites. In the case of an intact AP site, strand incision by AP endonuclease-1 (APE1) produces a single-nucleotide gap with the deoxyribose phosphate (dRP) group at the margin. 7 Subsequently, poly(ADP-ribose) polymerase (PARP) binds to the break and functions as an accessory factor in recruiting and stabilizing the repair complex which includes DNA polymerase β, XRCC1/DNA ligases, or polynucleotide kinase/phosphatase (PNKP). 8 DNA polymerase β removes exposed 5′-dRP flaps through its lyase activity. The polymerase also performs gap-filling DNA synthesis, leaving behind a nicked DNA strand. 6 The final nicked product is sealed by XRCC1/DNA ligases. 9 The efficiency of BER is regulated by multiple cell signals. Recent studies have revealed that BER activity can be suppressed by Bcl-2 in lung cancer. 10 Interestingly, Bcl-2 expression was reduced in hepatic cells. Conversely, we observed high levels of Mcl-1, which is a member of the Bcl-2 protein family.
Mcl-1 is an important anti-apoptotic member of the Bcl-2 family. It is a critical regulator of apoptosis in both normal and malignant cells. 11 Mcl-1 is also an oncogene involved in the promotion of cancer development. It was first discovered as a gene that is induced during the initial differentiation of a human myeloid leukemia cell line. 12 The increase in expression of Mcl-1 is seen following DNA damaging agents. 13 Jamil et al. 14 detected Mcl-1 at the site of DNA damage, and they also found that Mcl-1 has an important role in allowing proper repair of DNA repair. More recent studies have reported that Mcl-1 is involved in the regulation of DNA damage response. The mechanisms that underlie this phenomenon remain to be further elucidated.15,16 In this study, we evaluated the impact of bile acid on hepatic cells and provided evidence for its roles after DNA damage.
Materials and methods
Antibodies and other reagents
The human Mcl-1 (#ab32078) antibody was purchased from Abcam (Cambridge, MA, USA). Prohibitin (#2426), XRCC1 (#2735), and PCNA (#13110) antibodies were procured from Cell Signaling Technology (Danvers, MA, USA). PARP (#13371-1-AP) and tubulin α (#66-31-1-lg) antibodies were obtained from Proteintech (Rosemont, IL, USA). APE1 (#sc-17774), DNA polymerase β (#sc-375681), and horseradish peroxidase (HRP)-conjugated secondary antibodies (sc-2004; sc-2005) were obtained from Santa Cruz Biotechnology (Dallas, TX, USA), and the protease inhibitor cocktail was purchased from Thermo Fisher Scientific (Waltham, MA, USA). GCDA (#G0759) was purchased from Sigma-Aldrich (St. Louis, MO, USA) and diluted to 10 mM with double-distilled water.
Cell lines, plasmids, and transfection
The human liver cell line L02 (cat. no. GDC079; China Center for Type Culture Collection, Wuhan, Hubei, China) and liver cancer cell lines HepG2 (cat. no. HB-8065; American Type Culture Collection, Manassas, VA, USA), Huh7 (cat. no. JCRB0403; Janan Health Science Resources Bank, Osaka, Japan), and QGY-7703 (cat. no. TCHu 43; Cell Bank of the Chinese Academy of Sciences, Shanghai, China) were obtained from the laboratory of Dr Zanxian Xia (Central South University, China). All of these hepatic cell lines are associated with high-level Mcl-1 expression.17,18 L02, HepG2, and Huh7 cells were cultured in Dulbecco’s modified Eagle’s medium (DMEM; Corning, Manassas, VA, USA) supplemented with 10% fetal bovine serum (FBS; Gibco, Grand Island, NY, USA), penicillin (100 U/mL), and streptomycin (100 µg/mL). QGY-7703 cells were maintained in RPMI 1640 containing 10% FBS and antibiotics. The Mcl-1 and PARP recombinant plasmids were gifts from the laboratory of Dr Jinfeng Zhao (Xiangya Hospital, Central South University, China). The plasmids were transfected into QGY-7703 cells using Lipofectamine 2000 (Invitrogen, Grand Island, NY, USA).
Subcellular fractionation
QGY-7703 cells were exposed to increasing concentration (0, 50, and 100 µM) of GCDA and 200 µM H2O2 for 2 h. After treatment, subcelluar fractionation was performed as described previously. 10
Immunofluorescence staining
After the cells’ exposure to 200 µM for 2 h, they were washed with 1× phosphate-buffered saline (PBS) and subsequently fixed with cold 4% paraformaldehyde for 15 min. The cells were then permeabilized with 0.1% Triton X-100 and blocked with 10% goat serum for 30 min at room temperature. The cells were subsequently incubated with a rabbit Mcl-1 primary antibody (1:400) for 2 h. After washing, the samples were incubated with goat anti-rabbit IgG secondary antibody (conjugated to DyLight 488 (1:800); Invitrogen, Thermo Fisher Scientific, Rockford, IL, USA) for 60 min. Finally, the cells were washed with 1× PBS and observed under the Nikon Eclipse 80i fluorescent microscope (Melville, NY, USA), and photographs were taken of each sample.
Comet assay
A single-cell gel electrophoresis (comet assay) kit was employed to evaluate DNA damage following the manufacturer’s instructions (Trevigen, Inc., Gaithersburg, MD, USA). The appropriate treatment was applied and the cells were collected and washed with ice-cold 1× PBS. Next, 1 × 10⁵ cells/mL were combined with molten LMAgarose (at 37°C) at a ratio of 1:10 (v/v), and the mixture (75 µL) was immediately pipetted onto CometSlide™. After gentle cell lysis, samples were treated with Alkaline or Neutral Electrophoresis Buffer to unwind and denature the DNA and hydrolyze associated sites of damage. The samples were electrophoresed following the manufacturer’s instructions, stained with a fluorescent DNA intercalating dye (SYBR Green I nucleic acid), and visualized using an 80i fluorescent microscope (Melville, NY, USA).
Genomic DNA AP site counts
After treatment of cells with GCDA, genomic DNA was purified using a DNA isolation kit (Omega Bio-Tek, Inc., Norcross, GA, USA). The number of AP sites was assessed using a DNA damage quantification (AP Site Counting) kit according to the manufacturer’s instructions (Dojindo Molecular Technologies, Rockville, MD, USA). The absorbance of the samples was analyzed using a microplate reader (EL808; BioTek Instruments Inc, Winooski, VT, USA) with a 650-nm filter. Each experiment was repeated three times, and data were represented as mean ± standard deviation (SD) for three determinations.
Quantitative polymerase chain reaction
RNA was extracted from QGY-7703 cells using a QIAGEN RNAeasy RNA isolation kit (QIAGEN, Valencia, CA, USA). The extracted RNA was reverse transcribed into complementary DNA (cDNA) using a Thermo Fisher Scientific cDNA synthesis kit. The primers that were used for amplification are given in Table 1 (QIAGEN). Quantitative polymerase chain reaction (qPCR) was performed using Bio-Rad SYBR Green Master Mix and a LightCycler 480 (Roche, Indianapolis, IN, USA). Melt curve analysis was used to monitor each amplification reaction for the absence of non-specific PCR products. The threshold cycle numbers obtained from quantitative PCR were compared to generate the relative copy number. Data were normalized against tubulin α locus.
Oligonucleotide primers.

RNA interference
Hepatic cells expressing wild-type (WT) Mcl-1 were transfected with Mcl-1 siRNA 5′-GGACUUUUAGAUUUAGUGA-3′ (Sangon, Shanghai, China) using Lipofectamine 2000. A control siRNA (non-homologous to any known gene sequence) was used as a negative control. The levels of Mcl-1 expression were analyzed by western blot analysis using a Mcl-1 antibody. Specific silencing of Mcl-1 was confirmed by at least three independent experiments.
Western blots
Cells exposed to the various treatments were harvested and rinsed once with ice-cold 1× PBS. Preparation of total protein lysates and western blot analysis was done as previously described. 19
Statistics
For comet assay, comet tails were quantified using the OpenComet system. At least 50 randomly selected cells were analyzed per sample and then compared between groups using unpaired, two-tailed Student’s t-test (not significant (ns); *p < 0.05; **p < 0.002). For AP-site Assay, all experiments were repeated at least twice and similar results were obtained. For quantitative reverse transcription polymerase chain reaction (RT-PCR), gene expression was normalized against tubulin α. All error bars in the experiments performed in this study represent SD unless specified in the figure legend.
Results
GCDA induced AP-site production in hepatic cells
GCDA is a conjugated bile acid, which has been reported to promote oxidative stress in hepatic cells. 20 In order to evaluate bile acid–induced DNA damage and analyze resultant DNA lesions, HCC cells (QGY-7703) were incubated with 200 µM GCDA for 1 h. Two different comet assay methods, alkaline comet assay and neutral comet assay, were utilized to analyze resultant DNA damage. The alkaline comet assay is used to detect single- and double-stranded DNA breaks, while the neutral comet assay is typically used to detect double-stranded DNA breaks only. DNA damage was observed following the alkaline comet assay (Figure 1(a) and (b)). In contrast, we did not observe much DNA damage when the neutral comet assay was used (Figure 1(c) and (d)). These results suggest that GCDA predominantly induces SSB damage in hepatic cells. To further confirm these results, we treated the hepatic cell lines L02, HepG2, Huh7, and QGY-7703 with increasing concentrations of GCDA for 2 h and then assessed the occurrence of DNA lesions using a DNA damage quantification (AP site counting) kit. The same experiment was also carried out with a constant concentration of GCDA (200 µM) using the same cell lines over a specified time course up to 3 h. The results indicated that GCDA significantly enhanced AP site lesion production in hepatic cells (Figure 1(e) and (f)).

GCDA-mediated induction of SSB DNA damage in hepatic cells. QGY-7703 cells were seeded in 12-well plates at a density of 1 × 10⁵ cells per well in 1 mL medium. After 24 h, the cells were treated with 200 µM GCDA for 1 h. DNA damage was detected by (a and b) alkaline comet assay or (c and d) neutral comet assay. Comet tails were quantified using the OpenComet system. At least 50 randomly selected cells were analyzed per sample. (e and f) HepG2, L02, Huh7, and QGY-7703 cells were seeded in six-well plates. When the cells reach about 80% confluence, they are treated with increasing doses of GCDA for 2 h or 200 µM GCDA for up to 3 h. DNA lesions were evaluated using an AP site counting kit. The p values were calculated using a two-tailed, unpaired Student’s t-test (*p < 0.05; **p < 0.002). The error bars are representative of SD.
Mcl-1 suppresses BER-mediated repair following GCDA stress
Recent studies have revealed that Mcl-1 is directly or indirectly associated with DNA damage repair regulation.15,16 To understand the function of Mcl-1 in DNA repair, we first examined Mcl-1 expression in the hepatic cell lines L02, HepG2, Huh7, and QGY-7703. These cell lines were exposed to 200 µM GCDA for up to 24 h. Western blot results indicated that Mcl-1 is highly expressed in different hepatic cell lines. In addition, accumulation of Mcl-1 was detected after the cells were treated with GCDA for 24 h (Figure 2(a)). Interestingly, the increase in Mcl-1 was more higher in QGY-7703 cells compared with other cancer cell lines. However, there were little changes of expression of Mcl-1 in normal hepatic cells (L02) following GCDA treatment (Figure 2(a)). To further demonstrate the physiological role of Mcl-1 in DNA repair, a gene silencing approach to knockdown endogenous Mcl-1 expression was employed. Western blot results revealed that transfection of Mcl-1 siRNA significantly reduced endogenous Mcl-1 expression (Figure 2(b)). To test whether Mcl-1 affects the repair of GCDA-induced DNA damage, WT or Mcl-1 knocked down QGY-7703 cells were treated with GCDA for 2 h. Cells were then washed and incubated with normal cell culture medium for up to 24 h. The expression of Mcl-1 was detected by western blot and DNA damage was analyzed by alkaline comet assay. We observed that Mcl-1 expression levels were significantly upregulated after treatment with 200 µM GCDA. The increased levels of Mcl-1 gradually decreased to the same level as the “no treatment” control group following removal of the DNA damage reagent. Conversely, limited Mcl-1 expression was observed in the knockdown groups (Figure 2(d)). The comet assay revealed that GCDA can induce DNA damage in either WT Mcl-1-expressing or down-regulated Mcl-1-expressing cells. After removal of GCDA from the culture medium, DNA damage was gradually repaired within 24 h. Compared with control groups, the damage was repaired more quickly in Mcl-1 knockdown groups (Figure 2(c)). In order to confirm these results, we evaluated DNA damage using an AP site counting kit. The results were consistent with those generated by the comet assay, suggesting that Mcl-1 significantly suppresses the repair of GCDA-induced AP sites in hepatic cells (Figure 2(e)).

Mcl-1 suppresses BER-mediated repair in response to GCDA. (a) HepG2, Huh7, L02, and QGY-7703 cells were planted in 10 cm dishes. When the cells were approximately 80% confluent, they were exposed to 200 µM GCDA for up to 24 h. Mcl-1 levels were analyzed by western blot. Signal intensity was quantified with ImageJ and normalized to tubulin α. (b) Western blot showing Mcl-1 knockdown in QGY-7703 cells following treatment with Mcl-1 siRNA. (c and d) QGY-7703 cells were seeded in six-well plates at a density of 7 × 10⁴ cells per well in 2 mL medium. After 24 h, knockdown Mcl-1 by siRNA interference for 48 h. Then, WT or Mcl-1 knockdown QGY-7703 cells were treated with 200 µM GCDA for 2 h. The cells were washed and incubated in regular culture medium for up to 24 h. Expression of Mcl-1 was detected by western blot and DNA damage was analyzed by comet assay. (e) Following exposure to 200 µM GCDA for 2 h, QGY-7703 cells were washed and incubated in regular culture medium for up to 24 h. AP sites were analyzed using an AP site counting kit.
GCDA inhibits PARP induction and promotes Mcl-1 accumulation in the nucleus
Mcl-1 is primarily localized in the outer mitochondrial membranes with limited expression also observed in both nuclear and endoplasmic reticulum membrane systems. In order to test whether the subcellular distribution of Mcl-1 is altered after GCDA treatment, hepatic cell lines were treated with 100 µM GCDA for 2 h and then analyzed by immunofluorescent staining. This analysis revealed that the majority of Mcl-1 was localized in the cytoplasm and only a small proportion of the protein was located in the nucleus in the control group. Following treatment with GCDA for 2 h, Mcl-1 expression was induced resulting in a concomitant accumulation in nuclei in the hepatic cell lines analyzed (Figure 3(a)). To further confirm this result, subcellular fractionation was carried out to isolate mitochondrial and nuclear fractions. Western blot results indicated that nuclear Mcl-1 expression was enhanced within 2 h in a dose-dependent manner in QGY-7703 cells after treatment with GCDA (Figure 3(b)). Intriguingly, Mcl-1 did not translocate into the nuclei of the cells from the H2O2 control group, even though H2O2 did promote upregulation of Mcl-1 expression (Figure 2(c)). This suggests that ROS alone do not facilitate the translocation of Mcl-1 to the nucleus; however, the mechanism that underlies this occurrence remains to be elucidated. In order to better understand the impact of knocking down Mcl-1 on BER, we monitored the expression of BER-related proteins after Mcl-1 silencing in QGY-7703 cells following GCDA treatment. Western blot analysis revealed that APE1, DNA polymerase β and PCNA were not grossly affected by Mcl-1 knockdown. However, we noticed that the expression of PARP and XRCC1 was upregulated following GCDA stimulation. Interestingly, the induction of PARP, unlike XRCC1, was significantly enhanced after Mcl-1 downregulation (Figure 3(c)). This suggests that Mcl-1 may impair BER repair by inhibiting PARP induction following stimulation with GCDA.

Mcl-1 translocates into the nucleus and inhibits PARP induction following GCDA treatment. (a) Hepatic cells cultured on two-well chamber slide at a density of 1 × 10⁴ cells per well. After 24 h, the cells were treated with 100 µM GCDA for 2 h. Distribution of Mcl-1 was evaluated by immunofluorescence staining. (b) 5 × 10⁵ per well QGY-7703 cells were seeded in six-well plates. After 24 h, the cells treated with increasing concentrations of GCDA for 2 h and 200 µM H2O2 were included as a control. Subcellular fractionation was performed on resultant cells. Mcl-1 in each fraction was analyzed by western blot. Prohibitin and PCNA were used as mitochondrial and nuclear markers, respectively. (c) QGY-7703 cells were seeded in 6-well plates at a density of 1 × 10⁵ cells per well in 2 mL medium. After knocking down Mcl-1 by siRNA interference for 48 hour, BER-related proteins were detected by western blot analysis of WT or Mcl-1 knockdown QGY-7703 cells after induction with 100 µM GCDA for 2 h. Signal intensity was quantified using ImageJ. The data were normalized to tubulin α.
Mcl-1 suppresses BER by inhibiting PARP induction in response to GCDA stress
To further confirm the regulation of PARP by Mcl-1 and to analyze the role of Mcl-1 in the BER pathway in response to GCDA stress, we overexpressed Mcl-1 and PARP in QGY-7703 cells (Figure 4(a)). We subsequently analyzed the impact of overexpression of both proteins by qPCR and AP site counting analyses. The qPCR data revealed that transfection of a Mcl-1-encoding plasmid into QGY-7703 cells significantly inhibited PARP induction following GCDA treatment when compared with the control group and the Mcl-1 knockdown group (Figure 4(a)). We also observed that silencing of Mcl-1 promoted increases in PARP induction under GCDA stress; this result is consistent with results from our previous studies. However, in the absence of GCDA, we did not observe any changes in PARP induction in the Mcl-1 knockdown group (Figure 4(a)). Moreover, according to AP-site assay results, BER repair was obviously enhanced following PARP overexpression in hepatic cells (Figure 4(c)). Altogether, our results indicate that Mcl-1 suppresses BER repair activity by inhibiting PARP induction in the presence of GCDA stress.
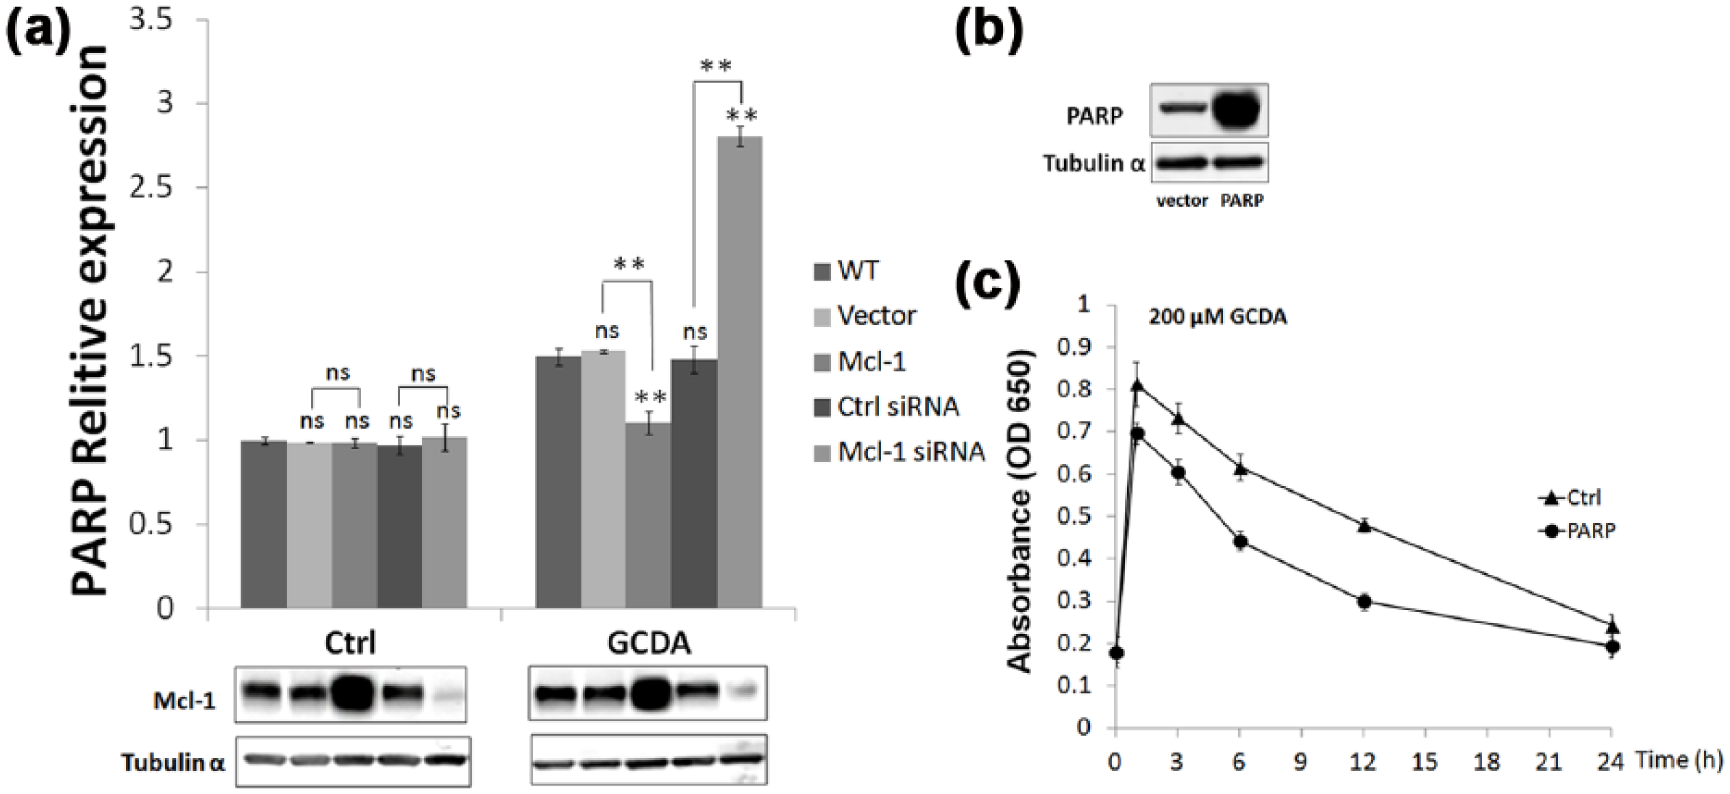
Mcl-1-mediated inhibition of BER repair via PARP suppression. (a) 1 × 10⁵ QGY-7703 cells were seeded in six-well plates. After 24 h, control siRNA, Mcl-1 siRNA, vector, or Mcl-1 plasmid was transfected into cells. After 48 h, following treatment with 200 µM GCDA for 2 h, PARP expression in Mcl-1 knockdown, Mcl-1 overexpression, and control QGY-7703 cells were analyzed by quantitative RT-PCR. Gene expression was normalized against tubulin α. The p values were calculated using the two-tailed, unpaired Students’s t-test (not significant (ns); *p < 0.05; **p < 0.002). All error bars represent SD. (b) PARP overexpression in QGY-7703 cells. (c) QGY-7703 cells were seeded in six-well plates at a density of 7 × 10⁴ cells per well in 2 mL medium. After 24 h, vector or PARP plasmids were transfected into cells. After 48 h, WT or PARP overexpressed QGY-7703 cells were treated with 200 µM GCDA for 2 h. The cells were washed and incubated in regular culture medium for up to 24 h. BER repair activity was assessed using an AP-site counting assay. Error bars represent SD.
Discussion
There is increasing evidence that bile acids induce DNA damage.1–3 In our study, we observed that treatment with GCDA resulted in SSB accumulation in both normal liver and liver cancer cell lines. Notably, normal cells were more sensitive to GCDA than liver cancer cells. Meanwhile, we noticed that higher increase of Mcl-1 was detected in cancer cells than normal cells following GCDA stimulation. Previous study reported that Mcl-1 protein stability is increased in hepatic cells following bile acid accumulation and phosphorylation of the Mcl-1 protein, thereby prolonging survival of HCC cells. 15 However, we did not detect Mcl-1 phosphorylation in nucleus following GCDA treatment (data not shown). It may explain the difference between normal and cancer hepatic cells to GCDA treatment.
Genomic integrity is maintained as a consequence of the activities of DNA repair systems. Multiple pathways of DNA repair are known to exist; however, BER is the repair pathway that is predominantly responsible for removing small, non-helix-distorting base lesions from the genome. 6 Several studies have demonstrated that Mcl-1 is involved in DNA repair pathway.6,16,21 In light of these studies, Mcl-1 was knocked down in hepatic cells as part of this analysis and BER activity was monitored after GCDA-induced cell injury. The results showed that Mcl-1 knockdown significantly enhanced BER repair. This reveals that Mcl-1 is a negative regulator of BER during GCDA-DNA damage.
Mcl-1 is predominantly localized in mitochondrial membranes. In this study, we observed nuclear Mcl-1 accumulation in a dose-dependent manner following the treatment of cells with GCDA. Interestingly, we also observed that H2O2 (200 µM), which normally as a positive control of ROS, upregulates Mcl-1 levels. 22 However, this upregulation did not result in the accumulation of Mcl-1 in the nuclei of QGY-7703 cells. A recent report indicated that G protein–coupled bile acid receptor 1 (TGR5) mediates bile acid–induced DNA damage in Barrett’s Esophageal Adenocarcinoma Cells. 23 This suggests that increases in Mcl-1 levels, which are induced by GCDA or H2O2, may be caused by different signaling pathways. However, the mechanisms that underlie the regulation of these pathways remain to be elucidated. Several previous studies have indicated that Mcl-1 is associated with a number of nuclear proteins. These studies employed either co-immunoprecipitation or yeast two-hybrid analyses to monitor proteins that interact with Mcl-1.14,21 Consequently, we hypothesized that Mcl-1 has a role in nuclear responses to DNA damage.
To further understand these phenomena, we analyzed BER-related proteins in GCDA-treated cells after Mcl-1 knockdown. We observed that the relative expression of PARP and XRCC1 (in comparison with other proteins) was upregulated after GCDA stimulation. We also observed that PARP expression was significantly increased after Mcl-1 knockdown. During BER-mediated repair, PARP detects and binds to sites of single-strand DNA damage via the DNA-binding domain. PARP subsequently synthesizes poly(ADP-ribose; PAR) and transfers it to acceptor proteins. Next, PAR recruits other repair proteins to damage DNA sites. 24 This suggests that the inhibition of PARP by Mcl-1 results in a reduction in BER activity. To further confirm that Mcl-1 inhibits PARP induction, we overexpressed Mcl-1 or PARP in hepatic cells. We did not detect a significant difference in PARP levels in the treatment groups that were not treated with GCDA. However, PARP induction was limited after Mcl-1 overexpression following GCDA treatment. This suggested that the translocation of Mcl-1 into nuclei is a key prerequisite for inhibition of PARP induction in response to GCDA stress. Moreover, our hypothesis was confirmed by the finding that overexpression of PARP enhanced BER repair. We investigated the interaction of Mcl-1 and PARP with GCDA treatment. But, no binding was detected between Mcl-1 and PARP in response to GCDA stimulation (data not shown). Therefore, we hypothesized that Mcl-1 is indirectly responsible for the regulation of PARP. A search tool for the retrieval of interacting genes/proteins (STRING) analysis of protein-to-protein interactions reveals that tumor protein p53 (TP53), Ubiquitin C (UBC), or caspase 3 (CASP3) may be involved in this process. All of the three potential intermediators have a close interaction with Mcl-1 and PARP (Figure S1). 25 Further analysis was carried out through gene ontology (GO) consortium and Kyoto Encyclopedia of Genes and Genomes (KEGG) database. According to the results, TP53 and UBC are shown to be associated with the biological process of DNA damage and repair (Tables S1 and S2). TP53 is a most important transcription factor in response to cellular stress. Previous study reveals that TP53 has an essential role in coordinating the BER process. 26 UBC represents a ubiquitin gene. It has been associated with protein degradation, DNA repair, and cell-cycle regulation. 27 However, the nature of the interaction of these proteins is still unclear, and the mechanism facilitating Mcl-1-regulated PARP induction under bile acid stress conditions requires further elucidation.
In summary, our findings reveal a putative new mechanism by which Mcl-1 inhibits BER through suppression of PARP induction. The presence of GCDA-induced AP sites in DNA lesions results in Mcl-1 accumulation in nuclei with a concomitant downregulation of PARP. This occurrence leads to a reduction in AP site repair. Thus, this study reveals that Mcl-1 plays a crucial role in the pathogenesis of bile acid–induced HCC.
Footnotes
Declaration of conflicting interests
The author(s) declared no potential conflicts of interest with respect to the research, authorship, and/or publication of this article.
Funding
The author(s) disclosed receipt of the following financial support for the research, authorship, and/or publication of this article: This work was supported by the National Natural Science Foundation of China (Nos 81272193, 81302075, 81402001, and U1603126) and the National Key Research and Development Program of China (2016YFD0500300).
References
Supplementary Material
Please find the following supplemental material available below.
For Open Access articles published under a Creative Commons License, all supplemental material carries the same license as the article it is associated with.
For non-Open Access articles published, all supplemental material carries a non-exclusive license, and permission requests for re-use of supplemental material or any part of supplemental material shall be sent directly to the copyright owner as specified in the copyright notice associated with the article.