
Abstract
Mild hyperthermia enhances anti-cancer effects of chemotherapy, but the precise biochemical mechanisms involved are not clear. This study was carried out to investigate whether mild hyperthermia sensitizes gastric cancer cells to chemotherapy through reactive oxygen species–induced autophagic death. In total, 20 BABL/c mice of MKN-45 human gastric cancer tumor model were divided into hyperthermia + chemotherapy group, hyperthermia group, chemotherapy group, N-acetyl-L-cysteine group, and mock group. Reactive oxygen species production and expression of autophagy-related genes Beclin1, LC3B, and mammalian target of rapamycin were determined. The relationships between tumor growth regression, expression of autophagy-related genes, and reactive oxygen species production were evaluated. Tumor size and wet weight of hyperthermia + chemotherapy group was significantly decreased relative to values from hyperthermia group, chemotherapy group, N-acetyl-L-cysteine group, and mock group (F = 6.92, p < 0.01 and F = 5.36, p < 0.01, respectively). Reactive oxygen species production was significantly higher in hyperthermia + chemotherapy group than in hyperthermia, chemotherapy, and mock groups. The expression levels of Beclin1 and LC3B were significantly higher, while those of mammalian target of rapamycin were significantly lower in hyperthermia + chemotherapy group than in hyperthermia, chemotherapy, and mock groups. Tumor growth regression was consistent with changes in reactive oxygen species production and expression of autophagy-related genes. N-acetyl-L-cysteine inhibited changes in the expression of the autophagy-related genes and also suppressed reactive oxygen species production and tumor growth. Hyperthermia + chemotherapy increase expression of autophagy-related genes Beclin1 and LC3B, decrease expression of mammalian target of rapamycin, and concomitantly increase reactive oxygen species generation. These results strongly indicate that mild hyperthermia enhances sensitivity of gastric cancer cells to chemotherapy through reactive oxygen species–induced autophagic death.
Introduction
Gastric cancer is the second most common cancer worldwide, with a frequency that varies greatly across different geographic locations. 1 Despite improvement in overall survival with adjuvant CT after radical surgical resection, most patients experience treatment failure and develop local tumor recurrence or peritoneal carcinomatosis.2,3 Local recurrence of tumor (peritoneal carcinomatosis) is the most common cause of death in patients with gastric cancer. Treatment of peritoneal carcinomatosis post cytoreductive surgery of gastric cancer remains a challenging problem. 4
Autophagy, a self-catabolic mechanism that degrades unwanted cellular components through lysosomal enzymes, has aroused widespread attention for its involvement in tumor development and cancer therapy.5–9 Compromised autophagy could promote chromosomal instability associated with carcinogenesis and tumor progression.5,7,8 The role of autophagy in cancer is more complex. There is evidence that autophagy may be oncogenic in some contexts, whereas in others, it clearly contributes to tumor suppression.6–9 The execution of autophagy involves a set of products, known as autophagy-related genes, and many autophagy genes have been found to be inactivated in human cancers.10–15 Beclin1 is a mammalian autophagy gene which regulates autophagy by interacting with class III phosphatidylinositol-3-phosphate kinase (PI3KIII/Vps34). It participates in the early stages of autophagy by promoting nucleation of autophagic vesicles and recruiting proteins from the cytosol.16–18 The yeast autophagy-related protein-8, mammalian homolog microtubule-associated protein light chain 3 (LC3) is essential for final autophagosome formation.19–21 Mammalian target of rapamycin (mTOR) is a member of the PI3K family and is associated with the proliferation, survival, invasion, and metastasis of cancer cells. 22 Inactivation of mTOR by cellular hypoxia or energy deficiency induces autophagic activity, and this protein functions as an important sensor of cellular nutrients and energy by combining with upstream signals from insulin, growth factors, and mitogens. 23 Changes in expression of autophagy-related genes such as LC3, Beclin1, or augments such as mTOR are crucial for understanding how the autophagic process works and how it influences cancer formation. Indeed, changes in activation of autophagic genes may contribute to the development of human cancers.24–26
Mild hyperthermia (HT) refers to heat treatment of malignancies in which tumor temperature is elevated within the range of 39–45°C. 27 Some studies found that HT may eliminate resistance of cancer cells to CT and enhance the anti-tumor effect of CT.27,28 Oxidative stress is defined as a disturbance in the equilibrium between free radicals, reactive oxygen species (ROS), and endogenous anti-oxidant defense mechanisms. 29 ROS are decreased in many types of cancer cells, a phenomenon which plays pivotal roles in tumorigenesis, metastasis, and resistance to CT. 24 Cancer cells show lower intracellular ROS contents than non-cancer cells. This may be due to the increased expression of free radical scavenging systems.30–35 It has been reported that mild HT could promote mammalian aerobic metabolism, provoke oxidative stress, and induce ROS formation.36,37 Studies have shown that HT improves CT efficacy and that HT in combination with oxidative stress induces autophagic cell death in cancer cells, thus suggesting that HT-induced enhancement of cancer cell sensitivity to CT might be related ROS-linked autophagic death.35–37
The precise biochemical mechanisms involved in the synergism between anti-tumor effect of HT and CT treatment are unclear, and the role of ROS in autophagic death of gastric cancer cells due to HT-enhanced sensitivity to CT is poorly understood. This study was carried out to investigate whether mild HT enhances sensitivity of gastric cancer cells to CT through ROS-mediated autophagic death.
Materials and methods
MKN-45 gastric cancer cell culture and BABL/c mice feed
MKN-45 human gastric cancer cell line was supplemented with 10% heat inactivated fetal bovine serum (FBS) at 37°C in a humidified incubator with 5% CO2 for all experiments and tumor growth analysis. Overall, 6-week-old BABL/c mice were used for tumor formation analysis. These BABL/c mice were fed ad labium on a standard diet and housed in a temperature-controlled animal facility with a 12-h light/12-h dark cycle. The animals were treated humanely, and all procedures were in compliance with Guangzhou Medical University guidelines for the use of laboratory animals and were approved by Guangzhou Medical University Animal Care and Use Committee (No. SYXK (Yuen) 2010-0104).
HT and CT influence on tumor growth of MKN-45 human gastric cancer cells in mice
MKN-45 human gastric cancer cells were re-suspended in phosphate-buffered saline (PBS) for transplantation at a concentration of 1 × 10⁴ live cells/mL. The 6-week-old immune-deficient BABL/c mice were subcutaneously injected with the MKN-45 human cancer cells at the right inguinal to produce the gastric cancer tumor model. After 8 weeks, tumor sizes were examined. Mice with tumor size of about 2 cm in diameter were selected and used for the animal experiments.
Overall, 20 MKN-45 human gastric cancer tumor model of BABL/c mice were divided into five groups: HT + CT group received HT and CT treatment, HT group received HT treatment alone, CT group received CT treatment alone, autophagic blocker group was treated with N-acetyl-L-cysteine (NAC) before HT and CT treatment, while mock group received no treatment as control group. HT and CT treatments were done by immersing the mice fixed on a board in water at 43°C in a constant temperature bath box for 1 h post intraperitoneal injection of oxaliplatin (5 mg/kg body weight in 1 mL saline). Mild HT treatment was performed by immersing the experimental mice fixed on a board in water at 43°C in a constant temperature bath box for 1 h. The mock group received no treatment. The NAC group received intraperitoneal injection of NAC (100 mg/kg body weight) in 1 mL saline every other day, after which the mice were subjected to the same treatment as the HT + CT group.
After 2 weeks, all the animals were sacrificed, and tumors were examined for size and weight. The tumors were isolated for immunohistochemistry or flow cytometry (FCM). Part of each tumor tissue was made into cell suspension, and the cells were isolated according to the method previously described. 33
Measurement of ROS and H2O2 levels
Oxidation-sensitive dye 5(6)-chloromethyl-2′,7′-dichlorodi-hydrofluorescein diacetate acetyl ester (DCFDA, Molecular Probes/Invitrogen) was used to measure ROS production by the MKN-45 gastric cancer cells before and after HT + CT treatment. The cells were incubated at 37°C in RPMI-1640 in the presence of 2.5 µM DCFDA for 30 min, and the intensity of fluorescence was measured in a spectrofluorimeter (excitation: 485 nm and emission filter: 535 nm). 32 The experiments were repeated three times.
H2O2 production was quantified using Amplex Red Hydrogen Peroxide/Peroxidase Assay Kit (Invitrogen) according to manufacturer’s protocol. 33 In essence, 25 × 103 MKN-45 human gastric cancer cells were re-suspended in Hanks’ balanced salt solution (HBSS; Sigma-Aldrich). After addition of phorbol 12-myristate 13-acetate (PMA; 30 ng/mL), absorbance at 560 nm was measured using a microplate plate reader (Bio-Rad) at 37°C. Absorbance results were normalized to a standard curve generated by serial dilutions of 20 mM H2O2. 32 The experiments were repeated three times.
Assay of Beclin1, LC3B, and mTOR protein expression by immunohistochemistry
Expression of Beclin1, LC3B, and mTOR in the primary tumors was detected through immunohistochemistry and compared among the four groups. Formalin-fixed, paraffin-embedded archived tissues were cut into 4-µm sections, de-waxed, rehydrated, and blocked with hydrogen peroxide. The sections were microwave-heated with 10 mM citrate buffer (pH 6.0) for antigen retrieval. The sections were then incubated with rabbit polyclonal antibody against human Beclin1 (ab55878; Abcam), LC3B (ab48394; Abcam), and mTOR (ab2732; Abcam) at dilutions of 1:200, 1:50, and 1:200, respectively, for overnight at 4°C. The sections were subsequently incubated with horseradish peroxidase–labeled secondary antibody for 30 min, after which they were developed with diaminobenzidine tetrahydrochloride and counterstained with hematoxylin. Immunohistochemical analysis was performed within 7 days to prevent antigen degradation. A positive control was supplied by Abcam, and negative controls were prepared by replacing the primary antibody with PBS.
The immunoreactivities of Beclin1, LC3B, and mTOR were evaluated according to the intensities and percentages of positively stained cells. The percentage of positively stained cells was graded as follows: grade 0 (0%–5%), grade 1 (6%–25%), grade 2 (26%–50%), grade 3 (51%–75%), and grade 4 (76%–100%). Immunoreactive scores were calculated by adding the score of staining intensity and the percentage score of positively stained cells (0–4). Tumors with immunoreactive scores of 0–2 were designated as negative, while those with scores of 3–4 were classified as positive. Immunostaining was evaluated twice by two pathologists naive to the various treatments.
Beclin1, LC3B, and mTOR protein expression by western blot analysis
Tissue samples were homogenized in sodium dodecyl sulfate (SDS) buffer containing the protease inhibitor phenylmethylsulfonyl fluoride (PMSF). The homogenates were incubated on ice for 20 min and then centrifuged at 12,000 r/min for 30 min at 4°C. Supernatants were collected and added to equivalent volume of SDS buffer. The mixture was boiled for 10 min and kept at −20°C. The protein extracts (50 g) were separated through SDS–polyacrylamide gel electrophoresis (SDS-PAGE) and then transferred onto polyvinylidene difluoride membranes (Millipore). The membranes were blocked with 5% non-fat milk in Tris-buffered saline containing 0.1% Tween-20 at room temperature for 90 min. They were thereafter immunoblotted for Beclin1 (3 µg/mL; ab55878; Abcam), LC3B (2 g/mL; ab48394; Abcam), mTOR (2 g/mL; ab2732; Abcam), and actin (0.5 g/mL; ab3280; Abcam) at 4°C overnight. The membrane was subsequently incubated with the secondary antibodies conjugated to horseradish peroxidase (1:5000; Abcam) at room temperature for 1 h. Subsequently, the experiment results were obtained and analyzed by coloration using the SuperSignal West Pico Kit (Thermo fisher Scientific), development and fixing of the photographic materials. The experiments were repeated three times.
Statistical analysis
Descriptive statistical analysis was generated for all repeated quantitative data, with inclusion of mean and standard error (SE), with SigmaPlot (Systat Software Inc.) and GraphPad Prism version 4.00 for Macintosh (GraphPad Software). The significance of differences was assessed with F test and Student’s t test or χ2 test.
Results
Tumor growth regression of gastric cancer cells in mice
After 2 weeks of treatments, the diameters of tumors in immune-deficient BABL/c mice were about 0.8, 2.0, 1.3, 2.2, and 2.4 cm in HT + CT group, HT group, CT group, NAC group, and mock group, respectively, while wet weights of tumors were 0.84 ± 0.43, 2.01 ± 0.22, 1.21 ± 0.31, 2.13 ± 0.17, and 2.31 ± 0.25 g, respectively (Figure 1A–E). There were significant differences of tumor size and wet weights in HT + CT group, HT group, CT group, and mock group (F = 6.92, p < 0.01 and F = 5.36, p < 0.01, respectively). HT + CT significantly decreased tumor volumes and wet weights relative to HT, CT, and mock group (p < 0.01, p < 0.001, and p < 0.05, respectively). Treatment with autophagic blocker NAC significantly prevented the effect of HT + CT on tumor growth (p < 0.01).
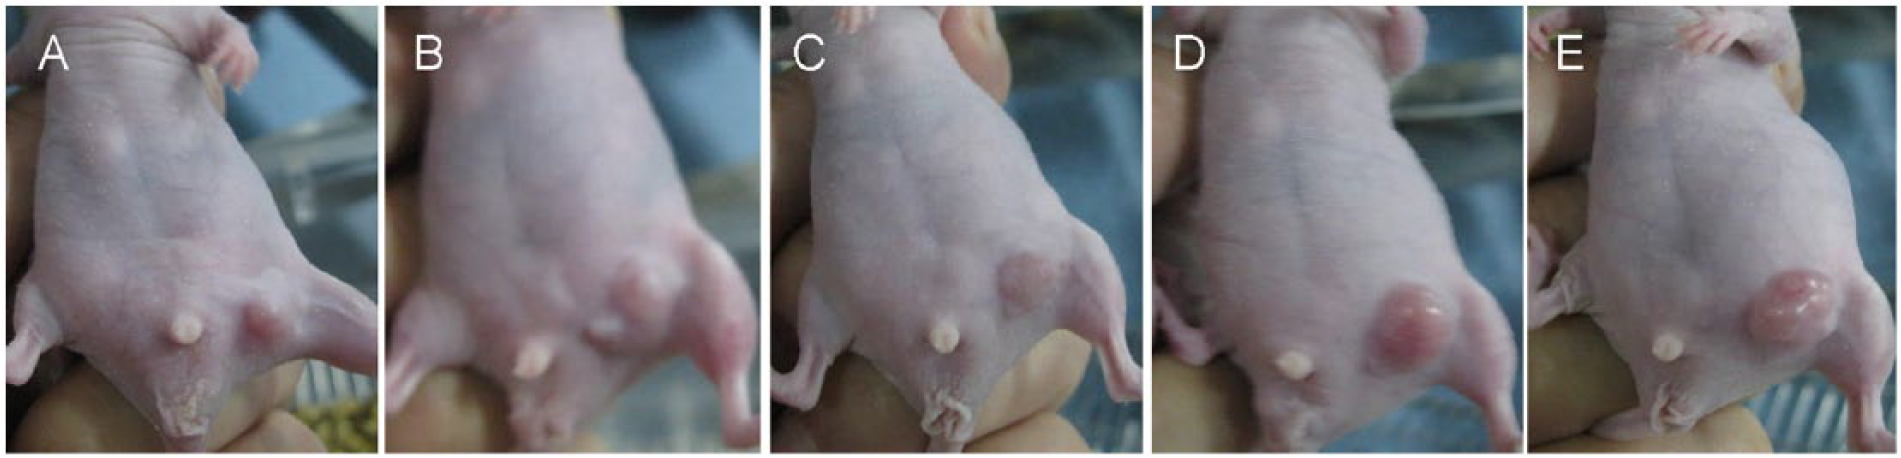
Tumor growth regression of gastric cancer cells in mice after treatment with chemotherapy + hyperthermia. HT + CT significantly decreased tumor volumes and wet weights relative to HT, CT, and mock treatment (p < 0.01, p < 0.001, and p < 0.05, respectively). Treatment with autophagic blocker NAC significantly prevented the effect of HT + CT on tumor growth (A: HT + CT group, B: HT group, C: CT group, D: NAC group, and E: mock group).
Histological examination of hematoxylin and eosin (H&E) stained tumor tissue sections revealed necrotic changes in the HT + CT and CT groups, while necrotic changes in the tumor tissues from HT, NAC, and mock groups were fewer. The number of necrotic tumor cells was significantly higher in the HT + CT group than in the CT group (p < 0.01). There was significant decrease in MKN-45 cellular proliferation in the HT + CT, CT, and mock groups in tumor cells from the immune-deficient BABL/c mice (p < 0.001, p < 0.001, and p < 0.01, respectively). HT alone had no significant effect on proliferation and survival of MKN-45 tumors cells from immune-deficient BABL/c mice. In the autophagic blocker group treated with NAC, much less death of MKN-45 human gastric cancer cells in immune-deficient BABL/c mice was observed compared to HT + CT group (p < 0.01; Figure 2A–E).

Pathological examination of hematoxylin and eosin (H&E) staining of gastric cancer in mice after treatment with HT + CT (H&E: 400×). The number of necrotic tumor cells was significantly higher in the HT + CT group than in the CT, HT, and mock treatment (all p < 0.05). Treatment with autophagic blocker NAC significantly prevented tumor cell necrosis induced by HT + CT treatment (p < 0.05; A: HT + CT group, B: HT group, C: CT group, D: NAC group, and E: mock group).
Hyperproduction of ROS in MKN-45 from tumor-bearing mice induced by HT + CT
MKN-45 cancer cells from tumor models after HT + CT demonstrated significantly higher levels of ROS than those of HT, CT, NAC, and mock group (F = 6.93, p < 0.01; Figure 3A–E). ROS production in HT + CT group increased 24 h after HT + CT and continued to increase 48 h later. The significant increase in ROS levels in cancer cells from MKN-45 tumor-bearing mice became most prominent 48 h after tumor inoculation in HT + CT. This increase was significantly higher than that observed in HT, CT, and mock groups (p < 0.001, p < 0.01, and p < 0.01, respectively). The production of ROS of MKN-45 human gastric cancer cells in NAC group was much less than HT + CT group (p < 0.001).

The expression level of ROS in MKN-45 gastric cancer cell from tumor models post chemotherapy and HT. MKN-45 cancer cells from tumor models after HT + CT demonstrated significantly higher levels of ROS than those of HT, CT, and mock group (all p < 0.05), while treatment with autophagic blocker NAC showed lower levels of ROS than HT + CT treatment (A: HT + CT group, B: HT group, C: CT group, D: NAC group, and E: mock group).
MKN-45 gastric cancer cells produced significantly higher levels of H2O2 in the HT + CT group than that in HT, CT, NAC, and mock group (F = 7.31, p < 0.01; Figure 4A–E). The increase in level of H2O2 in MKN-45 cells following HT + CT was consistent with increased ROS production after HT + CT of MKN-45 gastric cancer cells from BABL/c mice xenograft model. H2O2 production in the HT + CT group started to increase after 24 h, and peaked 48 h after tumor inoculation. There were much more H2O2 produced in MKN-45 human gastric cancer cells in HT + CT group compared to NAC group (p < 0.001).

The production level of H2O2 in MKN-45 gastric cancer cells from tumor models post HT and chemotherapy. There were much more H2O2 produced in MKN-45 human gastric cancer cells in HT + CT group than HT, CT, and mock group (all p < 0.05). H2O2 produced in NAC group was much lower than that of HT + CT group (p < 0.05; A: HT + CT group, B: HT group, C: CT group, D: NAC group, and E: mock group).
LC3B and Beclin1 expression in MKN-45 gastric cancer tissues examined by immunostaining and western blot assays
Immunostaining of the proteins was observed in the cytoplasm of MKN-45 gastric cancer cells. The positive immunostaining of Beclin1, LC3B, and mTOR was 93.75% (15+/16 sections), 81.25% (12+/16 sections), and 12.50% (2+/16 sections) in the HT + CT group, and 75.00% (12+/16 sections), 62.50% (10+/16 sections), and 18.75% (3+/16 sections) in the HT group, respectively. For the CT group, the values were 75.00% (12+/16 sections), 68.75% (11+/16 sections), and 25.00% (4+/16 sections); for autophagic blocker group, the values were 56.25% (9+/16 sections), 62.50% (10+/16 sections), and 75.00% (12+/16 sections); and for mock group, the values were 31.25% (5+/16 sections), 43.75% (7+/16 sections), and 87.50% (14+/16 sections), respectively (Figure 5A–E). Expression of Beclin1 and LC3B in the HT + CT group was significantly higher, while that of mTOR was significantly lower than corresponding expression in HT group, CT group, or mock group (p < 0.01, p < 0.01, or p < 0.01, respectively). In the autophagic blocker NAC group, expression of Beclin1 and LC3B was significantly decreased, while that of mTOR was significantly higher when compared with the HT + CT group (p < 0.001, p < 0.001, and p < 0.01, respectively).

The immunostaining positive cells of autophagy-related genes Beclin1, LC3B, and mTOR in MKN-45 gastric cancer tissues post chemotherapy and HT (100×). Expression of Beclin1 and LC3B in the HT + CT group was significantly higher, while mTOR was significantly lower than the corresponding expression in HT, CT, and mock group (all p < 0.05). However, expression of Beclin1 and LC3B in NAC group was lower and mTOR was higher than HT + CT group (p < 0.05; A: HT + CT group, B: HT group, C: CT group, D: NAC group, and E: mock group).
The relative expression levels of Beclin1, LC3B, and mTOR proteins in MKN-45 gastric cancer tissues were 1.014 ± 0.012, 0.923 ± 0.014, and 0.219 ± 0.037, respectively, in MKN-45 gastric cancer tissues of the HT + CT group (p < 0.05); 0.593 ± 0.036, 0.551 ± 0.032, and 0.341 ± 0.030, respectively, in HT group (p < 0.05); 0.685 ± 0.047, 0.592 ± 0.026, and 0.322 ± 0.021, respectively, in CT group (p < 0.05); 0.485 ± 0.047, 0.540 ± 0.026, and 0.382 ± 0.023, respectively in the NAC group (p < 0.05); and 0.298 ± 0.017, 0.273 ± 0.035, and 0.672 ± 0.018 in the mock group (p < 0.05; Figure 6A–E). There was significant difference in the expression of Beclin1, LC3B, and mTOR in HT + CT, HT, and CT group (F = 6.23, p < 0.01; F = 5.98, p < 0.01; and F = 7.44, p < 0.01, respectively). The expression levels of Beclin1 and LC3B in HT + CT group were significantly higher, while expression of mTOR was significantly lower than that in HT, CT, and mock group (all p < 0.05). However, there was a significant upregulation of autophagy-related gene expression of Beclin1 and LC3B (p < 0.05 and p < 0.05, respectively) and downregulation of mTOR compared with that of HT + CT group and the NAC group (p < 0.001).
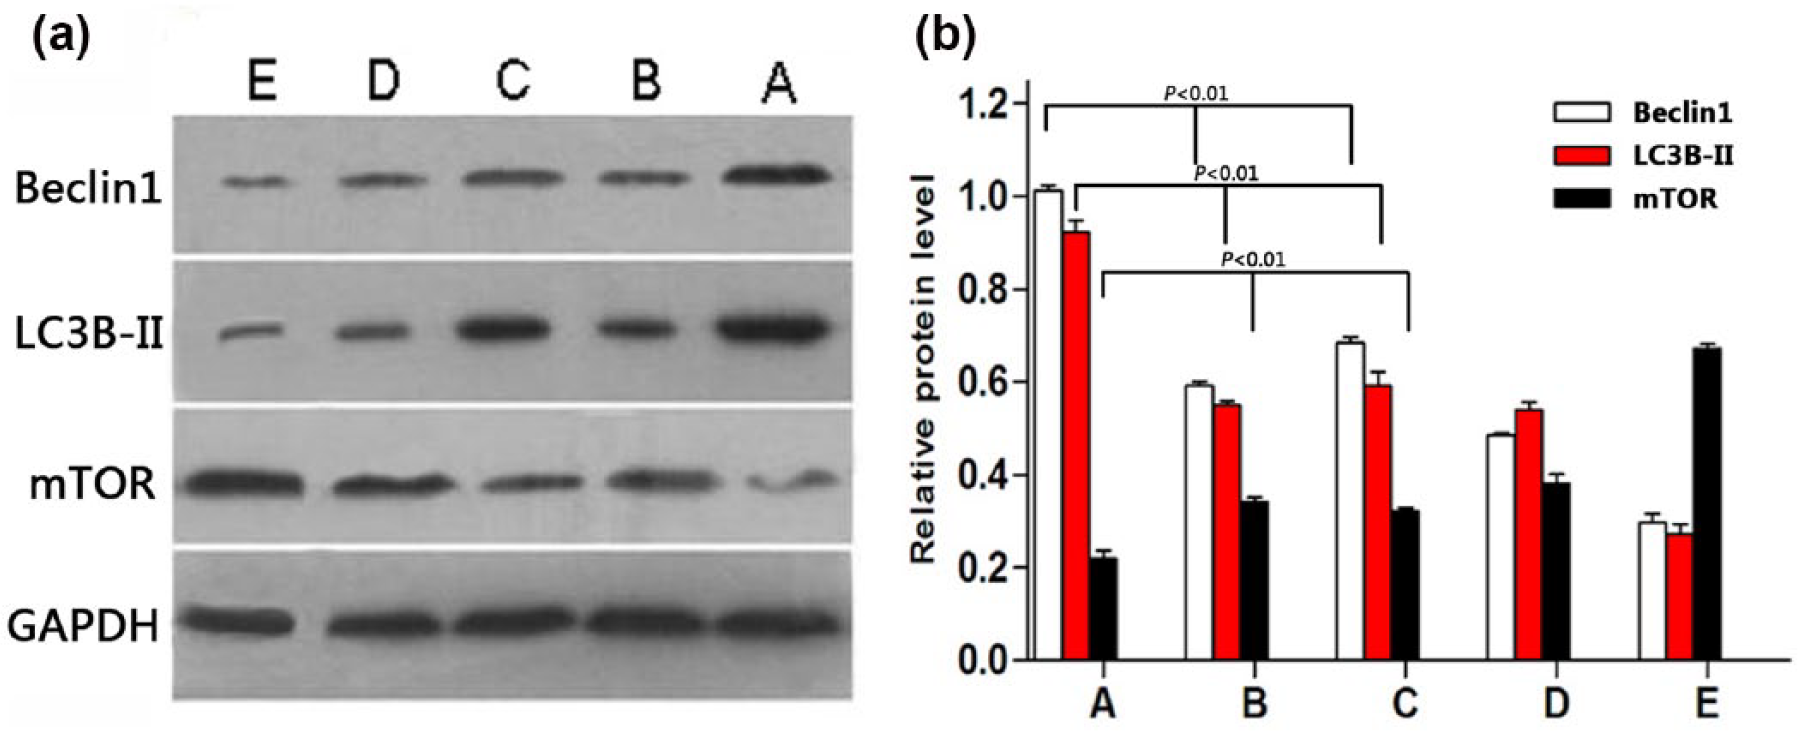
The expression levels of autophagy-related genes Beclin1, LC3B, and mTOR in MKN-45 gastric cancer tissues post chemotherapy and HT. The expression levels of Beclin1 and LC3B in HT + CT group were significantly higher, while expression of mTOR was significantly lower than that in HT, CT, and mock group (all p < 0.05). There was a significant upregulation of autophagy-related gene expression of Beclin1 and LC3B (p < 0.05 and p < 0.05, respectively) and downregulation of mTOR compared with that of HT + CT group and the NAC group (A: HT + CT group, B: HT group, C: CT group, D: NAC group, and E: mock group). (a) The expression levels of autophagy-related genes Beclin1, LC3B, and mTOR in MKN-45 gastric cancer tissues post chemotherapy and HT. (b) The quantitative expression levels analysis of autophagy-related genes Beclin1, LC3B, and mTOR in MKN-45 gastric cancer tissues post chemotherapy and HT.
Discussion
Mild HT is used in combination with CT or radiotherapy since it is known to enhance the anti-cancer effects of both the therapies.22,23 The ability of oxidative stress to induce autophagic cell death was unknown. Some studies showed that HT could increase chemotherapeutic drug uptake, influence intracellular drug distribution and metabolism, enhance the reaction rate of drug with DNA, and/or inhibit repair of DNA damage in neoplastic cells, thus improving the effects of chemotherapeutic agents.13,18,21 This study demonstrated for the first time that mild HT in combination with CT induces oxidative stress–mediated autophagic cell death in MKN-45 gastric cancer tumor model. In vivo studies on MKN-45 gastric cancer tissues of BABL/c mice, tumor sizes and wet weights of the HT + CT group were significantly lower than that of CT or HT alone, indicating that HT + CT significantly decreased tumor volumes and wet weights of MKN-45 human gastric cancer cells when compared to CT or HT. This demonstrates that HT + CT caused a greater depression of tumor growth than HT alone or CT alone. This study also showed that the proportion of dead tumor cells in gastric cancer tissues of MKN-45 tumor-bearing BABL/c mice increased after treatment with HT + CT, suggesting that HT + CT has the capacity to kill MKN-45 human gastric cancer cells, and inhibit their growth. This indicates that mild HT can enhance the susceptibility of gastric cancer cells to CT. However, the tumor volumes and wet weights of the MKN-45 human gastric cancer cells were significantly higher in the HT + CT group than in the autophagic blocker NAC group, indicating that tumor growth depression in MKN-45 tumor-bearing BABL/c mice model was induced by autophagic death of the gastric cancer cells and that HT enhanced sensitivity of the gastric cancer cells to CT through autophagic death. To our knowledge, this is the first study to conclusively demonstrate autophagy in isolated primary human cells under conditions of mild HT in combination with CT.
Oncogenesis and tumor survival are influenced by disturbances of the molecular machinery that controls autophagy. 23 Beclin1, LC3, and mTOR have been identified as tumor suppressor genes or oncogenes related to autophagic death of cancer cells.29,30,31 Changes in the expression of autophagy-related genes such as LC3, Beclin1, and mTOR are crucial for understanding how the autophagic process works and how it influences cancer. In this study, simultaneous evaluation of LC3B, Beclin1, and mTOR expression in MKN-45 gastric cancer by immunostaining revealed that downregulation of Beclin1 and LC3B or upregulation of mTOR occurred after HT + CT. Compared with CT, HT reversed the expression of autophagy-related genes Beclin1, LC3B, and mTOR and blocked the expression of autophagy-related gene induced by HT + CT. This confirms that HT + CT induces autophagic activation. Moreover, it was shown that increase in expression of Beclin1 and LC3B or decrease in expression of mTOR in MKN-45 gastric cancer tissues differed significantly between HT and CT. These results suggest that mild HT sensitizes gastric cancer cells to CT by inducing autophagic death.
Cancer cells produce higher levels of ROS than normal cells, and this contributes to cancer progression. Some studies showed that HT sensitization of cancer cells to CT occurs through ROS modulation and that mild HT in combination with oxidative stress could induce autophagic cell death.32–37 Wang et al. 24 suggested that HT sensitization through ROS modulation could be a useful strategy for improving the efficacy of hyperthermic intraperitoneal CT. Various oxidative stresses such as mild HT, CT, and radiotherapy can stimulate cancer cells to produce ROS and induce autophagic cell death. In this study, MKN-45 cells in BABL/c mice of MKN-45 human gastric cancer tumor model produced higher levels of ROS in the HT + CT group than those treated with HT or CT alone. ROS production increased 24 h after HT + CT treatment and continued to increase 48 h later. These data imply that HT + CT treatment led to significant increase in the amount of ROS produced and confirm that HT plays an important role in the generation of ROS by MKN-45 cells during HT + CT.
The results described above suggest that HT + CT induced ROS formation. However, to find out whether ROS is essential for autophagy, we tested the effect of NAC, a general anti-oxidant, and catalase, which specifically decomposes H2O2, on the formation of autophagosomes using Beclin1, LC3B, and mTOR. Low expression of LC3B and Beclin1 and high expression of mTOR were closely linked to the hyperproduction of ROS in MKN-45 from tumor-bearing mice in the HT + CT group. Low expression of LC3B and Beclin1 and high expression of mTOR may act as internal control for mild HT-induced enhancement of sensitivity of gastric cancer cells to CT through ROS modulation. In addition, the low expression of LC3B and Beclin1 and high expression of mTOR were closely linked to increased proportion of dead MKN-45 gastric cancer cells. The autophagic blocker NAC, also significantly changed the expression of autophagy-related proteins, relative to the HT + CT. These results suggest that HT + CT induces autophagic death of gastric cancer cells by increasing the amount ROS production. Mild HT enhanced sensitivity of gastric cancer cells to CT through ROS-mediated autophagic cell death.
Conclusion
This study suggested that mild HT + CT suppresses proliferation of gastric cancer cells. It is reported for the first time that mild HT enhanced sensitivity of gastric cancer cells to CT through a mechanism involving ROS-induced autophagic death.
Footnotes
Acknowledgements
The experimental protocol used in this study was approved by Cancer Hospital of Guangzhou Medical University (Guangzhou, China).
Declaration of conflicting interests
The author(s) declared no potential conflicts of interest with respect to the research, authorship, and/or publication of this article.
Funding
The author(s) disclosed receipt of the following financial support for the research, authorship, and/or publication of this article: This work was supported by Guangdong Provincial Science and Technological Program (No. 2009A030301013) and Guangdong Province Natural Science Foundation Program (No. 2014A030313494)