
Abstract
The anticancer effect of doxorubicin is closely related to the generation of reactive oxygen species. On the contrary, doxorubicin-induced reactive oxygen species induces heart failure, a critical side effect of doxorubicin. Antioxidant supplementation has been proposed to reduce the side effects. However, the use of antioxidants may hamper the anticancer effect of doxorubicin. In this study, doxorubicin-induced reactive oxygen species was shown to differentially affect cancer cells based on their TP53 genetic status; doxorubicin-induced apoptosis was attenuated by an antioxidant, N-acetylcysteine, in TP53 wild cells; however, N-acetylcysteine caused a synergistic increase in the apoptosis rate in TP53-altered cells. N-acetylcysteine prevented phosphorylation of P53 protein that had been induced by doxorubicin. However, N-acetylcysteine increased the cleavage of poly (ADP-ribose) polymerase in the presence of doxorubicin. Synergy score of 26 patient-derived cells were evaluated after the combination treatment of doxorubicin and N-acetylcysteine. The synergy score was significantly higher in TP53-altered group compared with those in TP53 wild group. In conclusion, TP53 genetic alteration is a critical factor that determines the use of antioxidant supplements during doxorubicin treatment.
Introduction
Doxorubicin (DOX), one of the most effective anticancer agents, has been used as the baseline regimen for the treatment of various cancers, including breast cancer, lung cancer, and sarcoma.1–4 It is believed that DOX exerts the anticancer effect via two different pathways: (1) DOX interacts with DNA by intercalating into the base pair and inhibiting topoisomerase II, which is required for DNA breakage and reunion; (2) reactive oxygen species (ROS) generated by DOX5,6 causes cell death in cancer cells as well as in normal cells. However, cardiomyocytes are highly vulnerable to ROS generated by DOX, leading to fatal heart failure, one of the most critical side effects of DOX. 7 Many studies have claimed that antioxidant supplements reduce DOX-related cardiotoxicity.8–12 However, a large number of oncologists are reluctant to use antioxidant supplements as it may reduce the therapeutic effect of DOX-induced ROS against cancer cells. Previous clinical studies have attempted to determine the role of antioxidant supplements in chemotherapy. However, most of the results remain unclear. A phase II clinical trial showed that vitamin C promotes chemotherapeutic response in relapsed or refractory multiple myeloma 13 However, other randomized trials showed no survival gain despite the administration of a high dose of oral antioxidants during chemotherapy.14,15 An in vitro study showed that antioxidants enhanced the effect of X-irradiation on cancer cells and protect normal fibroblasts against radiation damage. 16 However, the molecular mechanism of antioxidants, which enhances cytotoxicity of cancer cells and protects normal cells, has not been elucidated.
In this study, cancer cells were found to be differentially affected by ROS signaling; moreover, p53 was found to be a key regulator of the differential effect of ROS. DOX-induced ROS was a major cytotoxic signal in TP53 wild type cancers. However, ROS signaling did not affect the cell survival in TP53-null cancers. Moreover, DOX-induced ROS was shown to promote a strong survival mechanism in TP53-altered cancers. Here, we have presented new concepts of combination therapy resulting from TP53 alteration.
Materials and methods
Materials
Dulbecco’s modified Eagle’s medium (DMEM), RPMI-1640 medium, and fetal bovine serum (FBS) were purchased from HyClone Laboratories (Logan, UT). Eagle’s minimal essential medium (EMEM) was purchased from BioWhittaker, Lonza (Walkersville, MD). Modified Eagle’s medium (MEM), trypsin–ethylenediaminetetraacetic acid (EDTA), and antibiotic–antimycotic solution were purchased from Gibco® (Gaithersburg, MD). DOX, N-acetylcysteine (NAC), 3-(4,5-dimethylthiazol-2-yl)-2,5-diphenyltetrazolium bromide (MTT), and H2O2 were obtained from Sigma-Aldrich (St. Louis, MO).
Cell culture
A549, MCF7, MG63, and Huh7 were cultured in DMEM, and U2OS, HepG2, and SaOS2 cells were grown in MEM. HCT116, Lncap, PC3, DU145, and MDA-MB468 were cultured in RPMI-1640, while 143B was grown in EMEM. Primary tumor cell cultures were derived from patients at the Samsung Medical Center, Korea, following approval of the study design by the Institutional Review Board. All patients signed an informed consent form for the storage and culture of their samples. Patient tumors were dissociated into 1 mm pieces with a scalpel blade, further dissociated with collagenase, and plated onto culture dishes. Patient-derived cells (PDC) were grown in RPMI. All media were supplemented with 10% FBS and 1% antibiotic–antimycotic solution. Cells were incubated in a humidified atmosphere containing 5% CO2 at 37°C.
Determination of TP53 status
The TP53 status of cell lines was determined by the IARC TP53 database. 17 The TP53 transcriptional status was further confirmed by reverse transcription polymerase chain reaction (RT-PCR), followed by direct Sanger sequencing. Genomic and transcriptional status of TP53 in PDCs were determined by CancerSCAN and RT-PCR, followed by direct Sanger sequencing, respectively. CancerSCAN is an internally developed kit for targeted sequencing of ~380 cancer-related genes, including TP53, using Illumina HiSeq 2000 (Illumina Inc., San Diego, CA). Exome enrichment was performed using the Illumina TruSeq Exome Capture Kit (Illumina Inc.) or the Agilent SureSelect Kit (Agilent Technologies, Santa Clara, CA). Total RNA for RT-PCR was isolated using RNeasy (QIAGEN, Valencia, CA); 500 ng of RNA was reverse transcribed by SuperScriptIII (Life Technologies, Carlsbad, CA) according to the manufacturer’s instructions. PCR was performed with 2 µL of complementary DNA (cDNA) using an AccuPower® Hotstart PCR PreMix (Bioneer, Daejeon, Korea). The p53 transcript was amplified and sequenced using p53-specific primers: 5′-ctgggctccggggacacttt-3′ (forward) and 5′-cgcacacctattgcaagc-3′ (reverse).
Cell viability assay
Cell viability was measured using the MTT assay. For each assay, the cells were seeded at an approximate density of 60%–70% into a 96-well culture plate. Cells were incubated with different concentrations of drugs for the indicated time. The MTT solution was incubated with a final concentration of 50 µg/mL for 1 h at 37°C; the supernatant was discarded and replaced with 100 µL of dimethyl sulfoxide (DMSO) to dissolve the formazan crystals. The absorbance was measured at 570 nm by a SPECTRA max PLUS 384 instrument (Molecular Devices, München, Germany).
Evaluation of combinatorial effect of drugs
The combinatorial effect of DOX/NAC was evaluated using a Bliss independence model 18 and Loewe additivity model. 19 The Bliss expectation was calculated using the following equation: (A + B) − (A × B), where A and B are fractional growth inhibitions of drug A and B at a given dosage. The excess over Bliss (EOB) is the difference between the Bliss expectation and the observed growth inhibition of the combination of A and B at the same dosage. Plus score (>0) indicates an additive effect, and minus score (<0) indicates an antagonistic effect. Loewe synergy score was calculated using the Chalice Analyzer (Zalicus Inc., Cambridge, MA).
In the combination treatment, NAC was pretreated for 1 h prior to DOX treatment. After 2 days, the cell viability was measured by MTT assay. The additive growth inhibition was calculated by subtracting the viable value of DOX- and NAC-treated cells from the viable number of DOX-treated cells.
Apoptosis analysis
Cells were seeded in six-well plates to 70% confluence. After 2 days of experimental treatment, both the suspended and attached cells were collected, pelleted by low-speed centrifugation, washed with ice-cold phosphate-buffered saline (PBS), and resuspended in Annexin V Binding Buffer (10 mM HEPES (pH 7.4), 140 mM NaCl, and 2.5 mM CaCl2) at a concentration of 1 × 10⁶ cells/mL. Apoptosis was detected by incubating 100 µL of the cell solution with 5 µL of fluorescein isothiocyanate (FITC)-conjugated Annexin V (BD Biosciences Pharmingen, San Diego, CA) for 15 min at room temperature in the dark. Subsequently, 1× binding buffer (400 µL) was added to each tube. Cells were analyzed immediately after incubation using a BD Biosciences FACSCalibur flow cytometer and CellQuest software (Becton Dickinson, San Jose, CA).
Plasmids, small interfering RNAs, and transfection
pcDNA-p53 was cloned by inserting the p53 gene coding sequence (NM_000546) into pcDNA3.1. The p53 coding sequence was amplified using the following primers: 5′-AAG
Immunoblotting
Following treatment with drugs, the cells were washed with PBS, lysed with radioimmunoprecipitation assay (RIPA) lysis buffer (Thermo Scientific Pierce, Rockford, IL), and centrifuged at 14,000g for 15 min at 4°C. After removal of cell debris, the protein concentration was measured and normalized using the bicinchoninic acid (BCA) protein assay reagent (Thermo Scientific Pierce). A volume of 20 µg of protein from each sample was electrophoresed by sodium dodecyl sulfate–polyacrylamide gel electrophoresis (SDS-PAGE) and transferred onto a polyvinylidene difluoride (PVDF) membrane (Bio-Rad, Hercules, CA, USA). This membrane was incubated with 5% skim milk in TBST (Tris-buffered saline with Tween 20: 50 mM Tris-Cl, pH 7.5; 150 mM NaCl, and 0.1% Tween 20) for 1 h, washed, and subsequently incubated with 5% bovine serum albumin (BSA) in TBST containing an appropriate dilution of primary antibodies overnight at 4°C. The membrane was washed and incubated with 5% BSA in TBST containing the appropriate secondary antibodies conjugated with horseradish peroxidase (HRP) for 1 h at room temperature. The membrane was washed thrice with TBST, soaked in Pierce ECL Western Blotting Substrate (Thermo Scientific Pierce) and exposed to X-ray film. Immunoblotting was performed with the following antibodies: anti-phospho(S15)-p53 (Cell Signaling Technology Inc., Danvers, Massachusett), anti-cleaved PARP (poly (ADP-ribose) polymerase; Cell Signaling Technology), anti-cleaved caspase3 (Cell Signaling Technology), anti-p53 (Santa Cruz Biotechnology, Santa Cruz, CA), anti-rabbit IgG-HRP (Santa Cruz Biotechnology), and anti-mouse IgG-HRP (Santa Cruz Biotechnology), and anti-β-actin (Sigma-Aldrich).
Measurement of intracellular ROS
Intracellular ROS level was measured by dichlorodihydrofluorescein (DCF; green fluorescence) assay. OxiSelect™ Intracellular ROS Assay Kit was obtained from Cell Biolabs, Inc. (San Diego, CA). DCF-stained cells were treated with DOX for 3 and 16 h and resuspended in 2× Cell Lysis Buffer (Kit Component). The absorbance of the samples and the standard (DCF) provided with the ROS assay kit was measured according to the manufacturer’s instructions. DCF level of the samples was determined by comparing against a standard curve obtained using the standard DCF.
Statistical analysis
Data were presented as the mean ± standard deviation (SD). Comparisons between two groups were made using the non-parametric Mann–Whitney test or two-tailed t test, and the proportion of Annexin V–positive apoptotic cells was determined using the chi-square test. Analyses were performed using the GraphPad Prism 5 software (GraphPad Software, Inc., La Jolla, CA). p < 0.05 was considered to be statistically significant. Statistical differences were marked by asterisks (*p < 0.05; **p < 0.01; ***p < 0.001; and ns = not significant).
Results
Effects of antioxidant (NAC) on cancer cell lines during DOX treatment
To address whether DOX-induced ROS could increase the anticancer effect of DOX, ROS was inhibited using NAC, a ROS scavenger known to have no cytotoxicity in the range of therapeutic doses. Prior to this, we confirmed that DOX increased the intracellular ROS level (Supplementary Figure 1). Combination effect of DOX and NAC was evaluated in 14 different cancer cell lines. Administration of NAC during DOX treatment produced paradoxical responses in several cell lines (Figure 1(a)). To find genetic alterations behind this paradoxical response, targeted sequencing of 381 cancer-related genes was performed in those 14 cell lines (Figure 1(b) and Supplementary Figure 2A). Supervised computational linear regression algorithm with L1 norm (LASSO) was performed to select important gene that is highly correlated to the paradoxical response (Figure 1(c) and Supplementary Figure 2B). At the optimum value of alpha (0.4) along the LASSO path, nine genetic alterations were found to be correlated to Bliss additive scores for the combination therapy (Figure 1(c)). TP53 alteration was the most correlated gene among them. TP53 alteration of these cancer cell lines was reevaluated using Sanger’s method and were classified according to their TP53 status 17 (Supplementary Table 1 and Supplementary Figure 2C), and DOX-induced growth inhibition was assessed in each cell line. The growth of TP53 wild type cell lines was significantly suppressed compared to that of TP53-altered cell lines (Figure 1(d)). This result indicated that the TP53 status plays an important role in DOX-induced cell death. Administration of NAC during DOX combination effect of NAC and DOX were compared between the two groups. ROS inhibition reduced the cytotoxic effect of DOX in TP53 wild type cells. In contrast, TP53-mutated or TP53–null type cells became more sensitive to DOX. Moreover, the results of Bliss analysis revealed that NAC showed synergistic effects (plus scores) in a majority of the TP53-altered groups and antagonistic effects (minus scores) in the TP53 wild type group (Figure 1(e)). These results indicated that DOX-induced ROS is a crucial mechanism of cell death in TP53 wild type cells. However, the same ROS promoted survival in TP53-altered cells.
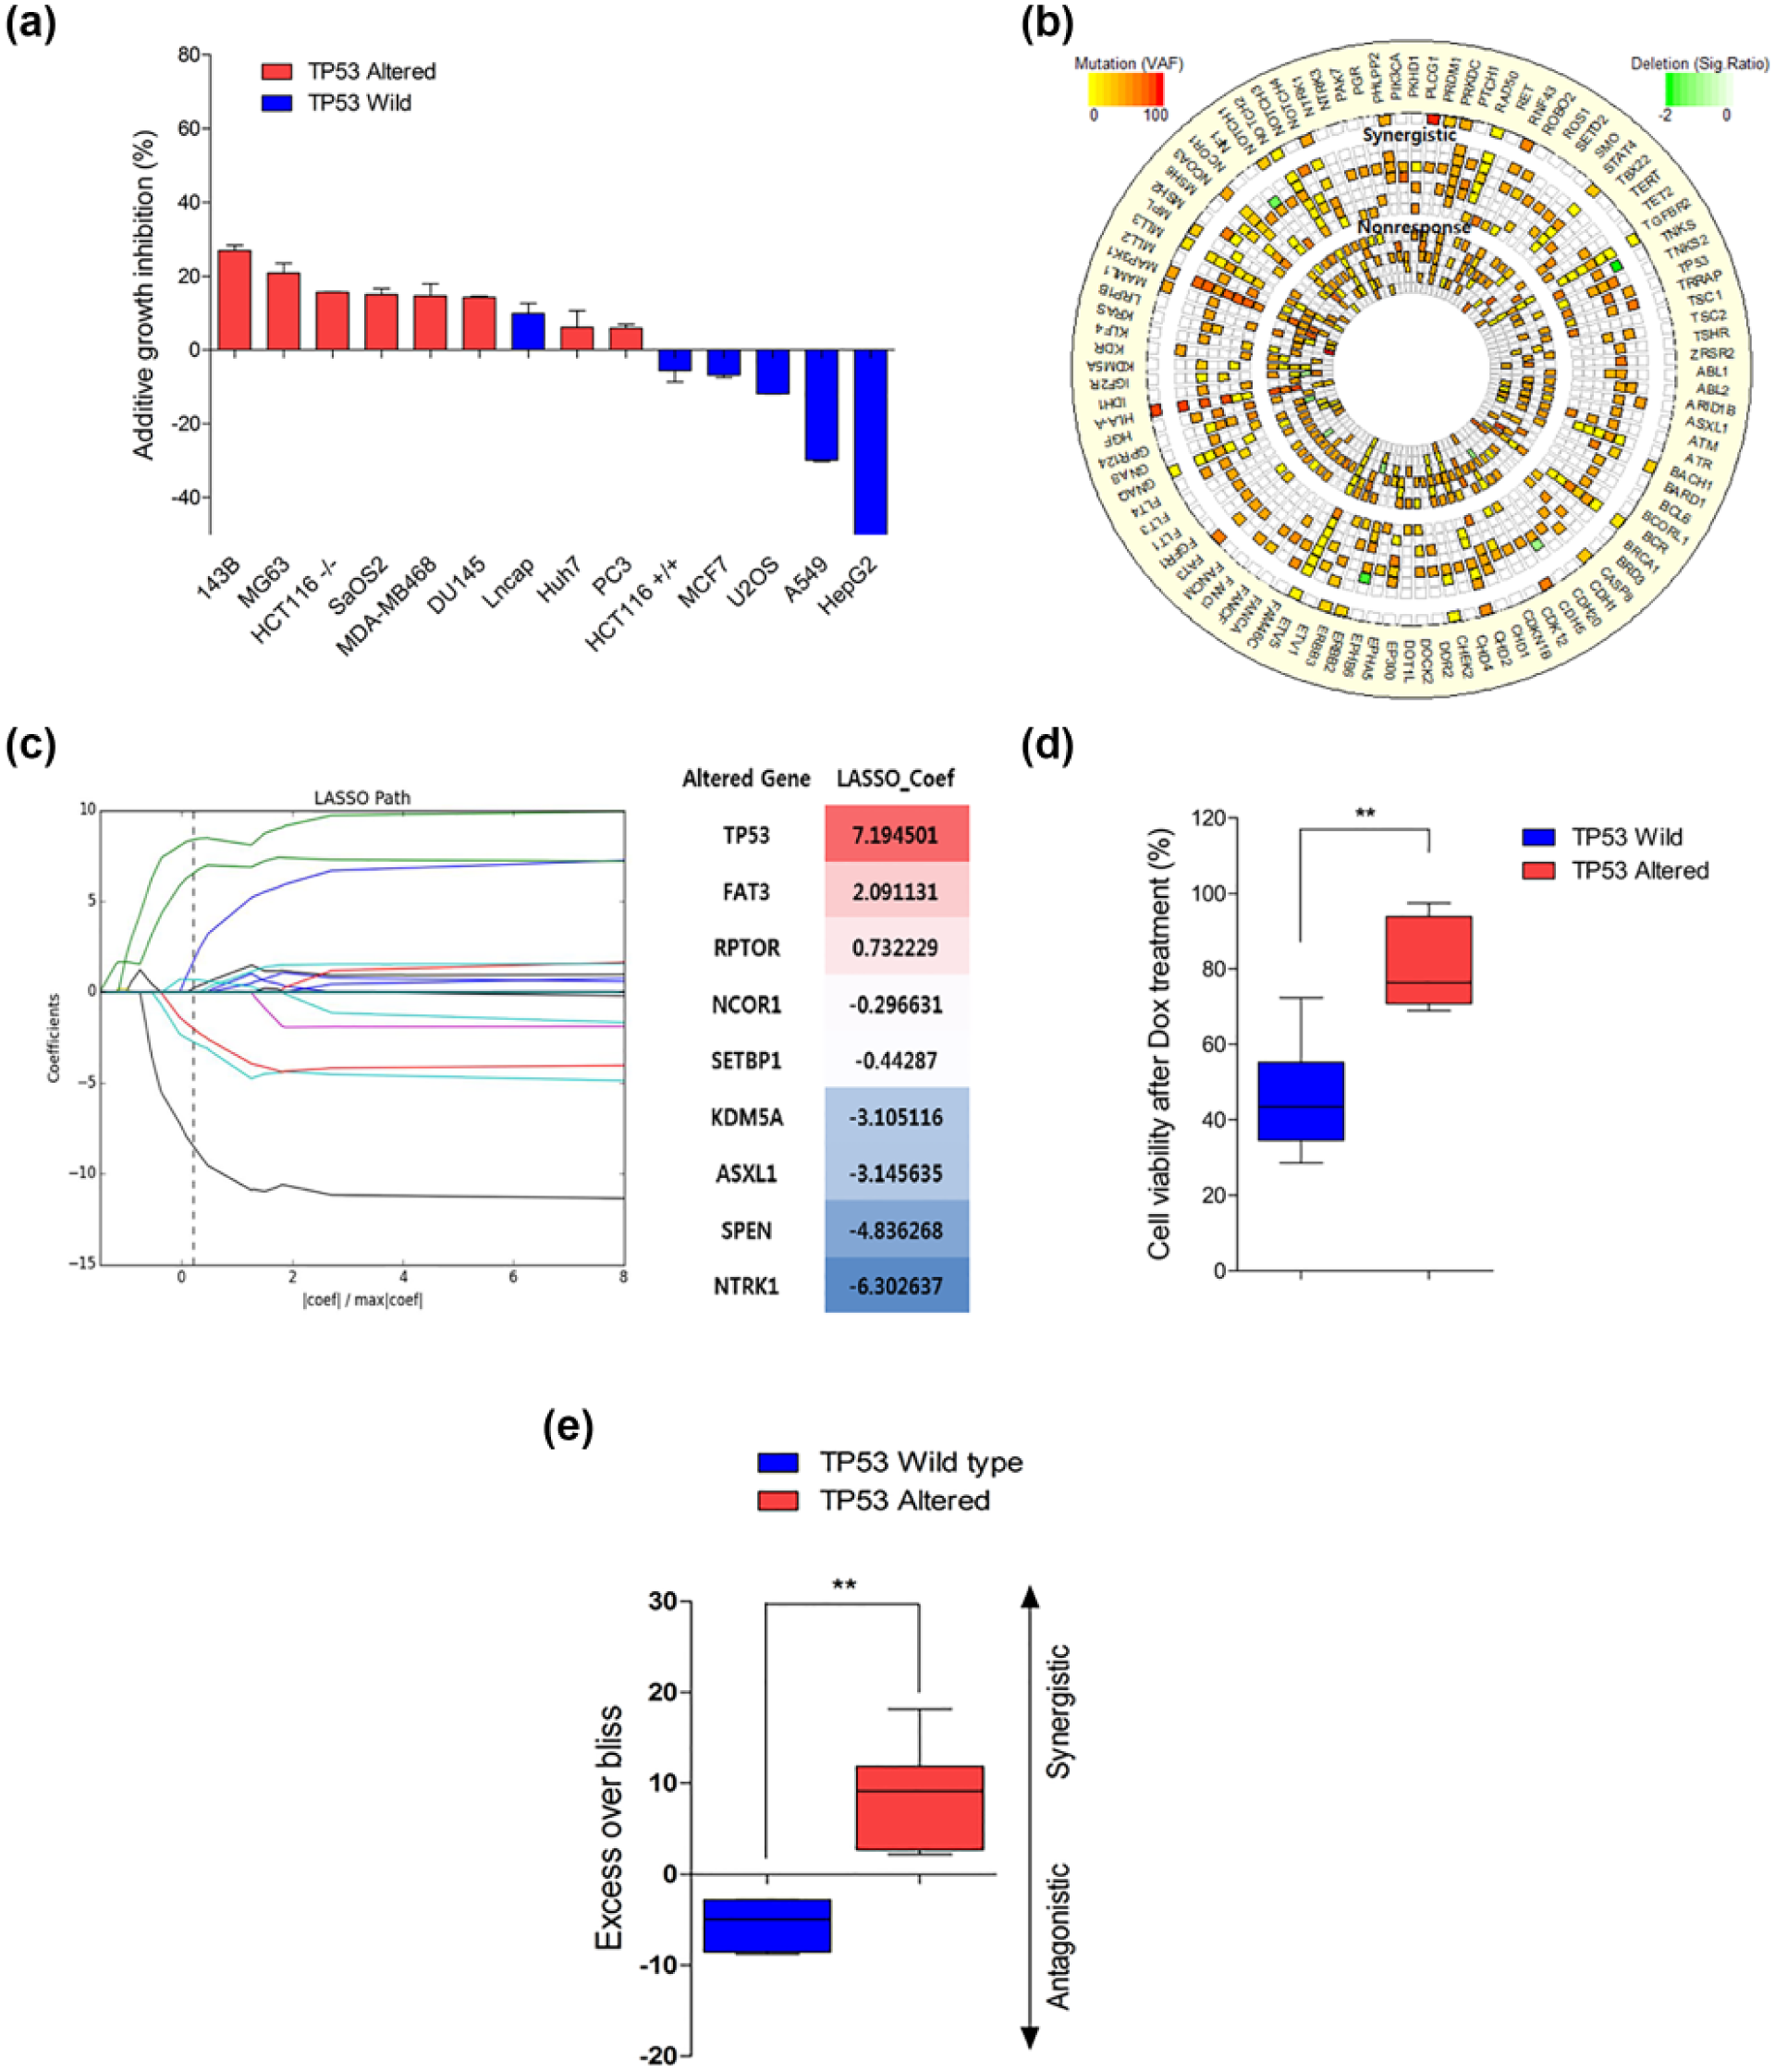
Paradoxical synergism of DOX and antioxidant (NAC) in TP53-altered cancer cell lines. (a) Additive growth inhibition of NAC during DOX treatment in cell lines. Cells were treated with 0.5 µM DOX or combination of 0.5 µM DOX and 10 mM NAC. The data were presented as the mean ± SD. (b) Next-generation sequencing was performed with genomic DNA of 14 cancer cell lines. Mutations, deletions, and amplifications of 381 cancer-related genes were screened using CancerSCAN™ (Supplementary Figure 2A). The cells were grouped according to the combination effect of DOX and NAC. The circos plot was generated incorporating mutations and deletions from the R package “circlize.” 28 (c) LASSO path was generated along the regularization parameter alpha using the LARS algorithm on the CancerSCAN data of 14 cancer cell lines. The algorithm was designed to predict Bliss additive scores for the combination therapy of DOX and NAC. The regularization parameter alpha was estimated by cross validation and set at 0.4 (Supplementary Figure 2B). (d) Relative DOX sensitivities in various cell lines. Cancer cell lines were treated with 0.5 µM DOX for 2 days, and the cell viability was measured by MTT assay. (e) Synergism and antagonism of NAC in cell lines. Box and whisker plot represents the distribution of excess over Bliss score for DOX/NAC combination. Cells were treated with each drug or the DOX/NAC combination for 2 days (0.5 µM DOX and 10 mM NAC). Excess over Bliss of TP53 wild type cell lines (n = 5; HepG2, HCT116+/+, U2OS, MCF7, and A549) and TP53-altered cell lines (n = 7; DU145, MG63, SaOS2, MDA-MB468, HCT116−/−, 143B, and Huh7) was compared by Mann–Whitney test. The statistical differences are marked by asterisks (**p < 0.01).
Paradoxical effects of a combination of DOX/NAC in isogenic cell lines
Even though the cell lines were categorized by TP53 status, each cell line had a different genetic background. Therefore, we attempted to confirm the paradoxical effects of a combination of DOX/NAC on isogenic colon cancer cell lines HCT116+/+ and HCT116−/−, which represent TP53 wild type and TP53-knockout cells, respectively. The cell lines were treated with a combination of different doses of DOX and NAC, and the synergy scores were calculated by the Loewe dose-additivity model. Synergy scores of the DOX/NAC combination indicated a synergistic effect (synergy score > 1) in HCT116−/− cells and an antagonistic effect (synergy score < 1) in HCT116+/+ cells (Figure 2(a)). We also analyzed the apoptotic rate in DOX/NAC-treated cells by Annexin V staining. ROS inhibition by NAC downregulated and upregulated DOX-induced apoptosis in HCT116+/+ and HCT116−/−, respectively (Figure 2(b)). Moreover, p53 plays an important role in DOX-induced cell death, and p53 phosphorylation is critical for its stability and activity. P53 phosphorylation was analyzed by western blotting. DOX increased the phosphorylation of p53, while NAC decreased the DOX-mediated phosphorylation of p53 (Figure 2(c)). These data indicated that the decreased apoptosis rate in HCT116+/+ was due to the downregulation of p53 by NAC. These results confirmed that inhibition of ROS paradoxically synergizes the cytotoxic effect of DOX in TP53-altered cells.
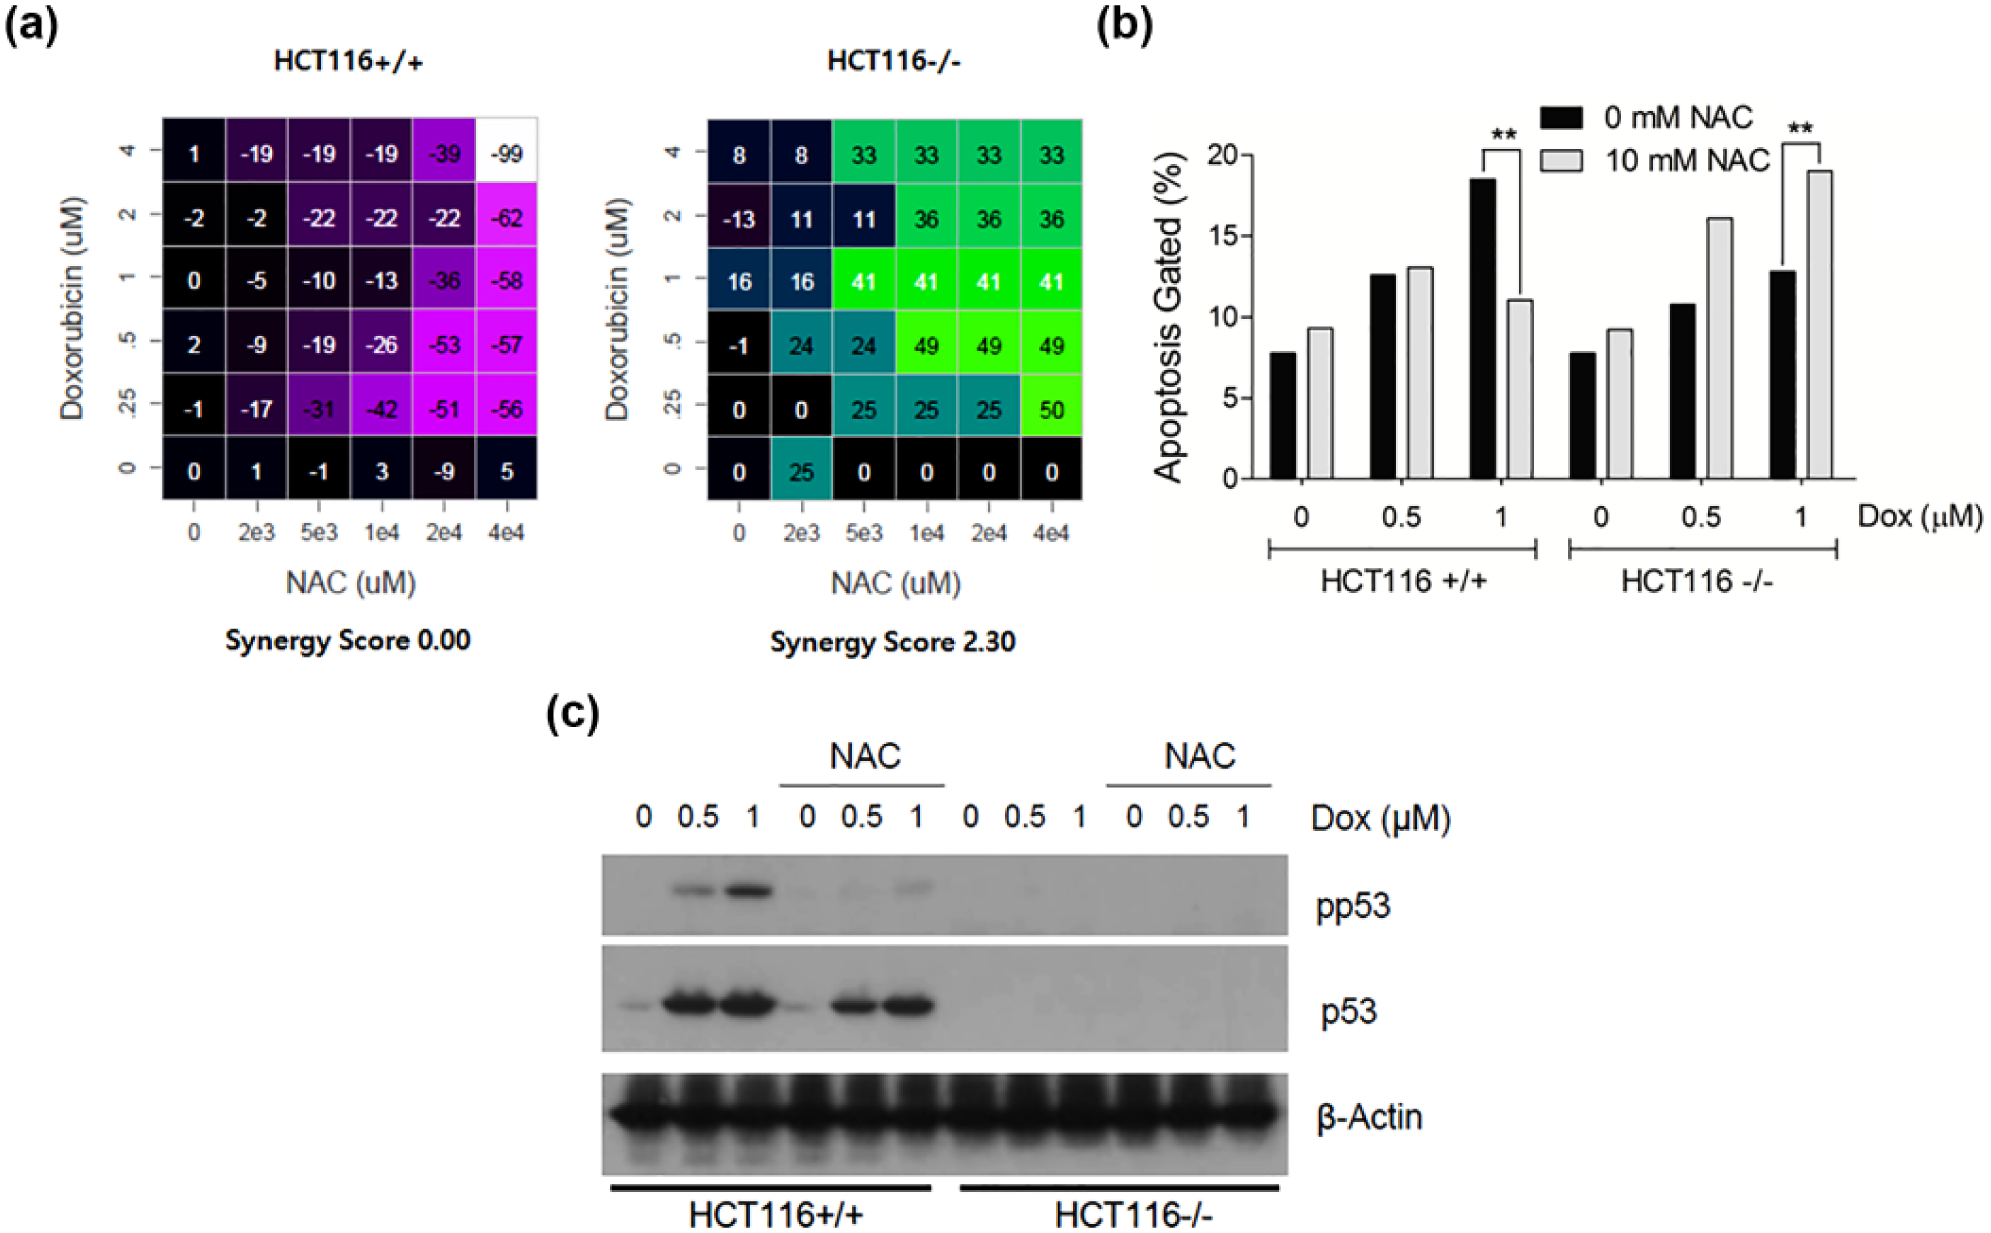
The paradoxical effect of NAC in isogenic colon cancer cell lines. (a) Synergy score of HCT116 cells when treated with DOX/NAC. HCT116 cells were treated with increasing doses of DOX (0, 0.25, 0.5, 1, 2, and 4 µM), NAC (0, 2, 5, 10, 20, and 40 mM), or a combination of the two. The synergy scores were calculated by the Loewe dose-additivity model. (b) HCT116 cells were treated with DOX or a combination of DOX and NAC. After 24 h of treatment, apoptosis was analyzed by Annexin V staining and FACS analysis. Data represent the percent of Annexin V–positive apoptotic cells. The significance of the statistical comparisons was determined by the chi-square tests (**p < 0.01). (c) Suppression of p53 by ROS inhibition. Cells were treated with DOX or a combination of DOX and 10 mM NAC. After 24 h, the cell lysates were electrophoresed by SDS-PAGE. Western blotting was performed to analyze the phosphorylation and expression of p53. β-actin was used as an internal control.
Paradoxical effects of combination of DOX/NAC in non-isogenic osteosarcoma cells
The effect of the DOX/NAC combination was further confirmed in osteosarcoma cell lines (U2OS, p53 wild type; MG63, and p53 null) with different TP53 statuses and genetic backgrounds. The synergy scores and apoptosis rate were assessed as in previous analyses using isogenic cells. Synergy scores indicated the synergy of the combination (synergy score > 1) in TP53 wild type U2OS cells and an antagonistic effect (synergy score < 1) in TP53-altered MG63 cells (Figure 3(a)). DOX-induced apoptosis was attenuated by NAC in U2OS; however, NAC caused a synergistic increase in the apoptosis rate in MG63 (Figure 3(b)). We also confirmed in activation of apoptotic indicators PARP and caspase3 using western blot assay. The cleaved form of PARP and caspase3 in U2OS was increased compared to MG63 in the treatment of DOX alone. The cleaved form of PARP and caspase3 was increased only in TP53-altered MG63 by DOX/NAC combination but not in TP53 wild U2OS cells (Figure 3(c)). To further investigate the gain and loss of TP53 function, TP53 was silenced in U2OS and introduced into MG63 cells. Silencing and expression of the p53 protein was confirmed by western blotting (Supplementary Figure 3A and B). The synergy score was calculated after treatment with different doses of the DOX/NAC combination. Silencing of TP53 led to synergistic inhibition of DOX by NAC (Figure 3(d)). In contrast, the synergic effect was abolished by TP53 expression in MG63 cells (Figure 3(e)). Isobologram analysis displayed the synergistic effect (downward shift of blue line) of the combination of DOX/NAC by TP53 silencing in U2OS cells (Figure 3(d) lower panel); however, the expression of TP53 in MG63 cells caused an antagonistic effect (upward shift of blue line) of the combination (Figure 3(e) lower panel). Results were consistent to those seen in colon cancer cells. Thus, the TP53 status was confirmed to be a critical factor mediating the paradoxical effect of the DOX/NAC combination.
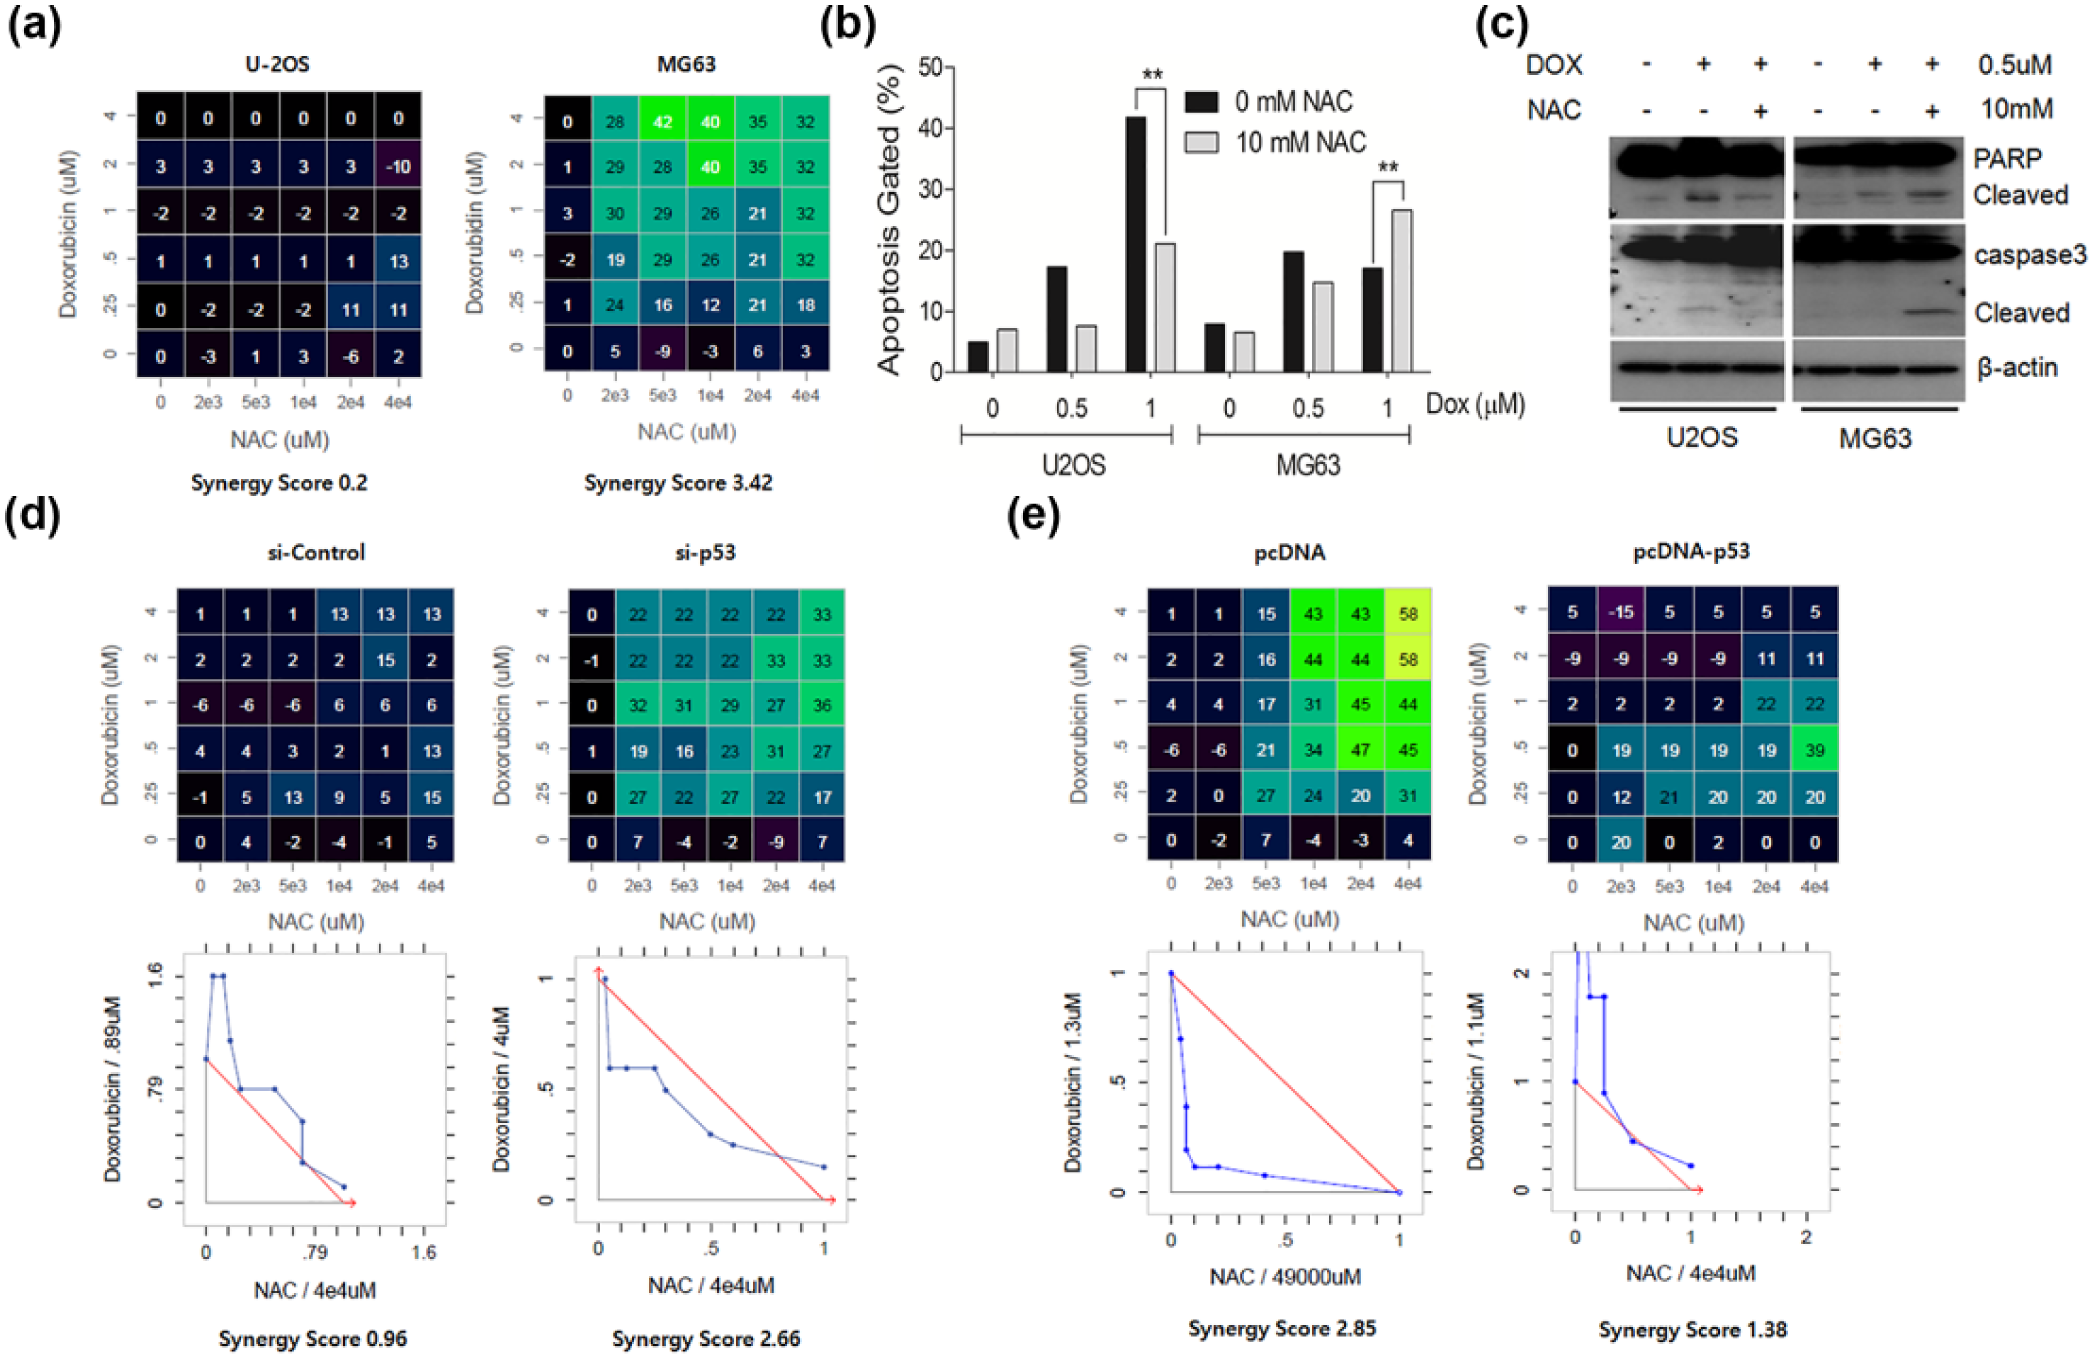
Paradoxical effect of NAC in non-isogenic osteosarcoma cell lines. The synergy scores were calculated by treating the cells with increasing doses of DOX (0, 0.25, 0.5, 1, 2, and 4 µM), NAC (0, 2, 5, 10, 20, or 40 mM), or a combination of both. Cell viability was measured by MTT assay after 2 days, and the synergy scores were calculated by the Loewe dose-additivity model. (a) Synergy scores of U2OS and MG63 when treated with DOX/NAC. (b) The paradoxical effect of DOX/NAC on U2OS and MG63 cells. Apoptosis rate was analyzed after 24 h by Annexin V staining and FACS analysis. Data represent the percent of Annexin V–positive apoptotic cells. The significance of the statistical comparisons was determined by the chi-square tests (**p < 0.01). (c) The cell death is induced by DOX/NAC combination treatment in p53-altered MG63 cells. DOX (0.5 µM) was pretreated with NAC (10 mM) for 16 h. The detection of apoptosis inducers PARP and caspase3 was determined by western blotting. (d) The synergistic effect of NAC on DOX in p53-silenced U2OS cells. (e) The antagonistic effect of NAC on DOX in p53-ectopic expressed MG63 cells. (d and e) Upper and lower panels represent the Loewe excess and isobologram, respectively.
Preclinical testing with patient-derived cancer cells
We performed preclinical test with patient-derived cells to prove the benefit of our new strategy based on the TP53 status (Figure 4(a)). The TP53 status of patient-derived tissues was determined by CancerSCAN or Sanger sequencing. TP53 wild type and TP53-altered tissues were defined as the control and experimental groups, respectively. Tissues were dissociated and PDCs were established. In total, 26 PDCs satisfied the inclusion criteria (summarized in the Methods section; control = 16 and case = 10). The effect of combinatorial treatment of DOX/NAC was tested by treating PDCs with different doses of DOX (0, 0.25, 1, 2, and 4 µM) as well as NAC (0, 2, 5, 10, 20, and 40 mM). The cell viability was assessed to calculate comparative growth inhibition and Loewe synergy scores. The response to combinatorial treatment, including the Loewe synergy matrix and isobologram, is listed in Supplementary Figure 4. The tumor type, TP53 status, and synergy scores of each PDC are summarized in Supplementary Table 2.

Preclinical test and the results. (a) Preclinical test flow diagram. (b) Synergistic effect of NAC on DOX in TP53-altered PDCs. Genomic status of TP53 was determined by deep sequencing (CancerSCAN™) and p53 transcript was sequenced after RT-PCR. Cells were treated with increasing doses of DOX (0, 0.25, 0.5, 1, 2, 4 µM), NAC (0, 2, 5, 10, 20, 40 mM), or a combination of DOX and NAC. Cell viability was measured by MTT assay after 1 day. The synergy score of each PDC was calculated by the Loewe dose-additivity model. Box and whisker plot represents the distribution of synergy score of the combinational therapies (DOX/NAC) from Supplementary Table 2. The statistical difference between TP53 wild and TP53-altered group was compared by the Mann–Whitney test. Statistical differences are marked by asterisks (***p < 0.001).
The average synergy scores of the control group were 0.468 ± 0.599 (DOX/NAC), indicating the antagonistic effect of NAC on DOX. The average synergy scores of the experimental group were 2.906 ± 0.808 (DOX/NAC), indicating a synergistic effect. The difference between these groups, assessed by the non-parametric method, was significant (p < 0.001; Figure 4(b)). The results of these preclinical trials indicated that the combination of DOX/NAC has a synergistic effect in TP53-altered cancers. The TP53 status is a critical factor predicting the response of DOX/NAC combinatorial cancer therapy.
Discussion
In accordance with the concerns of many clinicians, our study showed that antioxidant administration reduced the chemotherapeutic effect of DOX in TP53 wild type cancers. In contrast, antioxidant promotes the chemotherapeutic effect in TP53-altered cancers by inhibiting DOX-induced ROS.
Our preclinical test using PDCs also showed that a combination of antioxidant and DOX synergistically and significantly affects TP53-altered cancers. Thus, we concluded that patients with TP53-altered cancers could be safely subjected to antioxidant supplementation. This might also benefit the patients by reducing the risk of heart failure, a critical adverse effect of DOX-induced ROS. However, antioxidant supplementation should be avoided in patients with TP53 wild type cancers, as the results of our preclinical study confirmed that the chemotherapeutic effect of DOX was significantly reduced by antioxidant administration. Cancers result from complex genetic mutations; single tumors also express genetic heterogeneity. Thus, our simple therapeutic strategy, based on TP53 alteration, cannot be applied to all clinical cases. However, we expect this study will trigger more clinical and preclinical research regarding the crosstalk between TP53 alteration and chemotherapy.
The paradox of ROS in cancer survival is well known. Low ROS levels promote tumor angiogenesis and growth, and mediate cancer invasion, metastasis, and even resistance to chemotherapy.20–24 In contrast, high doses of ROS results in an increase in the cytotoxic effect in cancers. 25 However, this theory is challenged because of the lack of an obvious dose-response relationship between intracellular ROS and cytotoxicity in cancers. 26 Therefore, it is hard to predict the effect of ROS-based therapy without clearly understanding the mechanism behind it. TP53 is closely linked to the paradox of ROS. Specifically, activated P53 regulates the level of NRF2 (nuclear factor erythroid–related factor 2) through p21 upregulation. NRF2 regulates a number of genes which encodes for antioxidant enzymes. In high dose of ROS, p53 inhibits NRF3 and activates apoptosis. 27
The resistant to oxidative stress is often observed in TP53-altered cancers. Mutant P53 protein stimulates genes that encode antioxidant proteins, 27 which explains that TP53 mutant cancers are resistant to DOX-induced ROS. However, further studies should be needed to explain the mechanism behind the synergistic effect of DOX and antioxidant in TP53-altered cancers.
In conclusion, the antioxidant NAC is a beneficial supplement during DOX treatment in patients with TP53-altered cancers, which promotes a chemotherapeutic effect and reduces the adverse effect of DOX-induced ROS.
Footnotes
Declaration of conflicting interests
The author(s) declared no potential conflicts of interest with respect to the research, authorship, and/or publication of this article.
Funding
The author(s) disclosed receipt of the following financial support for the research, authorship, and/or publication of this article: This study is partially supported by Basic Science Research Program through the National Research Foundation of Korea (NRF) funded by the Ministry of Education and Science Technology (MEST; 2016R1E1A1A0191433).
References
Supplementary Material
Please find the following supplemental material available below.
For Open Access articles published under a Creative Commons License, all supplemental material carries the same license as the article it is associated with.
For non-Open Access articles published, all supplemental material carries a non-exclusive license, and permission requests for re-use of supplemental material or any part of supplemental material shall be sent directly to the copyright owner as specified in the copyright notice associated with the article.