
Abstract
Achaete-scute homolog 1 is a lineage oncogene of high-grade pulmonary neuroendocrine tumors. Due to the relatively few studies investigating the epigenetic regulation of achaete-scute homolog 1 expression, we wanted to address whether DNA methylation of the achaete-scute homolog 1 CpG island is associated with clinicopathological features in pulmonary neuroendocrine tumors and to investigate its effect on the expression of this gene. Here, We performed multiplex immunohistochemistry (PerkinElmer, Waltham, MA, USA) to check for achaete-scute homolog 1 and Notch homolog 1 expression in 139 pulmonary neuroendocrine tumor samples. Quantitative measurements of achaete-scute homolog 1 CpG island methylation were conducted using the MassARRAY EpiTYPER (Sequenom, San Diego, CA, USA). The correlation between immunohistochemistry data, methylation data, and clinicopathological information was analyzed. Achaete-scute homolog 1 methylation levels were increased in pulmonary neuroendocrine tumors compared to those in normal controls (0.107 vs 0.061, p < 0.001), and among the achaete-scute homolog 1 CpG island, only CpG_6 and CpG_7.8 showed higher methylation levels in pulmonary neuroendocrine tumors (0.208 and 0.135, respectively) compared to those in normal lung tissues (0.072 and 0.087, respectively; p < 0.001). Moreover, the methylation level of CpG_6.7.8 was higher in patients with stage I pulmonary neuroendocrine tumors than in patients with stage II/III pulmonary neuroendocrine tumors (0.19 ± 0.16 vs 0.14 ± 0.07, p = 0.012). The hypermethylation of CpG_6.7.8 showed an inverse correlation with achaete-scute homolog 1 protein expression (r = −0.408, p = 0.007, Spearman test). Finally, we found that CpG_6.7.8 of the achaete-scute homolog 1 CpG island is frequently hypermethylated in early-stage pulmonary neuroendocrine tumors, and this aberrant hypermethylation is negatively correlated with achaete-scute homolog 1 expression in this tumor spectrum.
Keywords
Introduction
Pulmonary neuroendocrine tumors (PNETs) encompass typical carcinoid (TC), atypical carcinoid (AC), large cell neuroendocrine carcinoma (LCNEC), and small cell lung cancer (SCLC) and account for approximately 20%–25% of lung cancers.1,2 Although PNETs represent a spectrum of tumors that share neuroendocrine morphology and ultrastructural differentiation, as demonstrated through histology and immunohistochemistry, their clinical behavior is extremely diverse. The clinical outcomes of LCNEC and SCLC are very poor with an overall 5-year survival rate ranging from 15%–57% and 5%, respectively, 3 whereas AC and TC patients show a 5-year survival rate of 61%–88% and 92%–100%, respectively. 4 A critical molecular difference associated with the biological outcome and prognosis of PNETs is the expression of the achaete-scute homolog 1 (ASCL1) gene.
ASCL1 (human achaete-scute homolog 1 or hASH1, ASH1 and MASH1 in rodents), a pivotal basic helix-loop-helix (bHLH) transcription factor for neuroendocrine differentiation in the lung, is expressed in pulmonary neuroendocrine cells and SCLC. 5 The ASCL1-promoter region contains a CpG island (CGI), a general enhancer containing SP1-like binding sites, and two specific repressor regions. 6 The proximal repressor region contains a binding site for the transcription factor hairy and enhancer of split 1 (HES-1), an inhibitor of ASCL1 transcription in SCLC. 7 In normal tissues, ASCL1 is only transiently activated during certain stages of fetal neuronal development, and is not expressed in normal adult tissues except for low levels in pulmonary neuroendocrine cells, and the telencephalic subventricular zone of the brain.8,9 In lung cancer, ASCL1 expression was identified in 82% of lung neuroendocrine carcinomas (LCNEC and SCLC) and in only a few lung carcinoids (10%), and it can be considered as a diagnostic marker to differentiate between neuroendocrine carcinomas and carcinoids. 10 ASCL1 expression was associated with poor prognosis in patients with SCLC. 11 The ASCL1 transgene promotes the development of neuroendocrine lung tumors in coordination with the SV40 large T antigen. 12 The suppression of ASCL1 expression by RNA interference has been shown to induce cell cycle arrest and apoptosis in vitro as well as the inhibition of tumor growth in vivo in an ASCL1-dependent manner. 13 ASCL1 is required for neuroendocrine tumor formation in the Trp53/Rb1/p130 mouse model. 14 A specific transcriptional target of ASCL1 is the B-cell lymphoma 2 (BCL2) anti-apoptotic regulator. 14 Therefore, anti-BCL2 therapy has been proposed as a means to target ASCL1-driven tumors. 15 ASCL1 expression may be used to select lung cancer patients who are likely to respond to BET inhibitor treatment. 16 These reports demonstrate that ASCL1 is a lineage-survival oncogene of high-grade neuroendocrine lung cancers14,17 that plays an important role in the pathobiology of PNETs.
Many studies demonstrate that ASCL1 expression is downregulated by Notch homolog 1 (NOTCH1) during normal neuronal development and in some neuroendocrine cancers, such as the medullary thyroid cancer and SCLC.18–20 In the Notch signaling pathway, NOTCH1, a well-studied Notch receptor, upregulates the expression of HES-1, a transcription factor in the HES family. HES-1 binds to a specific recognition sequence in the proximity of the ASCL1 promoter and triggers ASCL1 downregulation. 7 DNA methylation is also a candidate mechanism for epigenetic regulation of ASCL1 expression. Poirier et al. 21 employed a methylome and transcriptome analyses to define distinct subtypes of SCLC that cannot be distinguished by standard histological approaches, as these epigenetically distinct subgroups among histologically and genetically similar SCLC cases may represent clinically important populations. 22 These subgroups have widely differing transcriptional profiles and can be delineated by the differential expression of ASCL1 and the neuronal differentiation 1 (NEUROD1) gene. 22
Despite the importance of DNA methylation, only a few studies have focused on the epigenetic regulation of ASCL1 expression in PNETs. Given the lack of studies investigating ASCL1 DNA methylation, we aimed to explore the role of the methylation of the ASCL1 CGI on the expression of this gene and on the clinical features in PNETs.
Materials and methods
Patient samples
Among the archival tissues of PNETs in the Asan Medical Center (Seoul, Korea), we selected 139 surgically resected cases dated between January 2003 and December 2014 that have available specific formalin-fixed, paraffin-embedded (FFPE) blocks for tissue microarray (TMA) and molecular studies. The 139 PNETs included 31 TCs, 19 ACs, 30 LCNECs, and 59 SCLC. The retrospective medical record review was conducted to obtain clinicopathological information such as age, gender, smoking history, tumor size, pathological stage, and tumor type.
TMA and multiplex fluorescent immunohistochemistry
TMAs were performed using a tissue-arraying device (Beecher Instruments Inc., Sun Prairie, WI, USA), as previously described. 23 Briefly, matched hematoxylin and eosin–stained slides of 139 FFPE tumor blocks were reviewed by a pathologist to define the representative tumor region with high cellularity. Two 2-mm cores were obtained from the marked tumor area on each donor block and inserted into a recipient block.
Three-micrometer-thick sections of TMAs were prepared and stained using the PerkinElmer Opal 3-plex Kit (NEL791001KT; PerkinElmer, Waltham, MA, USA), as reported. 24 Briefly, all TMA slides were dewaxed in xylene and rehydrated in ethanol. Antigen retrieval was performed in citrate buffer at pH 6.0 using a microwave oven (Sharp Carousel, Mahwah, NJ, USA). ASCL1 primary antibodies (1:300; clone 24B72D11.1; BD Pharmingen, San Jose, CA, Mahwah, NJ, USA) were applied to the slides and detected using anti-mouse horseradish peroxidase (HRP) secondary antibodies (SuperPicTure™ Polymer Detection kit; Life Technologies, Grand Island, NY, USA). Then, all the slides were incubated in Cy3 tyramide signal amplification (TSA) plus (1:50). The staining process was repeated at the microwave treatment step for the next target. NOTCH1 primary antibodies (1:400; clone EP1238Y; #ab52627; Abcam, Cambridge, MA, USA), anti-rabbit HRP secondary antibodies (SuperPicTure™ Polymer Detection kit), and Cy5 TSA plus (1:50) were used to detect NOTCH1. Once all targets were detected, the slides were heated in citrate buffer again using the microwave oven, followed by 4′,6-diamidino-2-phenylindole (DAPI) nuclear counterstaining (1:1000) and mounted on a coverslip in VECTASHIELD Antifade Mounting Medium (Vector Laboratories, Burlingame, CA, USA).
Multispectral imaging and analysis
Multispectral imaging and analysis were described in detail by Feng et al. 25 Briefly, all multiplexed images were acquired under fluorescent conditions using the Vectra slide scanner (PerkinElmer, Hopkinton, MA). In each TMA core, a 2 × 2 representative tumor region was captured in high-power (200×) imaging. The inForm software (PerkinElmer, Hopkinton, MA) was used for advanced image analysis. This software was trained to analyze the fluorophore spectra, classify tissues into two areas (tumor and non-tumor), and define cell components (nucleus, cell membrane, cytoplasm). After cell segmentation, all tumor cells were categorized into four types: ASCL1+ NOTCH1−, ASCL1− NOTCH1+, ASCL1+ NOTCH1+, and ASCL1− NOTCH1−. The percentage of tumor cells in each category was automatically scored and exported to an excel file.
DNA extraction
DNA extraction from FFPE samples (139 tumor tissues and 50 normal control samples) was performed using the NEXprep FFPE Tissue Kit (#NexK-9000; Geneslabs, Seongnam, Korea). Considering the tumor size and cellularity, we prepared two to six 6-µm-thick sections per FFPE block. After deparaffinization in xylene and rehydration in absolute ethanol, tissue pellets were completely lysed in lysis buffer and treated with proteinase K and incubated overnight at 56°C. Magnetic beads and solution A were added in tissue lysis buffer and incubated for 3 min at 25°C. After incubation for 5 min on the magnetic stand, the supernatant was discarded and the pellet was washed three times with 85% ethanol. Bead pellets were air-dried for 5 min and eluted in 50 µL of DNase-and RNase-free water (Invitrogen, Carlsbad, CA, USA). Genomic DNA (gDNA) was quantified using Nanodrop 2000 (Thermo Fisher Scientific, Wilmington, Delaware, USA) with the 260/280 ratio in the 1.6–2.0 range.
DNA bisulfite treatment and quantitative DNA methylation analysis
Bisulfite conversion of gDNA was achieved using the EZ DNA Methylation Kit (Zymo Research, Irvine, CA, USA). Briefly, 2 µg of gDNA was incubated with sodium bisulfite, followed by a desulfonation step to remove the sulfite moiety. The washing and elution steps were performed to obtain 40 µL of bisulfite-treated gDNA. After bisulfite modification, the non-methylated cytosine residues in the gDNA were deaminated and changed to uracil, whereas methylated cytosine remained unchanged.
High-throughput quantitative DNA methylation analysis using the MassARRAY EpiTYPER platform (Sequenom, San Diego, CA, USA) was performed as previously described. 26 The ASCL1 primer pair was designed using the EpiDesigner tool from Sequenom (forward: 5′-aggaagagagGTAGGAAGGGTTGTTGGGGT-3′ and reverse: 5′-agtaatacgactcactatagggagaaggctCTACACCCAAATTCTCTCTATATCCC-3′) and used in the polymerase chain reaction (PCR) of bisulfite-treated gDNA. Sub-sequently, 1.7 µL of RNase-free water and 0.3 µL of shrimp alkaline phosphatase (SAP) were added to the PCR products and incubated for 40 min at 37°C and for 5 min at 85°C to dephosphorylate all unincorporated deoxynucleotide triphosphates (dNTPs) after the PCR reaction. In vivo transcription and the T-cleavage reaction were performed at the same time using all reagents from Sequenom for 3 h at 37°C. After adding 6 mg of Clean Resin (Sequenom), 18–20 nL of the cleavage reaction were spotted robotically onto the SpectroCHIP (Sequenom) using the MassARRAY Nanodispenser (Sequenom). Matrix-assisted laser desorption/ionization time of flight (MALDI-TOF) mass spectrometry (Sequenom) was utilized to obtain the mass spectra, followed by the generation of DNA methylation data using the EpiTYPER v1.0.3 software (Sequenom).
Statistical analysis
Heatmaps were constructed by hierarchical cluster analysis in the R studio program for the general visualization of DNA methylation data in the 139 PNETs and the 50 normal control cases. The methylation data and multiplex immunohistochemistry (mIHC) data were checked for distribution and homogeneity using the Kolmogorov–Smirnov test and Levene’s test, respectively. All populations were of unequal sizes and unequal variances, and therefore, the Welch test followed by the Games–Howell test was utilized to check for differences in the methylation levels of ASCL1 CGI and for the clinicopathological features in the observed population (p < 0.05 was considered as a significant). We performed receiver operating characteristic curve (ROC) analysis to define the sensitivity and specificity of the CpG_6.7.8 methylation level for distinguishing LCNEC from SCLC. Venn diagrams were created using the Venny 2.1 software. 27 SPSS 22.0 (IBM Corp., Armonk, NY, USA) and R studio were used for statistical analysis.
Results
ASCL1 expression may be downregulated in NOTCH1-dependent manner
We evaluated ASCL1 and NOTCH1 expression in 139 PNET samples using TMAs and a multispectral quantitative immunohistochemistry platform (Vectra, PerkinElmer, Hopkinton, MA, USA; Figure 1(a)). For a case to be considered positive, the case had to contain >10% of the tumor cells that had either ASCL1 immunoreactivity in the nucleus or NOTCH1 staining in the cytoplasm or on the cell membrane. One LCNEC case was excluded due to missing tissues during the staining process. The representative immunohistochemistry data are presented in Table 1 and Figure 1(b). ASCL1 expression and NOTCH1 expression were generally mutually exclusive and 42/138 (30%) of the cases and 49/138 (36%) of the cases were positive for ASCL1 or NOTCH1, respectively. Interestingly, 14/138 (10.14%) of the cases expressed both ASCL1 and NOTCH1 in the tumor areas, and these cases belonged to either SCLC or LCNEC. We also found that 61/138 (44.2%) of the cases were negative for both ASCL1 and NOTCH1 staining. There were significant differences in ASCL1 positive rates among the various histological types: 49% (29/59) of SCLC, 33% (10/30) of LCNEC, 5% (1/19) of AC, and 6% (2/31) of TC presented positive ASCL1 staining. The expression level of ASCL1 also increased from TC to AC, LCNEC, and SCLC (mean ± standard deviation (SD) = 2.23 ± 4.95%, 4.11 ± 12.6%, 15.38 ± 23.24%, 22.03 ± 26.9%, respectively). However, the differences in the expression were only statistically significant for SCLC versus TC, SCLC versus AC (p < 0.001), and LCNEC versus TC (p = 0.02; Figure 1(c)). We found that 63/138 cases (45.65%) showed an inverse correlation between ASCL1 and NOTCH1 expression (r = −0.724, p < 0.001, Spearman test). These results suggested that for half of the cases we investigated, ASCL1 expression may be downregulated in a NOTCH1-dependent manner. We therefore evaluated the effect of DNA methylation on ASCL1 expression.

Multispectral immunohistochemical analysis of ASCL1 and NOTCH1 co-staining in 138 PNET cases. (a) Representative 2-plex images with ASCL1 (green), NOTCH1 (red), and DAPI (blue) co-staining. The upper left panel shows ASCL1+ NOTCH1− case, the upper right panel shows ASCL1− NOTCH1+ case, the lower left panel shows ASCL1+ NOTCH1+ case, and the lower right panel shows ASCL1− NOTCH1− case (original magnification: 200×). (b) Heatmap of 2-plex immunohistochemical data in 138 PNETs. The ratio of positive tumor cells increases from black (lowest) to red (highest). The three columns represent three categories: ASCL1+ NOTCH1+ (co-expression), NOTCH1 expression, and ASCL1 expression, respectively. Each row represents one sample. (c) Multiple comparisons of ASCL1 and NOTCH1 expression among four tumor types (*p < 0.05; **p < 0.01; ***p < 0.001, Games–Howell test).
Intersection of ASCL1 and NOTCH1 expression in 138 PNET cases.

ASCL1: achaete-scute homolog 1; NOTCH1: Notch homolog 1; PNET: pulmonary neuroendocrine tumor.
Frequent methylation of the ASCL1 CGI in PNET
We evaluated the methylation profile of the ASCL1 CGI in 139 PNETs and in 50 normal lung tissues. The examined region covered 169 base pairs and contained 17 CpG sites. By employing the MassARRAY EpiTYPER analysis, the region was divided into eight CpG units. Due to technical and sample quality limitations, we finally analyzed five CpG units covering nine CpG sites in 128 PNETs and 47 normal lung tissues (Figure 2(a)). We found that the overall methylation value of the five CpG units in the entire normal control group (mean ± SD = 0.061 ± 0.043) was significantly lower than the methylation value in the tumor cases (mean ± SD = 0.107 ± 0.121; p < 0.001, Welch test; Figure 2(b)). Multiple comparisons also indicated that the overall methylation levels of the five CpG units in four tumor types were notably higher than the levels in the normal group (Table 2 and Figure 2(c)). The heatmap was constructed by hierarchical clustering and was aimed at defining subgroups in the methylation dataset of the five CpG units, among the tumor and the normal samples (Figure 2(d)). Three clusters were obtained: CpG_6, CpG_7.8, and a third group containing CpG_9.10, CpG_12, and CpG_15.16.17. All CpG units were clustered together, showing a similar methylation pattern in all cases. We compared the methylation levels in each CpG unit between normal and tumor tissues (Figure 3 and Table 3). The average methylation values of the three CpG sites located near the translational start site (CpG_6 and CpG_7.8) in the tumor cases (mean = 0.208 and 0.135, respectively) were significantly higher than the values in the normal samples (mean = 0.072 and 0.087; p < 0.001, Welch test). In contrast, there were no significant differences in the methylation levels in the remaining six CpG sites (CpG_9.10, CpG_12, and CpG_15.16.17) between tumor and normal tissues.
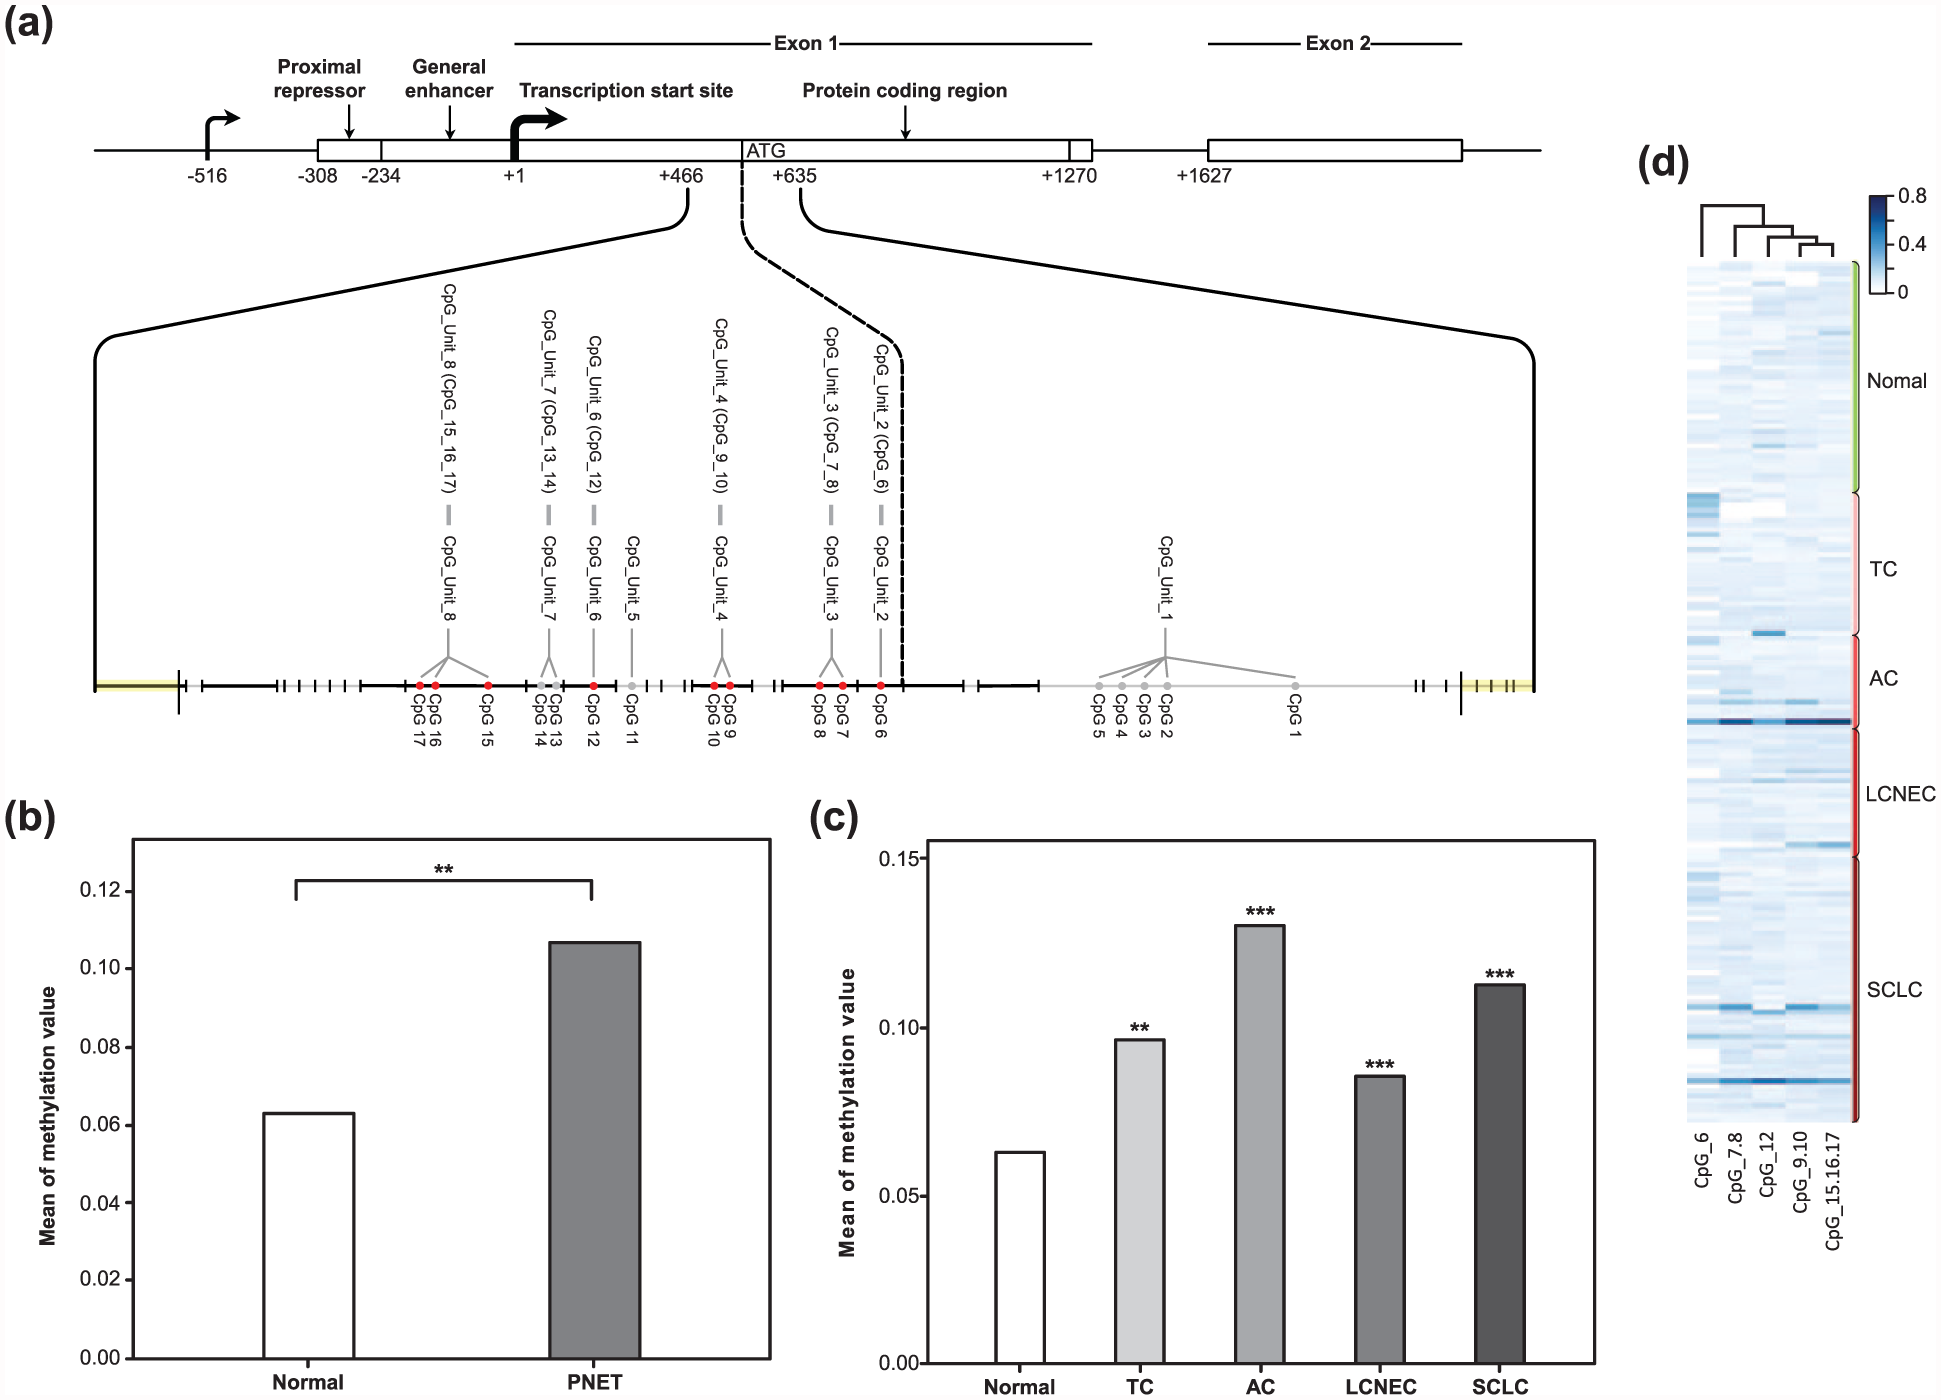
Quantitative methylation of the ASCL1 CpG island in PNETs and in normal samples. (a) Schematic of the ASCL1 gene structure and the CpG sites located in the analyzed region. Gray lines represent the fragmentation of the ASCL1 CGI amplicon. Red dots represent the measured CpG sites and gray dots represent the unmeasured CpG sites. (b) Comparison of the overall methylation value of the ASCL1 CpG island between PNETs and the normal control group (**p < 0.01, Welch test). (c) Average methylation levels of ASCL1 CpG island in individual tumor types (TC, AC, LCNEC, and SCLC) and in normal control subjects (**p < 0.01; ***p < 0.001, Games–Howell test). (d) Heatmap constructed by hierarchical cluster analysis showing the methylation pattern of the ASCL1 CpG island in 129 PNETs and 47 normal controls. Relative methylation levels are displayed with different colors and increase from light blue to dark blue, while white indicates missing values. Each row depicts one sample. Each column depicts one CpG site.
Multiple comparisons of the overall methylation rate of ASCL1 CpG island between the individual tumor types and normal control group.

ASCL1: achaete-scute homolog 1; SD: standard deviation; TC: typical carcinoid; AC: atypical carcinoid; LCNEC: large cell neuroendocrine carcinoma; SCLC: small cell lung cancer.
p values were calculated by Games–Howell test. Significant p values were shown in italics.

Comparison of the average methylation levels for each CpG unit between PNETs and the normal control group (*p < 0.05; **p < 0.01; ***p < 0.001, Games–Howell test).
Overall methylation levels of individual CpG units between normal control subjects and PNETs.
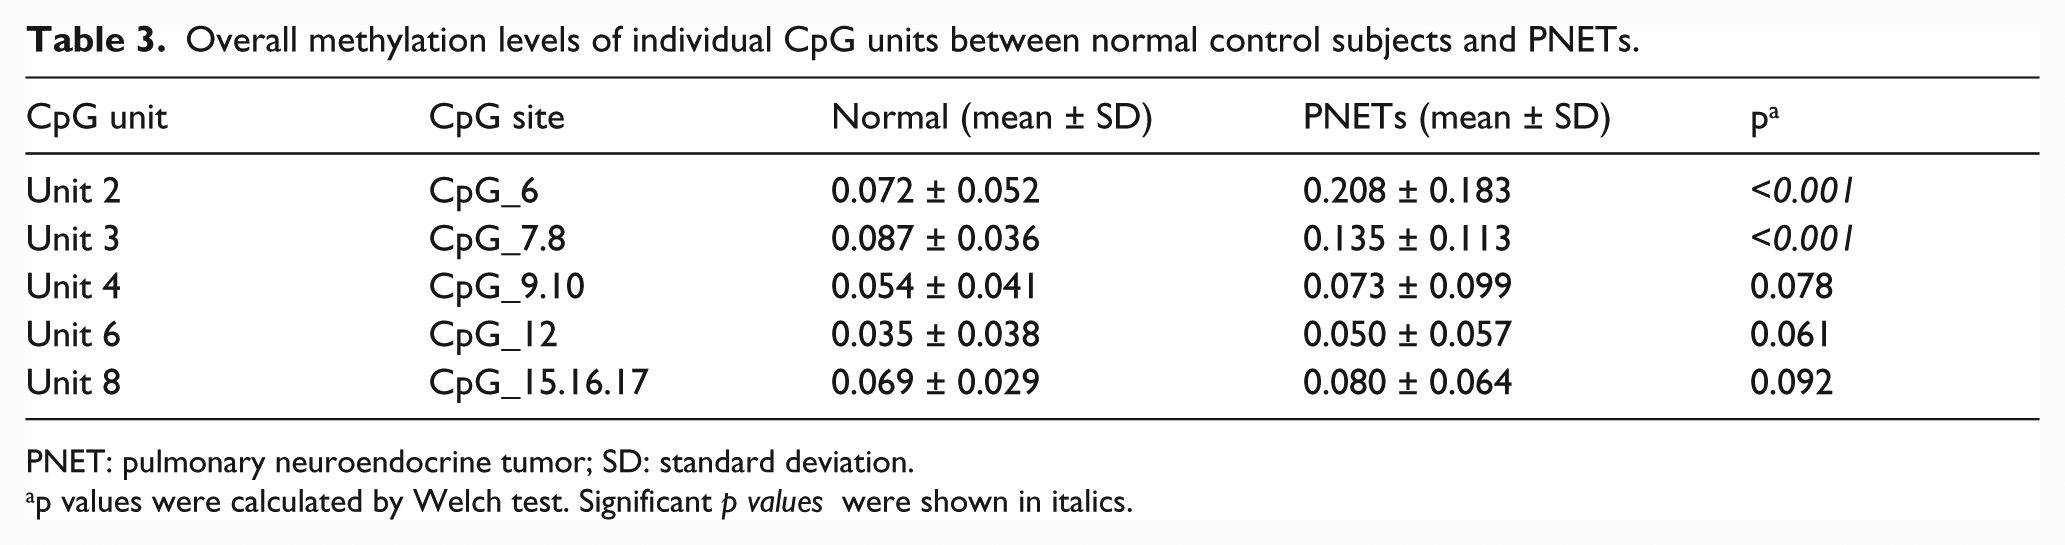
PNET: pulmonary neuroendocrine tumor; SD: standard deviation.
p values were calculated by Welch test. Significant p values were shown in italics.
The methylation level of CpG_6.7.8 is associated with clinical stage I PNET, heavy smoking, and LCNEC
We evaluated the relationship between the overall methylation values of CpG_6.7.8 and the clinicopathological features such as gender, age, tumor size, pathological tumor–node–metastasis (TNM) stage (American Joint Committee on Cancer (AJCC) 2010), smoking history (pack-year), and tumor type (Table 4). There was no significant association between the average methylation levels of CpG_6.7.8 with gender, age, and tumor size (p > 0.05). We found that patients with stage I PNET had a significantly higher overall methylation value for CpG_6.7.8 (mean ± SD = 0.19 ± 0.16) compared to the methylation value in patients with stage II/III tumors (mean ± SD = 0.14 ± 0.07; p = 0.012, Welch test; Figure 4(a)). Based on smoking history, we divided the 126 tumor cases into three groups: non-smoking, smoking (≤40 pack-years), and heavy smoking (>40 pack-years). We observed that the CpG_6.7.8 methylation value was remarkably decreased in the heavy-smoking group (mean ± SD = 0.12 ± 0.06) compared to the values in the non-smoking and smoking groups (mean ± SD = 0.19 ± 0.14 and 0.18 ± 0.16, respectively; p < 0.05, Games–Howell test; Figure 4(b)). We also demonstrated that among the four tumor types, LCNEC showed the lowest overall degree of methylation for CpG_6.7.8 (mean ± SD = 0.11 ± 0.05), which is notably different from SCLC (mean ± SD = 0.18 ± 0.12; p = 0.004, Games–Howell test; Figure 4(c)). Using ROC analysis, we established that the methylation level of CpG_6.7.8 can be used to differentiate LCNEC from SCLC with 80% sensitivity, 70% specificity, and for a cut-off value of 0.115.
Association between CpG_6.7.8 methylation and clinicopathological features of patients with PNET.

PNET: pulmonary neuroendocrine tumor; SD: standard deviation; TNM: tumor–node–metastasis; TC: typical carcinoid; AC: atypical carcinoid; LCNEC: large cell neuroendocrine carcinoma; SCLC: small cell lung cancer; AJCC: American Joint Committee on Cancer.
p values were calculated by Welch test. Significant p values were shown in italics.
TNM stage was based on the 8th edition AJCC Cancer Staging Manual released in 2010.

Correlation of overall methylation levels of CpG_6.7.8 and TNM stage, smoking history, and tumor type in patients with PNET. (a) Association between CpG_6.7.8 hypermethylation and stage I PNETs. (b) Box plots of overall methylation levels for CpG_6.7.8 in the non-smoking, smoking, and heavy-smoking groups. (c) Average methylation values for CpG_6.7.8 in LCNEC and other tumor types.
Hypermethylated CpG_6.7.8 is associated with a decrease in ASCL1 expression in PNETs
We investigated the relationship between the hypermethylation of CpG_6.7.8 in the ASCL1 CGI and ASCL1 expression in PNETs (Figure 5). To define CpG_6.7.8 hypermethylation and eliminate background noise, we considered a cut-off value of 0.18 for the dataset. Based on this criterion, 32.28% (41/127) of PNETs were hypermethylated in CpG_6.7.8 (methylation level ≥ 0.18). We found that there was an inverse correlation between hypermethylated CpG_6.7.8 and ASCL1 expression in tumor samples (r = −0.408, p = 0.007, Spearman test). Among the 41 cases with hypermethylated CpG_6.7.8, only eight cases displayed NOTCH1 expression. According to these data, we found that CpG_6.7.8 hypermethylation negatively correlates with ASCL1 expression in PNETs. The PROMO server with TRANSFAC V8.328,29 was used to predict transcription factor binding sites containing these three CpG sites (CpG 6, 7, and 8). We found at least four transcription factors (neurofibromatosis type (NF-1), E2F transcription factor 1 (E2F-1), GC factor (GCF), and enkephalin transcription factor 1 (ENKTF-1); Table 5) that can bind to this region of ASCL1.
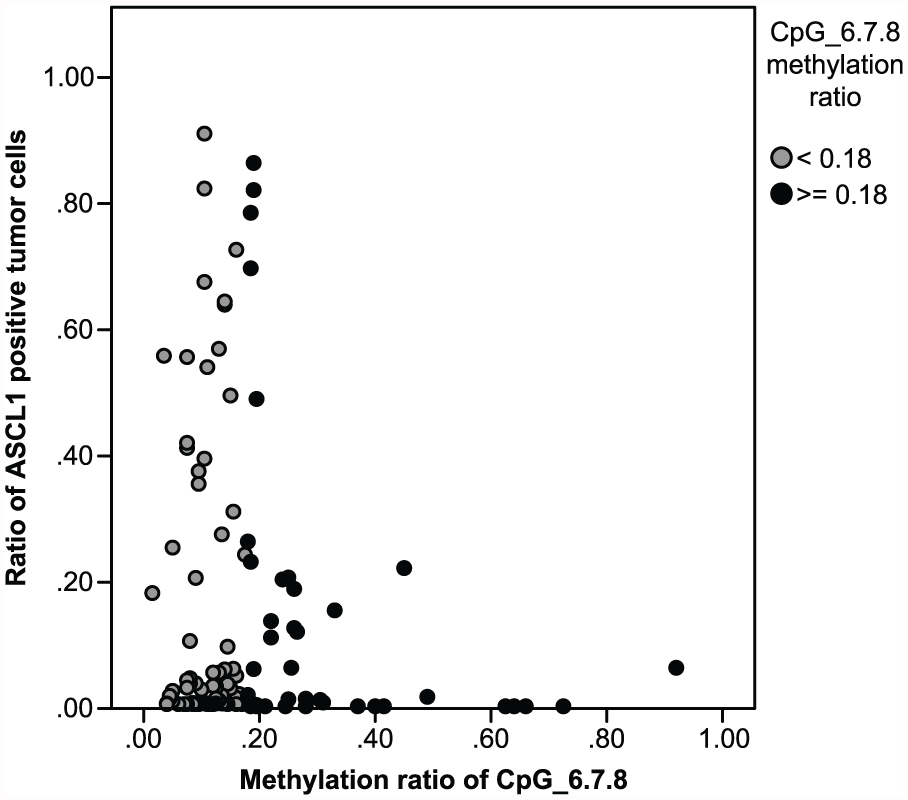
Scatter plot showing the association between the CpG_6.7.8 methylation level and ASCL1 positive tumor cells in PNETs. Gray dots represent cases with a CpG_6.7.8 methylation value less than 0.18. Black dots represent cases with a CpG_6.7.8 methylation value greater than or equal to 0.18.
Transcription factor binding sites within the target sequence of ASCL1 that contains CpG 6, 7, and 8.

ASCL1: achaete-scute homolog 1; NF-1: neurofibromatosis type 1; E2F-1: E2F transcription factor 1; ENKTF-1: enkephalin transcription factor 1; GCF: GC factor.
Discussion
We evaluated, for the first time, ASCL1 and NOTCH1 expression in samples from patients with PNET, using the mIHC platform from PerkinElmer. Our results showed that ASCL1 was highly expressed in only 30% of tumors and most of these cases were high-grade tumors (SCLC and LCNEC) (92.86%), with few cases of carcinoids (7.14%). These results are consistent with previous immunohistochemical studies10,11,30 that indicated that ASCL1 expression is helpful for distinguishing high-grade PNETs (SCLC and LCNEC) from carcinoid tumors. However, ASCL1 may not be proposed as an immunohistochemical marker to discriminate between LCNEC and SCLC or LCNEC and AC. Our study also suggested that ASCL1 expression may be negatively controlled by NOTCH1 in samples from patients with PNETs, in agreement with previous in vitro studies.18–20 However, half of these cases did not show a correlation between ASCL1 and NOTCH1 expression. Using the University of California, Santa Cruz (UCSC) database, we found that the ASCL1 CGI is located in the promoter region and extends into exon 1, which codes for the ASCL1 protein. Epigenetic alterations, especially DNA methylation that leads to changes in the ASCL1 CGI in PNETs have not been explored until now. These results prompted us to investigate the effect of DNA methylation on ASCL1 expression in PNETs.
We are the first to describe the methylation pattern in the ASCL1 CGI in PNETs compared to the one in normal controls. It was demonstrated that the target region of the ASCL1 CGI was frequently hypermethylated in PNET cases compared to the normal control group. Among the nine CpG sites we have checked, only three CpG sites (6, 7, and 8) which are located next to the translation start site of ASCL1 significantly showed a higher methylation level in tumors compared to the level in normal controls. This suggests that CpG_6.7.8 methylation may play a role in the clinical evolution of PNETs. Previous reports also support our suggestion that DNA methylation alterations in individual CpG sites may play a vital role in cancer progression.31,32
We have gained further insights into the clinicopathological characteristics of CpG_6.7.8 methylation in 126 patients with PNET. We observed that CpG_6.7.8 methylation was related to the clinical stage, smoking history, and tumor type. We compared the overall methylation level of CpG_6.7.8 in patients with stage I to stage II/III PNET, and we found that the hypermethylation of the corresponding CpG sites remarkably correlates with stage I PNET. It is highly probable that patients with PNET with hypermethylated CpG_6.7.8 have a better prognosis. Kosari et al. 33 considered ASCL1 as a marker for smokers in lung adenocarcinoma, because ASCL1 messenger RNA (mRNA) expression was found almost exclusively in smokers with lung adenocarcinoma, in contrast to non-smokers. Our results also showed that the overall methylation degree of CpG_6.7.8 was lower in patients with PNET with a heavy-smoking history compared to the levels in the non-smoking and smoking groups. This indicates that heavy smoking may be linked to the decreased methylation level in these three CpG sites. Our findings are supported by previous reports that smoking is associated with hypomethylation of one or more CpG site(s) or with specific genes in lung cancer. 34 Finally, we believe that the methylation levels of CpG_6.7.8 can be used as a diagnostic marker for distinguishing LCNEC from SCLC (sensitivity = 80%, specificity = 70%, cut-off value = 0.115) in some difficult cases.
ASCL1 DNA methylation has not been well studied as a regulatory mechanism for ASCL1 expression in PNETs. Thus, we evaluated the correlation between the aberrant methylation of CpG_6.7.8 near the ASCL1 translation start site and the ASCL1 immunohistochemistry data. Our results indicated that 32.28% of PNET cases with hypermethylated CpG_6.7.8 (methylation ratio ≥ 0.18) in the ASCL1 CGI have an inverse correlation with ASCL1 expression (r = −0.408, p = 0.007, Spearman test). To our knowledge, this is first demonstration of an inverse correlation between ASCL1 expression and the methylation of certain CpG sites in ASCL1 in PNET. Recently, DNA methylation was suggested to be able to suppress gene expression by preventing the binding of transcription factors to methylated CpG dinucleotides within transcription factor binding sites.35,36 To investigate the mechanism underlying the association between the hypermethylation of CpG_6.7.8 and ASCL1 expression, we used the PROMO server with TRANSFAC V8.328,29 to find the consensus motifs of at least four transcription factors (NF-1, E2F-1, GCF, and ENKTF-1), the binding sites of which may be contained in CpG 6, 7, and 8 (Table 5). NOTCH1, a tumor suppressor, is the main regulatory factor of ASCL1 that suppresses ASCL1 expression during neuronal development in the neuroendocrine cells and in tumors. Even though ASCL1 CGI displays an unmethylated pattern in the normal lung tissue, ASCL1 is not expressed under NOTCH1 control. In PNETs, for unknown reasons, there is no NOTCH1 and ASCL1 is easily expressed. However, in some cases, when a specific area of the ASCL1 CGI is hypermethylated, this may negatively affect ASCL1 expression by preventing the binding of certain transcription factors. Our data suggest that without NOTCH1, the hypermethylation in this specific area of the ASCL1 CGI that correlates with the early stage of PNETs may prevent one or more transcription factor(s) from binding to this region of the ASCL1 CGI, which results in the repression of ASCL1 transcription. As a limitation, we could not examine the mRNA levels of ASCL1 in patient samples due to the low quality of RNA extracted from FFPE blocks.
In summary, we propose that ASCL1 expression is not controlled by NOTCH1 in 50% of PNET cases. For the first time, we have demonstrated that CpG_6.7.8 is the target region of the ASCL1 CGI. CpG_6.7.8 is frequently hypermethylated in PNETs compared to normal tissues, and the hypermethylation of these CpG sites is associated with clinical stage I PNETs. CpG_6.7.8 methylation is also notably decreased in patients with LCNEC or PNET with a heavy-smoking history. We conclude that CpG_6.7.8 hypermethylation can negatively affect ASCL1 expression in PNETs by preventing certain transcription factors from binding to this region of ASCL1. Our study supports in vitro studies that define the DNA methylation site CpG_6.7.8 as containing one or more transcription factor binding sites that may regulate ASCL1 expression in PNETs.
Footnotes
Declaration of conflicting interests
The author(s) declared no potential conflicts of interest with respect to the research, authorship, and/or publication of this article.
Funding
The author(s) disclosed receipt of the following financial support for the research, authorship, and/or publication of this article: The authors gratefully acknowledge the financial support from the Leading Foreign Research Institute Recruitment Program (2011-0030105).
Ethical statement
All procedures involving human participants were in accordance with the ethical standards of the institutional research committee and the 1964 Helsinki declaration and its later amendments or comparable ethical standards.