
Abstract
This study explored the mechanism underlying long non-coding RNA ROR regulating autophagy on Tamoxifen resistance in breast cancer. Cancer tissues and adjacent normal tissues were collected from 74 breast cancer patients. Human breast cancer BT474 cells were assigned into blank, phosphate buffered saline, Tamoxifen, negative control + Tamoxifen, siROR + Tamoxifen, 3-methyladenine + Tamoxifen, and siROR + 3-methyladenine + TA groups. The expression of long non-coding RNA ROR and expressions of multi-drug resistance-associated P-glycoprotein and glutathione S-transferase-π messenger RNA were detected using quantitative real-time polymerase chain reaction. The expressions of light chain 3, Beclin 1, multi-drug resistance-associated P-glycoprotein, and glutathione S-transferase-π protein were determined using western blotting. Cell proliferation, invasion, and migration abilities were measured using 3-(4,5-dimethylthiazol-2-yl)-2,5-diphenyltetrazolium bromide assay, Transwell assay, and scratch test, respectively. The long non-coding RNA ROR expression was higher in the breast cancer tissues than that in the adjacent normal tissues. Compared with the blank group, light chain 3 and Beclin 1 expressions were increased in the siROR + Tamoxifen group but decreased in the 3-methyladenine + Tamoxifen group; these data indicated that downregulated long non-coding RNA ROR promoted autophagy. In comparison with the blank group, multi-drug resistance-associated P-glycoprotein and glutathione S-transferase-π messenger RNA and protein expressions were reduced in the siROR + Tamoxifen group but elevated in the 3-methyladenine + Tamoxifen group, suggesting that downregulated long non-coding RNA ROR suppressed the drug resistance to Tamoxifen and the inhibition of autophagy reversed the effect of long non-coding RNA ROR on drug resistance. Compared with the Tamoxifen, negative control, and siROR + 3-methyladenine + Tamoxifen groups, the cell proliferation, invasion, and migration in the siROR + Tamoxifen group were much decreased; these results implied that downregulated long non-coding RNA ROR suppressed BT474 cell proliferation, invasion, and migration and reversed the effect of Tamoxifen on the BT474 cells. These results indicate that inhibition of long non-coding RNA ROR reverses resistance to Tamoxifen by inducing autophagy in breast cancer.
Introduction
Breast cancer (BC) is one of the most prevalent malignancies and a dominant cause of cancer-associated death in women worldwide. 1 In China, approximately 272,700 individuals were newly diagnosed with BC and 61,500 died of this disease in 2012. 2 This malignancy represents a heterogeneous group of tumors with characteristic molecular features, prognosis, as well as responses to current therapy. 3 Estrogens have been implicated in the pathogenesis of BC through the estrogen receptor alpha (ERα), and approximately 70% of BC patients are ER-positive. 4 Tamoxifen (TMX) is one of the most common and effective therapies for patients with ER-positive BC, and it alone or combined with chemotherapy can reduce disease progression and has more favorable impact on survival of patients. 5 Unfortunately, almost 50% of patients with advanced BC experiences TMX resistance which is the most critical problem limiting the efficacy of the endocrine therapy.6,7 This differential response may result from the expression of specific molecules involved in a variety of signaling pathways. 5 Interestingly, recent decades have witnessed the improvement achieved from research between long non-coding RNAs (lncRNAs) and TMX resistance in BC, which highlights the new role of lncRNAs in endocrine therapy in BC.8,9
LncRNAs, longer than 200 nucleotides, can regulate gene interaction and control various biological processes, including cell proliferation, differentiation, apoptosis, and migration. 10 Among 3000 human lncRNAs, less than 1% are functionally characterized. 11 The lncRNA ROR (ROR, regulator of reprogramming) can sever significant player in reprogramming lineage-committed cells into pluripotent stem cells (iPSCs). 12 Recently it has been widely reported that the lncRNA ROR is upregulated and promotes proliferation, migration, and chemoresistance of hepatocellular carcinoma (HCC), nasopharyngeal carcinoma (NPC), BC, and glioma.13–17 A functional study reported by Zhang et al. 18 demonstrates that down-regulation of lncRNA-ROR can inhibit the epithelial-to-mesenchymal transition of BC cells and strengthen the drug-sensitivity of BC cells to TMX by modulating microRNA-205. Multi-drug resistance-associated P-glycoprotein (MDR1) is a well-established plasma membrane drug efflux pump that is related to resistance to a wide range of anticancer drugs. 19 Also, glutathione S-transferase-π (GST-π) is a marker protein and its high expression is associated with drug resistance in many cancers, even when the drug used is not a substrate. 20 Additionally, it has been reported that the sensitivity to TMX can be enhanced through autophagic cell death in BC. 21 And the dysregulation of autophagy is proposed to participate in malignant transformation.22,23 Two important autophagic genes—Beclin-1 and light chain 3 (LC3)—are commonly detected in cancer tissues to study cancer–autophagy association. 24 Thought-provoking, Chen et al. 25 support that large intergenic non-coding RNA-ROR reverses gemcitabine-induced autophagy and apoptosis in BC cells, which may point to an important role for lncRNA-ROR-autophagy association in the sensitivity to TMX. Here, we performed an in vitro and in vivo study to explore the role of lncRNA ROR in resistance to TMX in BC.
Materials and methods
Ethics statement
This study was conducted based on the protocols proposed by the commitment of the First Affiliated Hospital, University of South China. All patients signed written informed consents prior to the study. Animal experiments were conducted in strict accordance with the approved animal protocols and guidelines established by Medicine Ethics Review Committee for animal experiments of the First Affiliated Hospital, University of South China. All efforts were made to minimize the suffering of animals.
Subjects
From April 2015 to April 2016, 74 cases of BC patients admitted into the First Affiliated Hospital, University of South China, were included in this study, with an age range of 28–64 years. The BC tissues and its adjacent normal tissues were obtained from each eligible patient. The inclusion criteria were listed as followed: (1) primary BC patients; (2) no history of radiotherapy, chemical therapy, endocrinotherapy, as well as biological therapy before inclusion; and (3) no history of malignant tumor in other system. Patients were excluded from this study if they were (1) pregnant or lactating women and (2) complicated with other gland diseases.
Experiment animals
A total of 70 nude mice, 4 weeks old, were purchased from Beijing Vital River Laboratory Animal Technology Co., Ltd., with weight ranged from 18 to 20 g. All mice were fed based on the standards proposed by experimental animal commitment. All mice were fed in an animal room with temperature of 22°C–25°C, 40%–55% humidity, normal day and night rhythm, and free access to food and water. Mice were kept in separated cages with access to pellet diet and their paddings were changed every 2 weeks. Before mice were used for experiments, they were not given food but given free access to drink water.
Cell selection and culture
BC cell lines (MCF7, BT474, MDA-MB-435, and MDA-MB-231) and MCF10A cell line were purchased from American Type Culture Collection (ATCC). MCF10A cells were cultivated in Dulbecco’s Modified Eagle’s Medium/Nutrient Mixture F12 (DMEM/F12) culture medium and added with 5% horse serum, 20 ng/mL epidermal growth factor (EGF), 0.5 mg/mL of hydrocortisone, 100 ng/mL of cholera toxin, 10 mg/mL of insulin, and antibiotic at 37°C with 5% CO2. MDA-MB-231 cells were incubated in L-15 medium containing 10% fetal bovine serum (FBS) in an incubator at 37°C with 5% CO2, while the BT474 cells and MDA-MB-435 cells were routinely cultured in RPMI 1640 culture medium containing 10% fetal calf serum in an incubator at 37°C with no CO2. Expressions of lncRNA-ROR were detected in MCF7, BT474, MDA-MB-435, MDA-MB-231, and MCF10A cells. The BT474 cells were most significantly different from the MCF10A cells in the expressions of lncRNA-ROR and selected for cell transfection in vitro.
Cell grouping and transfection
The BT474 cells in the logarithmic phase were grouped into (1) blank group (no treatment); (2) phosphate buffered saline (PBS) group (10 µM of PBS was added in culture medium); (3) TMX group (10 µM of TMX (Sigma-Aldrich Chemical Company, St. Louis, MO, USA) was added in culture medium); (4) negative control group (NC group, empty plasma, 10 µM of TMX was added in culture medium); (5) siROR + TMX group (transfected with siROR, 10 µM of TMX was added in culture medium); (6) 3-3-methyladenine + TMX group (3-MA; Sigma-Aldrich Chemical Company) 10 µM of TMX was added in culture medium); (7) siROR + 3-MA + TMX group (transfected with siROR. Cells were added with 3-MA after incubation for 2 h and 10 µM of TMX was added in culture medium). Specific siRNA was transfected using lipofectamine 2000 (Invitrogen, Carlsbad, CA, USA) protocol. The BT474 cells were subject to TMX and 3-MA treatment for 48 h for further experiment.
Quantitative real-time polymerase chain reaction
BC cells and MCF10A cells in each group were collected and isolated for total RNA extraction using a TRIzol RNA isolation kit. Then, RNA was identified by ultraviolet analysis and formaldehyde-denatured RNAs are electrophoresed. The l µg of RNA with high purity and density was reversely transcripted into the complementary DNA (cDNA). Polymerase chain reaction (PCR) primers were designed and synthesized by Invitrogen (Table 1). PCR was conducted using glyceraldehyde 3-phosphate dehydrogenase (GAPDH) as the internal control. The following are PCR reaction conditions: pre-denaturation at 94°C for 10 min, followed by 40 cycles of denaturation at 94°C for 40 s and annealing at 60°C for 40 s and extension at 72°C for 1 min, followed by extension at 72°C for 10 min. The lowest point in the amplification curve was manually chosen to calculate the threshold value (Ct value). PCR was analyzed using 2−ΔΔCt method using the following formula: ΔΔCt = (Ct (target gene) − Ct (control gene))experimental group − (Ct (target gene) − Ct (control gene)control group. Each experiment was conducted for three times to obtain the average value.
Primer sequences of MDR1, GST-π, and GAPDH used for qRT-PCR.

qRT-PCR: quantitative real-time polymerase chain reaction; F: forward; R: reverse; MDR1: multi-drug resistance-associated P-glycoprotein; GST-π: glutathione S-transferase-π; GAPDH: glyceraldehyde 3-phosphate dehydrogenase.
Western blotting
Cell proteins among groups were extracted and the concentration was measured according to bicinchoninic acid (BCA) detection kit’s instructions (Wuhan Boster Biological Technology Ltd., Wuhan, Hubei, China). The obtained protein was then added with loading buffer for boiling at 95°C for 10 min. Then, each well in the well plate was filled with 30 µg of sample buffer. After that, the samples were electrophoresed in 10% sodium dodecyl sulfate–polyacrylamide gel electrophoresis (SDS-PAGE) (Wuhan Boster Biological Technology Ltd.) and the voltage was transferred from 80 to 120 V in wet membranes. The membrane transferring was conducted with a voltage of 100 mV for 45–70 min and transferred onto polyvinylidene difluoride (PVDF) membranes. Then, cells were blocked for 1 h at room temperature in 5% bovine serum albumin (BSA). Primary rabbit anti-rat antibodies for LC3, Beclin 1, MDR1, and GST-π (diluted at a ratio of 1:1000, purchased from Cell Signaling Technology (CST), Beverly, MA, USA) and primary anti-rat antibody for β-actin (diluted at a ratio of 1:3000, purchased from Becton and Dickinson Company, Franklin Lakes, NJ, USA) were added for incubation at 4°C for overnight. Then, Tris-buffered saline with Tween 20 (TBST) was used for washing for three times, each for 5 min. Secondary goat anti-rabbit antibodies (Miao Tong (Shanghai) Biological Technology Co., Ltd., Shanghai, China) were added for incubation at room temperature for 1 h. Then, the membrane was washed for three times. β-actin was considered as internal reference. After that, the gray value of the protein expression was analyzed by ImageJ software. Each experiment was conducted for three times to obtain the average value.
3-(4,5-Dimethylthiazol-2-yl)-2,5-diphenyltetrazolium bromide assay
Cell suspension was diluted and inoculated into a 96-well plate with a density of 3 × 10³ per well. Six parallel wells were set for each group. After cell confluence reached 80%, cells were grouped based on the above arrangements. After re-oxygenation, cells were added with 20 µL of PBS-diluted 3-(4,5-Dimethylthiazol-2-yl)-2,5-diphenyltetrazolium bromide (MTT; 5 mg/mL, 0.5% MTT; Sigma-Aldrich Chemical Company) in a 37°C incubator for 4 h. Then, the MTT was aspirated, and each well was added with 150 µL of dimethyl sulfoxide (Sigma-Aldrich Chemical Company) in a shaking bed for 10 min. A microplate reader was used to measure the optical density (OD) with the wavelength of 570 nm. Each experiment was conducted for three times to obtain the average OD value. Cell survival rate = (OD value in experimental group − OD value in control group)/OD value in control group. Each experiment was conducted for three times to obtain the average value.
Transwell assay
After transfection for 48 h, the BT474 cells in each group were digested. Then, each chamber was added with 80 µL of Matrigel at a ratio of 1:8 and was inoculated with 1 × 10⁵ cells. Then, 100 µL of serum-free DMEM medium was added, while the lower chamber was added with culture medium. After incubation for 24 h, cotton swab was used to wipe out the remained cells. Plates were then fixed with 4% paraformaldehyde for 15 min. Crystal violet was used for staining for 10 min. Five high-power fields were randomly chosen to calculate the cell numbers under a microscope. Gel pavement was not necessary for cell migration test in the Transwell assay, and the incubation time was 16 h. Each experiment was conducted for three times to obtain the average value.
Scratch test
A marker pen was used to scratch an even line, with an interval width of 0.8 cm in the back of the six-well plate. Each well was required to be crossed by more than five lines. Cells were inoculated in a six-well plate with the density of 5 × 10⁵. Once the cell adherence reached 100%, 1 µL of pipettes’ spearhead was used to scratch a vertical line in the cell plate on the second day, and then, cells were washed by PBS. PBS was slowly injected into the well plate to remove the remaining cells. The well plate was added with culture medium and incubated in a 5% CO2 incubator at 37°C. About 48 h later, the well plate was observed and photographed. Each experiment was conducted for three times to obtain the average value.
Tumor formation in nude mice
A total of 70 nude mice were grouped into (1) blank group (injected with cells in blank group), (2) PBS (injected with cells in the PBS group), (3) TMX group (injected with cells in the TMX group), (4) NC group (injected with cells in the NC group), (5) siROR + TMX group (injected with cells in the siROR + TMX group), (6) 3-MA + TMX group (injected with cells in the 3-MA + TMX group), and (7) siROR + 3-MA + TMX group (injected with cells in the siROR + 3-MA + TMX group). The BT474 cells in the logarithmic phase in blank, PBS, TMX, NC, siROR + TMX, 3-MA + TMX, and siROR + 3-MA + TMX groups were made into cell suspension in 1 mL PBS and separately injected into mice in the seven groups. The right axillary fossa of each mouse was subcutaneously injected with 0.2 mL of cell suspension that contained 1 × 10⁷ cells using microsyringes. And tumor growth was recorded and tumor size was measured. The dying mice were decapitated (8 weeks) and the tumors were weighted. The lung from each mouse was obtained and stained with hematoxylin and eosin (HE) to observe the tumor metastasis. HE staining was conducted for three times to obtain the average value.
Statistical analysis
SPSS version 21.0 software (SPSS Inc., Chicago, IL, USA) was used for statistical analysis. Measurement data were expressed as mean ± standard deviation (SD). Least significant difference (LSD) method was used for comparison between two groups. One-way analysis of variance (ANOVA) test was performed for comparisons among groups. Measurement data which comply with normal distribution were performed using Student’s t-test. The p values <0.05 were considered as significant difference.
Results
Expressions of lncRNA ROR in the BC tissues and adjacent normal tissues
The quantitative real-time polymerase chain reaction (qRT-PCR) indicated that the expression of lncRNA ROR in the BC tissues (4.96 ± 0.35) was higher than that in the adjacent normal tissues (1.02 ± 0.21; p < 0.01; Figure 1).

Comparison of the expression of lncRNA ROR between the BC tissues and adjacent normal tissues (**p < 0.01).
Expressions of lncRNA ROR in BC cells (MCF7, BT474, MDA-MB-435, and MDA-MB-231) and MCF10A cells
The comparison on expression of lncRNA ROR in BC cells (MCF7, BT474, MDA-MB-435, and MDA-MB-231) and MCF10A cells showed that human BC cells had increased expression of lncRNA ROR in comparison with human mammary epithelial cells (all p < 0.05). Among the four human BC cells (MCF7, BT474, MDA-MB-435. and MDA-MB-231), the BT474 cells had the highest expression of lncRNA ROR, thus BT474 cells were selected for further experiments (Figure 2).

Comparisons of the expressions of lncRNA ROR among BC cells (MCF7, BT474, MDA-MB-435, and MDA-MB-231) and human MCF10A breast epithelial cells (*compared with the MCF10A cells, p < 0.05).
Expressions of lncRNA ROR in the BT474 cells among groups
The comparisons on expressions of lncRNA ROR among blank group, PBS group, TMX group, NC group, and 3-MA + TMX group were not statistically significant (all p > 0.05). While compared with the blank group, the expressions of lncRNA ROR in the siROR + TMX group and siROR + 3-MA + TMX group were both decreased (both p < 0.05). No significant difference was detected by pairwise comparisons among PBS group, TMX group, NC group, and 3-MA + TMX group (all p > 0.05; Figure 3).

Comparisons of the expressions of lncRNA ROR in the BT474 cells among groups (*compared with the blank group, p < 0.05).
Expressions of autophagy-related proteins (LC3 and Beclin 1) in the BT474 cells among groups
The comparisons on expressions of LC3 and Beclin 1 among blank group, PBS group, TMX group, NC group, and 3-MA + TMX group were not statistically significant (all p > 0.05). Meanwhile, in comparisons to that in the blank group, the expressions of LC3 and Beclin 1 in the siROR + TMX group were elevated, while the expressions of LC3 and Beclin 1 in the siROR + 3-MA + TMX group were decreased (all p < 0.05; Figure 4). Those results indicated that the inhibition on expression of lncRNA ROR can increase the expressions of LC3 and Beclin 1.

Comparisons of the expressions of autophagy-related proteins (LC3 and Beclin 1) in the BT474 cells among groups. (a) Protein bands of LC3 and Beclin 1 among groups. (b) Relative expressions of LC3 and Beclin 1 proteins among groups (*compared with the blank group, p < 0.05).
Messenger RNA and protein expressions of drug-resistance-related genes (MDR1 and GST-π) in the BT474 cells among groups
The messenger RNA (mRNA) and protein expressions of drug resistance genes (MDR1 and GST-π) between blank group and PBS group were not statistically significant (all p > 0.05). After cells were treated with TMX, the mRNA and protein expressions of MDR1 and GST-π were elevated (both p < 0.05), which implied that cells generated drug resistance to TMX. The inhibition on lncRNA ROR in cells generated drug resistance to TMX showed that the mRNA and protein expressions of MDR1 and GST-π were much decreased (all p < 0.05), indicating that the inhibition on lncRNA ROR can suppress the expressions of drug resistance genes and decrease the drug resistance to TMX. After the cells that generated drug resistance to TMX were treated by 3-MA, we found that the mRNA and protein expressions of MDR1 and GST-π were elevated, indicating that the inhibition of autophagy signal pathway can reverse the effect of lncRNA ROR on drug resistance (Figure 5).
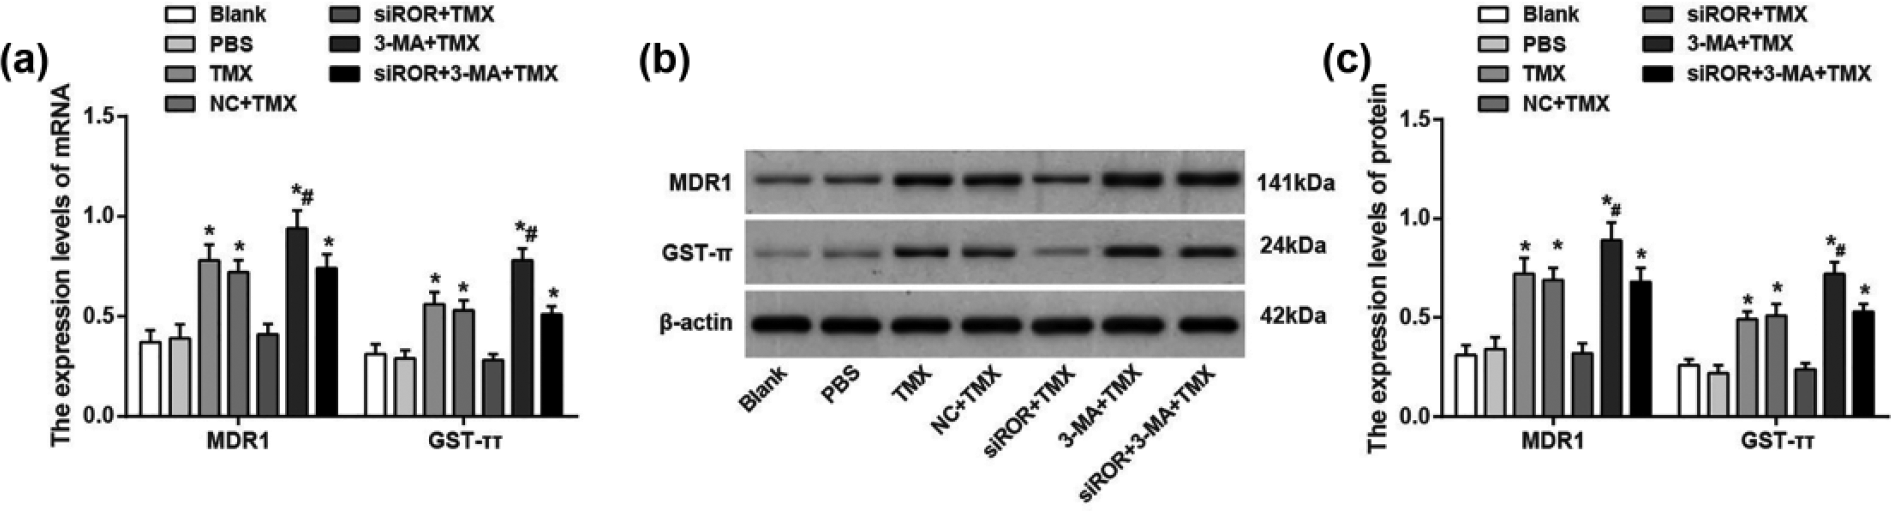
Comparisons of the mRNA and protein expressions of drug-resistance-related genes (MDR1 and GST-π) in the BT474 cells among groups. (a) mRNA expressions of MDR1 and GST-π among groups. (b) Protein bands of MDR1 and GST-π among groups. (c) Protein expressions of MDR1 and GST-π among groups (*compared with the blank group, p < 0.05; #compared with the TMX group, p < 0.05).
Inhibition of lncRNA ROR suppressed cell proliferation in the BT474 cells among groups
MTT assay was applied to detect cell proliferation in BT474 cells, and the results showed no significant difference among blank group, PBS group, and 3-MA + TMX group (all p > 0.05). Compared with blank group, cell viabilities in the TMX group, NC group, and siROR + 3-MA + TMX group were decreased (all p < 0.05), while the cell viabilities in the siROR + TMX group were much decreased when compared to those in the TMX group, NC group, and 3-MA + TMX group (all p < 0.05; Figure 6). Those results suggested that the downregulated lncRNA ROR reversed the effect of TMX on cell proliferation, thus reduce the drug resistance of BC cells to TMX.

Comparison of cell proliferation of BT474 cells among groups (*compared with the blank group, p < 0.05; #compared with the TMX group, p < 0.05).
Inhibition of lncRNA ROR suppressed cell invasion in the BT474 cells among groups
Transwell assay was used to detect cell invasion in BT474 cells, and the results showed no significant difference among blank group, PBS group, and 3-MA + TMX group (all p > 0.05). Compared with blank group, cell invasion in the TMX group, NC group, and siROR + 3-MA + TMX group was reduced (all p < 0.05), while the cell invasion in the siROR + TMX group was much decreased when compared to those in the TMX group, NC group, and 3-MA + TMX group (all p < 0.05; Figure 7). Those results suggested that the downregulated lncRNA ROR reversed the effect of TMX on cell invasion.

Comparison of cell invasion of BT474 cells among groups (200×; *compared with the blank group, p < 0.05; #compared with the TMX group, p < 0.05).
Inhibition of lncRNA ROR suppressed cell migration in the BT474 cells among groups
The cell migration between blank group, PBS group, and 3-MA + TMX group was not statistically significant (all p > 0.05). Compared with blank group, the cell migration ability in the TMX group, NC group, and siROR + 3-MA + TMX group were reduced (all p < 0.05), while the cell migration ability in the siROR + TMX group was much decreased when compared to those in the TMX group, NC group, and 3-MA + TMX group (all p < 0.05; Figure 8). Our results indicated that the downregulated lncRNA ROR reversed the effect of TMX on cell migration.

Comparison of cell migration of BT474 cells among groups (200×; *compared with the blank group, p < 0.05; #compared with the TMX group, p < 0.05).
Tumor formation in nude mice after transfection of BT474 cells among groups
Mice tumor formation found no significant difference on tumor size between blank group and 3-MA + TMX group (all p > 0.05), which implied that inhibition on the autophagy pathway can block the effect of TMX on BC tumor formation. Compared with blank group, the tumor in the TMX group, NC group, and siROR + 3-MA + TMX group was smaller in size, lighter in weight, and slower in tumor growth (all p < 0.05), indicating that TMX can inhibit the tumor cell growth in vivo. Compared with the TMX group, the siROR + TMX group had smaller, lighter, and slowly grown tumor (all p < 0.05; Figure 9).

Comparison of tumor size in nude mice after transfection of BT474 cells among groups.
Tumor metastasis in nude mice after transfection of BT474 cells among groups
The cell metastasis and tumor metastatic tumor size among blank group, PBS group, and 3-MA + TMX group were not significant (all p > 0.05). The metastasis nodes in lungs of mice in the TMX group, NC group, and siROR + 3-MA + TMX group were significantly reduced when compared with blank group (all p < 0.05). When compared with the TMX group, NC group, and siROR + 3-MA + TMX group, the tumor metastasis to lungs of mice in the siROR + TMX group was less worse (all p < 0.05; Figure 10).

Comparison of metastasis in lungs of nude mice after transfection of BT474 cells among groups (*compared with the blank group, p < 0.05; #compared with the TMX group, p < 0.05).
Discussion
ERα-positive BC originally responds to antiestrogens but ultimately becomes estrogen independent and recurrent. ER-positive BC cells in resistance to long-term estrogen deprivation (LTED) show hormone-independent ER transcriptional activity as well as growth. 26 The antiestrogen TMX is considered as a major endocrine therapy for ER-positive BC, acquired resistance to which is a serious therapeutic problem in BC patients. 27 This study, with experiments of specimen collection from BC patients, cell transfection, and establishing transplantation tumor model of nude mice, is supposed to investigate the mechanism underlying lncRNA ROR involvement in TMX resistance in BC patients.
Our study initially demonstrated that lncRNA ROR expression was higher in the BC tissues than in the adjacent normal tissues. And in vitro data revealed that BT474 cells with transfection of small interference mediated lncRNA ROR silencing plus treatment of TMX exhibited more significant increases in cell proliferation, invasion, and migration. These two results concluded that downregulation of lncRNA ROR might suppress the development and progression of BC. LncRNA ROR is a strong negative regulator of p53 in response to DNA damage. 28 MicroRNA-145 is a direct transcription target of p53, 29 and Huang et al. 30 thought that microRNA-145 could act as a tumor suppressor in human cancers, such as colon cancer and pancreatic cancer by the inhibition of lncRNA ROR. 31 Additionally, Wang et al. 32 also reported that lncRNA ROR may act as a molecular sponge for microRNA-145 to increase targets of microRNA-145, such as OCT4, SOX2, and Nanog expression. The fact that various embryonic stem cell (ESC) promoters or suppressors commonly play a similar role in cancer stem cells (CSCs), for instance, microRNA-205, let-7, SOX2, and OCT4 may highlight the hypothesis that lncRNA ROR has been implicated in cancer development and progression potentially.33–36 Consistent with our study, Hou et al. 15 revealed that lncRNA ROR triggers epithelial-to-mesenchymal transition and promotes the tumorigenesis as well as metastasis of BC. At the same time, one of the findings indicated that MDR1 and GST-π mRNA and protein expressions were reduced in the BT474 cells in the siROR + TMX group, suggesting that downregulated lncRNA ROR decreased the resistance of BT474 cells to TMX. To the best of our knowledge, elevated expression of the GST-π gene encoding the anionic isozyme of GST and the MDR1 gene encoding the 175 kDa P-glycoprotein has been determined in continuous human BC cell lines in vitro for resistance to doxorubicin. 37 Previously, specific knockdown of lncRNA ROR plus radiotherapy treatment in xenograft model led to a remarkable decrease in the tumor growth, and the potential mechanism might refer to the fact that lncRNA ROR decreased sensitivity of colorectal cancer cells to radiotherapy by negatively modulating p53/microRNA-145. 38 Also, Fernandez-Cuesta et al. 39 found that loss of p53 function may enhance cross-talks between estrogen receptor and epidermal growth factor receptor (EGFR)/human epidermal growth factor receptor 2 (HER2) pathways, resulting in more resistance to cytotoxic effects of TMX. In line with a previous report, the results from xenograft model of BC confirmed the fact again that combined small interference-mediated lncRNA ROR with TMX treatment could significantly inhibit cell proliferation and distant metastasis of BT474 cells in vivo.
However, in order to bring new insights into possible mechanisms underlying lncRNA ROR enhancing TMX resistance in BC, an inhibitor of autophagy 3-MA was used to treat BT474 cells in vitro. The finding that the siROR + TMX group had lower cell proliferation, invasion, and migration and higher MDR1 and GST-π mRNA and protein expressions than the siROR + 3-MA + TMX group, which indicated that autophagy had anti-effect on tumorigenesis and metastasis of BC and could reverse TMX resistance of BT474 cells. Autophagy is increased via several tumor suppressor genes and its damage is connected to high risk of tumorigenesis.23,40 In normal cells, the promotion of autophagy degrades impaired proteins, lipids, and organelles, which can inhibit toxicity accumulation of cellular garbage at a p62-dependent manner, consequently protecting the cell against alternations in cell signaling, oxidative stress, as well as DNA damage and preventing tumorigenesis. 41 When autophagy is absent, inflammation caused by increased necrosis can eventually trigger tumorigenesis.42,43 Cho et al. 44 found that excessive activation of autophagy flux may enhance the well-established retinal cytotoxicity of TMX. Also, Cheng et al. 45 supported that YM155, a small molecule survivin gene suppressant, is efficient in targeting a variety of TMX-resistant BCs by inducing autophagy-dependent cell death. Subsequently, our study found that the siROR + TMX group was increased in LC3 and Beclin 1 expressions, which revealed the fact that small interference-mediated lncRNA ROR might facilitate autophagy to sensitize BT474 cells to TMX. Chang et al. 46 considered that reduction of autophagy protein LC3 revealed a prognosis in triple-negative BC, which provided a reasonable inference that inducement of autophagy is potentially an effective therapeutic strategy in triple-negative breast cancer (TNBC). As a haploinsufficient tumor-suppressor, Beclin 1 can be either monoallelically deleted or exhibit decreased expression in BC, suggesting that autophagy is involved in the tumorigenicity of BC. 47 Nonetheless, the mechanism underlying lncRNA ROR modulating autophagy remains unknown. Whether lncRNA ROR functions on autophagy by targeting autophagy-related proteins or autophagy-related signaling pathway is required to be verified and further studied.
Taken together, our study provides evidence that inhibition on lncRNA ROR reverses resistance to TMX by inducing autophagy in BC. These findings may point to a significant role for lncRNA ROR–autophagy association in the sensitivity to TMX. We expect that this in vivo and in vitro study will bring insight into the molecular mechanisms linked with the function of lncRNA ROR in tumorigenicity and estrogen resistance and also may facilitate efforts to identify novel targets to protect BC patients against TMX resistance.
Footnotes
Acknowledgements
We would like to give our sincere gratitude to the reviewers for their comments. Y.L. and B.J. are co-first authors.
Declaration of conflicting interests
The author(s) declared no potential conflicts of interest with respect to the research, authorship, and/or publication of this article.
Funding
The author(s) disclosed receipt of the following financial support for the research, authorship, and/or publication of this article: This study was supported by projects from the Hunan Provincial Natural Science Foundation of China (project number: 2015JJ2119).