
Abstract
To investigate differentially expressed genes regulated by microRNA-451a in colorectal cancer. We detected expression of microRNA-451a in colorectal cancer samples and normal pericarcinous tissues from 68 colorectal cancer patients and the correlation between microRNA-451a and clinical features of these patients. Then, the expression of microRNA-451a in HCT116, SW620, HT29, SW480, and DLD cells was also measured. The suppression subtractive hybridization method was used with two HCT116 cell lines with overexpressing or underexpressing microRNA-451a, respectively. The most highly increased genes were screened. Their functions were predicted by gene ontology analysis. The expression ratio of microRNA-451a in colorectal cancer to pericarcinous tissues was 0.37. Expression of microRNA-451a was decreased in HCT116, SW620, HT29, SW480, and DLD cells. In our suppression subtractive hybridization library, expression of seven genes was the most highly increased when underexpressing microRNA-451a. They were BCAP31, EEF1A1, CDC20, WDR6, TUFM, RPL13, and RPL7A. Expression of DKK1, PSME1, NDUFA3, and GNB2 was most highly increased when overexpressing microRNA-451a. Gene ontology analysis showed that the main functions of these genes were associated with translational elongation, protein localization to the endoplasmic reticulum, translation, poly(A) RNA binding, negative regulations of Wnt signaling pathway, and so on. MicroRNA-451a was demonstrated to be downregulated in colorectal cancer patient tissues whose target genes were analyzed and functions were predicted by suppression subtractive hybridization.
Keywords
Introduction
Colorectal cancer (CRC) is among the top 10 causes of cancer-related deaths worldwide.1,2 Although some oncogenes and tumor suppressor genes have been identified in CRC, the fundamental molecular pathogenesis remains unclear.3–8 More and more reports revealed that small non-coding RNAs, especially microRNAs, play important roles in carcinogenesis through regulating gene expression at post-translational level.9–12 MicroRNA-451a (miR-451a) has been reported to be significantly downregulated in chronic myeloid leukemia, glioma, non–small cell lung cancer, gastric cancer, and breast cancer.13–21 However, its expression pattern in CRC and its potential targets remain unclear.
Many high throughput studies have documented the gene alterations in CRC, although they failed to encompass a complete view of their molecular pathogenesis.22,23 The suppression subtractive hybridization (SSH) method is a method of selective amplification of differentially expressed sequences, which requires no prior knowledge about gene selection to establish more comprehensive data about the gene alterations. SSH is a complementary DNA (cDNA) subtraction technique based on the polymerase chain reaction (PCR) which allows selective amplification of differentially expressed cDNA while simultaneously suppressing non-differentially expressed cDNA amplification. The cDNA library is generated by two hybridizations and subtraction techniques which reduce abundantly expressed housekeeping genes or genes commonly expressed in both control and treated individuals. 24 As a result, SSH significantly enhances the amplification chances of differentially expressed genes. 25 Some of the advantages of the SSH method include minimum amount of required initial messenger RNA (mRNA), no need for physical separation of single- and double-stranded molecules, equalization of the abundance of mRNA sequences within the target population, suitable for detection of rare transcripts, high sensitivity, low false positive rate, and so on. 26 The SSH method had been employed to screen differentially expressed genes in lung cancer and hepatocellular carcinoma.27,28 However, the SSH method has not been employed in CRC. There were no reports about SSH method after regulating microRNA expression either.
The aim of this study was to investigate miR-451a molecular mechanisms in CRC. So, we determined miR-451a expression pattern in CRC patients, explored its potential target genes by SSH method established by CRC cell lines, and predicted their functions by gene ontology (GO) analysis.
Materials and methods
Patients and tissue samples
The CRC samples and normal pericarcinous tissues were surgically resected from 68 patients with CRC in the Department of Surgery, West China Hospital, Sichuan University, from November 2014 to January 2016, and quickly stored in liquid nitrogen. The pericarcinous tissues are the tissues that are away from cancer tissues at least 5 cm, without cancer cells. They usually appeared inflammatory and fibrotic. Pathological diagnosis was made by two pathologists independently according to the World Health Organization classification. 29 Tumors were staged according to tumor–node–metastasis (TNM) Classification of Malignant Tumors. 30 All the patients did not undergo chemotherapy before surgical resection.
The study protocol was reviewed and approved by the Ethics Committee of West China Hospital. Written informed consents were obtained from patients prior to sampling.
Real-time reverse transcription PCR
Total RNA was extracted from tissues with TRIzol reagent according to the manufacturer’s instructions (TaKaRa, Dalian, China). Its concentration and purity were determined using the BioPhotometer (Eppendorf, Hamburg, Germany). Its integrity was checked with 1% denaturing agarose gel electrophoresis. First-strand cDNA was synthesized from 2 µg of total RNA using 100 U Moloney murine leukemia virus reverse transcriptase (Promega, Shanghai, China) in a 10 µL reaction mixture that also contained 1 µL 10 mM reverse transcription primers and 10 U RNase inhibitor. The reverse transcription primers used are as follows: MiR-451a—forward primer: 5′-ACACTCCAGCTGGGAAACCGTTACCATTAC-3′ and reverse primer: 5′-CTCAACTGGTGTCGTGGAGTCGGCAATTCAGTTGAGCTTACAG-3′, U6—forward primer: 5′-CTCGCTTCGGCAGCAC-3′ and reverse primer: 5′-AACGCTTCACGAATTTGCG-3′.
The real-time reverse transcription PCR (RT-PCR) was run with AceQTM qPCR SYBR Green Master Mix (Vazyme, Nanjing, China) in a final volume of 20 µL, containing 10 µL of master mix, each with 0.4 µL of 10 µM forward and reverse primers, and 2 µL of cDNA. The thermal cycling program was as follows: an initial heating at 95°C for 5 min, followed by 35 cycles of 10 s at 95°C, and 60°C for 30 s. Expression of miR-451a was normalized to the internal U6 levels. Each sample was run in triplicate, and the threshold cycle (Ct) numbers were averaged. Melting curve analysis was performed by increasing the temperature from 65°C to 95°C in 0.1°C/s increments for each fluorescence reading using the CFX96 Touch™ qPCR System (Bio-Rad Laboratories, Hercules, CA, USA).
Cell culture
A total of 5 CRC cell lines, HCT116, HT29, SW480, SW620, and DLD, were obtained from the American Type Culture Collection (ATCC, Manassas, VA, USA). They were cultured in Dulbecco’s Modified Eagle’s Medium (DMEM) containing 10% fetal bovine serum, 100 U/mL penicillin, 100 µg/mL streptomycin, and maintained in a humidified incubator with 5% CO2 at 37°C. Total RNA was extracted from these cells, and expression of miR-451a was determined by real-time RT-PCR. A normal colonic epithelial cell line, NCM460, was used as a control.
Construction of the expression vector and cell transfection
A packaged lentiviral Lv-miR-451a and the control Lv-miR-451a-NC were commercially obtained (Hanheng, Shanghai, China). Lentivirus was taken from the refrigerator and rapidly thawed at 37°C in water bath. The original cell culture medium was removed. The lentivirus was added into new cell culture medium and gently mixed according to a multiplicity of infection (MOI) as 4. After 12 h of infection, the culture medium containing lentivirus was removed. The new fresh complete culture medium was added. The transfected cells were cultured at 37°C. To carry puromycin resistance gene of the virus, stably transfected cell lines HCT116-Lv-miR-451a and HCT116-Lv-miR-451a-NC were screened by the fresh complete medium with a suitable concentration of puromycin.
Construction of the SSH cDNA library and subtractive efficiency
Total RNA was extracted from cell cultures with TRIzol reagent according to the manufacturer’s instructions (TaKaRa). First-strand cDNA was synthesized from 2 µg of total RNA using 100 U of Moloney murine leukemia virus reverse transcriptase in a 10 µL reaction mixture which also contained 1 µL of 10 mM primer 3-coding sequence (CDS) and 10 U of RNase inhibitor. After incubation at 42°C for 1.5 h, 30 µL of double-distilled water (ddH2O) was added. The mixture was incubated at 95°C for 5 min to inactivate the reverse transcriptase. RNA quality was assessed using a 1% denaturing agarose gel electrophoresis. When constructing a subtracted library, it is routine to use a single sample pair. SSH library construction was achieved using the PCR-Select cDNA Subtraction Kit (Clontech, Palo Alto, CA, USA) according to the manufacturer’s instructions. The first and second cDNA synthesis was carried on with 2 µg of mRNA from samples. With HCT116-Lv-miR-451a-NC mRNA and HCT116-Lv-miR-451a mRNA as driver/tester, we constructed forward-subtracted library (FSL) and reverse-subtracted library (RSL). The resulting cDNA was digested with RsaI, and the blunt ended double-stranded cDNA was purified. The tester cDNA was divided into two parts, which were individually ligated to adaptor 1 and adaptor 2, respectively. The adaptor-1 and adaptor-2 ligated cDNAs were separately hybridized with excess amounts of driver cDNA for 8 h at 68°C. The two hybridization mixtures were combined and hybridized with excess amounts of driver cDNA overnight at 68°C. The final hybridization mixture was diluted using 200 µL of dilution buffer for two subsequent rounds of PCR. The constructed SSH libraries were confirmed using 1% agarose gel electrophoresis.
The constructed SSH libraries were purified using the PCR Product Purification Kit (Roche Applied Science, Shanghai, China). The purified PCR products were ligated into the pUC19 cloning vector and transformed into Escherichia coli NovaBlue competent cells (Novagen, Madison, WI, USA). Positive clones were verified using the colony PCR method with the adaptor-specific primers N1 (5′-TCGAGCGGCCGCCCGGGCAGGT-3′) and N2R (5′-AGCGTGGTCGCGGCCGAGGT-3′). The plasmids were isolated for sequencing using the High Pure Plasmid Isolation Kit (Roche Applied Science). Single direction DNA sequencing was commercially achieved (Tsingke Ltd, Chengdu, China).
The efficiency of the subtraction was analyzed by comparing the abundance of glyceraldehyde 3-phosphate dehydrogenase (GAPDH) before and after subtraction by real-time PCR with primers—forward: 5′-AGAAGGCTGGGGCTCATTTGC-3′, reverse: 5′-ACAGTCTTCTGGGTGGCAGTG-3′. Briefly, reactions were prepared by adding 10 µL of SYBR Green Master Mix (Vazyme), 1 µL of sample, 0.8 µL of the primers, and diethylpyrocarbonate (DEPC)-treated water to a final volume of 20 µL. The thermal cycling program was as follows: an initial heating at 95°C for 5 min, followed by 35 cycles of 10 s at 95°C, and 60°C for 30 s. Each sample was run in triplicate, and the Ct numbers were averaged.
Bioinformatics searches
Similarity searches were performed using the BLASTn, tBLASTn, and tBLASTx algorithms in the National Center for Biotechnology Information (NCBI) GenBank databases (http://blast.ncbi.nlm.nih.gov/Blast.cgi) to analyze the sequences. These gene sequences from both FSL and RSL were submitted to Omicsbean web platform (http://www.omicsbean.com:88/). The query proteins were given as a list, these proteins were linked to the following databases—the QuickGO (gene ontology analysis), the Kyoto Encyclopedia of Genes and Genomes (KEGG) Pathway (pathway analysis), and STRING (protein–protein interaction analysis)—for downstream analysis. GO mapping was done after the BLAST search. In addition, it included a final integration of the relational GO categories with the Annex option.
Statistical analysis
Data are expressed as mean ± standard deviation (SD). The relative gene expression was analyzed with the Livak and Schmittgen method. 31 The Statistical Package for Social Sciences version 13.0 (SPSS Inc., Chicago, IL, USA) was used for standard statistical analysis by one-way analysis of variance. The statistical significance was set at p < 0.05.
Results
MiR-451a was underexpressed in CRC tissues and correlated with tumor metastasis and clinical classifications in CRC patients
Clinical classifications of CRC patients were made based on histological and clinical phenotypes. As shown in Figure 1, expression of miR-451a was significantly decreased in CRC specimens compared to that in pericarcinous tissues from the same patient. The median relative expression ratio of miR-451a in tumor/pericarcinous tissue was 0.37-fold. In total, expression of miR-451a in 57 of 68 CRC tissues (83.82%) was decreased compared to pericarcinous tissues, especially in stage II and III (Figure 2). As shown in Table 1, expression of miR-451a was correlated with CRC metastasis (p < 0.05) and advanced clinical stage of tumor (p < 0.05).
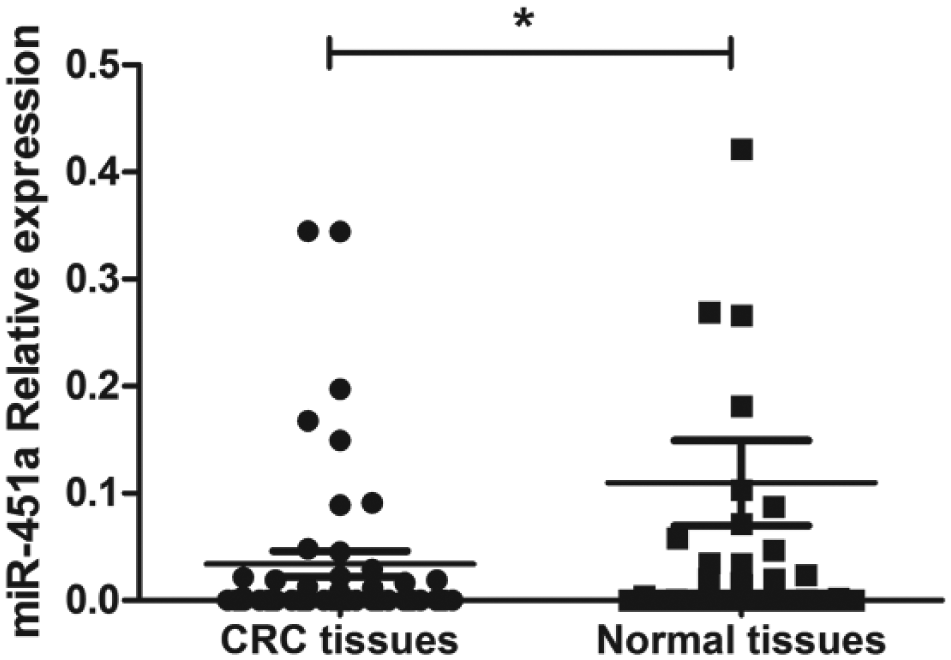
MiR-451a relative expression in CRC tissues and pericarcinous tissues as determined by real-time RT-PCR and normalized to the reference U6 expression (n = 68; *p < 0.05).
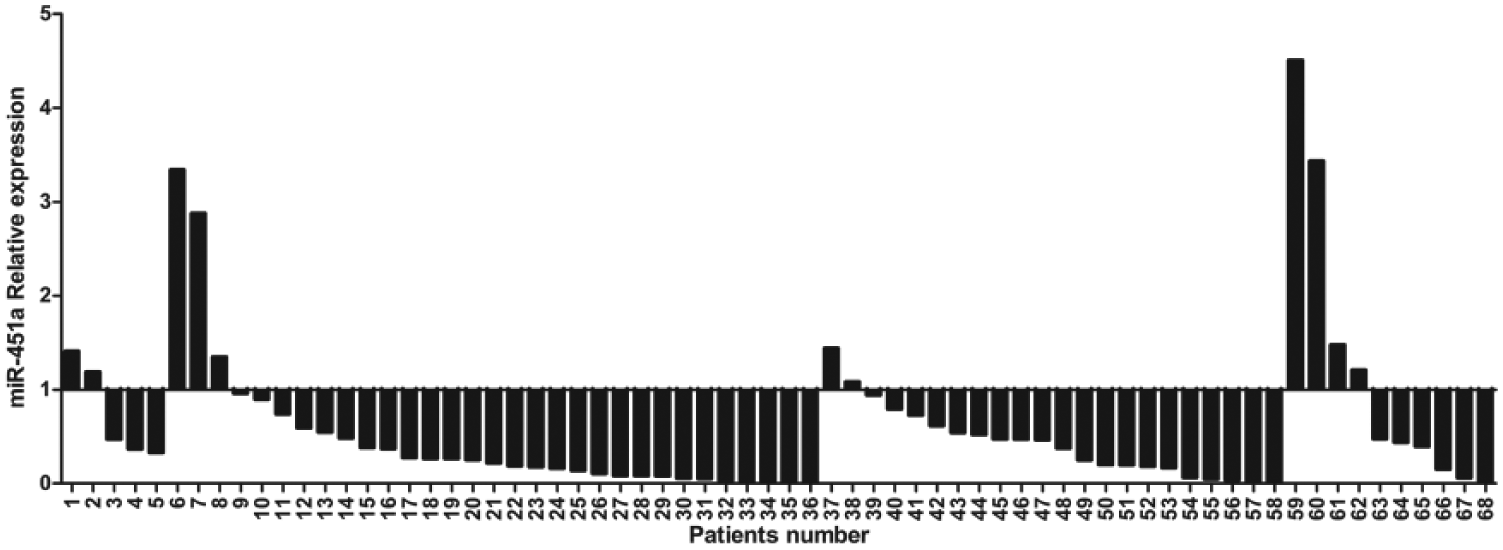
Relative ratio of miR-451a expression in CRC tissues to pericarcinous tissues for each patient. Patients number 1–5: stage I, 6–36: stage II, 37–58: stage III, and 59–68: stage IV.
Relationship between expression of miR-451a in CRC and clinicopathological features (n = 68).

CRC: colorectal carcinoma; CEA: carcinoembryonic antigen.
p < 0.05.
MiR-451a was underexpressed in CRC cell lines, especially in HCT116 cells
As shown in Figure 3, expression of miR-451a was especially decreased in HCT116 with the 0.32-fold relative expression ratio compared to NCM460. In HT29, SW480, SW620, and DLD, miR-451a relative expression ratios were 0.44-, 0.53-, 0.43-, and 0.73-fold, compared to NCM460, respectively.
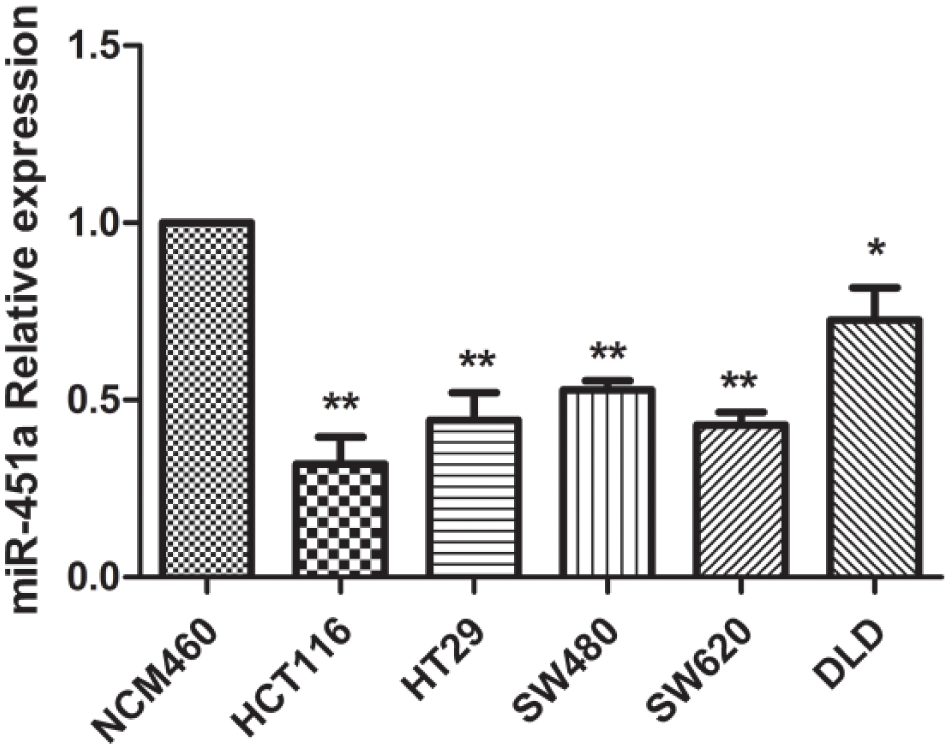
MiR-451a relative expression in NCM460, HCT116, HT29, SW480, SW620, and DLD cells as determined by real-time RT-PCR and normalized to the reference U6 expression (*p < 0.05, **p < 0.01).
Generation of SSH cDNA libraries and subtraction efficiency
As shown in Figure 4, expression of miR-451a was 2.1-fold in HCT116-Lv-miR-451a cells compared to that in untreated HCT116 cells. No difference was observed in the expression of miR-451a between HCT116-Lv-miR-451a-NC cells and untreated HCT116 (1.07-fold). The constructed SSH library was shown in Figure 5(a), in which the subtracted genes were in the 180 bp to 1200 bp region. Subtraction efficiency was evidenced by amplification of GAPDH. Real-time PCR analysis showed that GAPDH has an 8.26-fold reduction in the subtracted library, compared with the non-subtracted library (Figure 5(b)).

MiR-451a relative expression in untreated HCT116, Lv-miR-451a-NC HCT116, and Lv-miR-451a HCT116 cells as determined by real-time RT-PCR and normalized to the reference U6 expression (**p < 0.01).

Construction of the SSH library. (a) Forward-subtracted library (L1) and reverse-subtracted library (L2), which ranged in length from 180 to 1200 bp; L3: marker. (b) Evaluation of the subtraction efficiency of the constructed library. The relative expression of the GAPDH in the two samples indicated that there was 8.26-fold decrease in beta-actin expression in the subtracted cDNAs.
GO analysis of genes identified in SSH and functional annotation
Altogether, 187 and 102 subtractive cDNA clones were obtained from the FSL and RSL, respectively. Using the BLAST algorithm at NCBI RefSeq, GenBank, and dbEST, we detected BCAP31, EEF1A1, CDC20, WDR6, TUFM, RPL13, and RPL7A, in the FSL, which represented those genes which were upregulated when miR-451a was underexpressed in HCT116 cells. In addition, DKK1, PSME1, NDUFA3, and GNB2, in the RSL, were detected to represent those genes which were upregulated when miR-451a was overexpressed in HCT116 cells. Terms corresponding to translational elongation (GO:0006414), protein localization to the endoplasmic reticulum (GO:0070972), translation (GO:0006412), and poly(A) RNA binding (GO:004482) were highly associated with genes detected in the FSL (Table 2). In addition, terms related to negative regulations of Wnt signaling pathway were also observed to be enriched in RSL (Table 3). Genes from FSL and RSL oncology GO terms in the biological processes, cell components, and molecular functions are shown in Figure 6. The bioinformatics analysis demonstrated that the major functions of these genes were related to molecular transport, cellular signaling and interaction, cellular growth, and proliferation.
Genes expressed in the FSL, with GO terms in biological processes, cell components, and molecular functions.

FSL: forward-subtracted library; GO: gene ontology; Max level: maximal annotated level of this term in the GO graph (tree); Genes: list of involved genes in the query with the terms.
p value was calculated with Fisher’s exact test using hypergeometric algorithm.
Genes expressed in the RSL, with GO terms in biological processes, cell components, and molecular functions.

RSL: reverse-subtracted library; GO: gene ontology; Max level: maximal annotated level of this term in the GO graph (tree); Genes: list of involved genes in the query with the terms.
p value was calculated with Fisher’s exact test using hypergeometric algorithm.
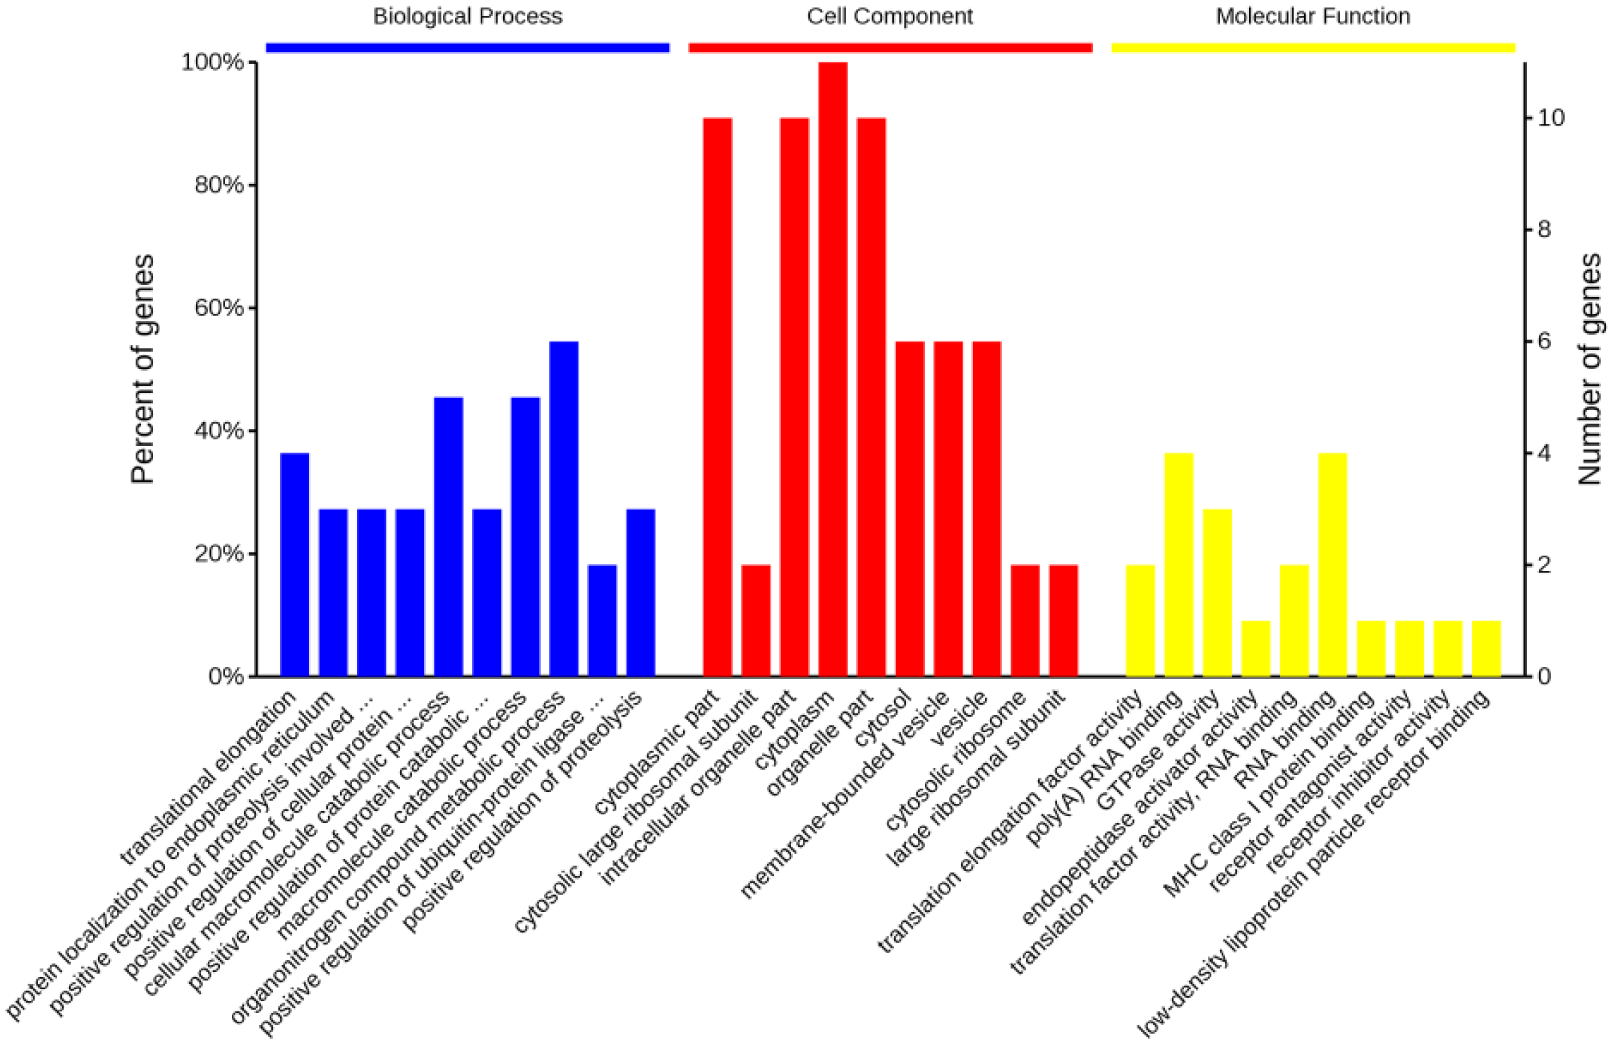
Genes from FSL and RSL were implicated in oncology of biological processes, cell components, and molecular functions.
Discussion
MiR-451a has been reported to be involved in many cancers, such as non–small cell lung cancer, gastric cancer, and breast cancer. Our preliminary experiments demonstrated that miR-451a played important roles in breast cancer. So we hypothesized that miR-451a also plays important roles in CRC. A recent study reported that expression of miR-451, not miR-451a, was decreased in 46 CRC patients and inversely correlated with Dukes’ stage of colon cancer. 32 However, expression of miR-451a in CRC patients and correlation with TNM stages have not been reported yet.
Our first key finding was that expression of miR-451a was significantly decreased in CRC tissues compared to pericarcinous tissues in 68 CRC patients and correlated with tumor metastasis and advanced TNM stages in CRC patients. There are many biomarkers for CRC at present. Serum carcinoembryonic antigen (CEA) was a classic tumor marker for CRC in clinical diagnosis. 33 Some proteins in tissues, such as thymidylate synthase (TS) and transforming growth factor (TGF), were also used as CRC biomarkers.34,35 It has been found that miRNA expression was tissue-specific and closely related to tumor staging and grading. For example, expression of miR-92a was decreased in CRC, and it can be used as an early diagnosis biomarker for CRC. 36 However, no optimal biomarker is available yet. Our findings strongly suggest that miR-451a plays important roles in CRC and may serve as a biomarker for CRC.
How does miR-451a play roles in CRC? What are its molecular targets? We constructed CRC cell lines overexpressing and underexpressing miR-451a. Subtractive cDNA library was constructed by the simple and highly effective technique, SSH. SSH has many advantages, such as low false positive rate, high sensitivity, and rapid detection of low abundance genes. SSH has been successfully employed to investigate differentially expressed genes in hepatocellular carcinoma and gastric cancer. However, SSH has not been successfully used in CRC or to investigate genes regulated by microRNAs. To our knowledge, our study is the first report about investigating genes regulated by microRNA in CRC by SSH method. In this study, we constructed FSL and RSL of differentially expressed genes using the two differently expressed miR-451a CRC cells. In our SSH library, seven genes, BCAP31, EEF1A1, CDC20, WDR6, TUFM, RPL13, and RPL7A, were overexpressed when miR-451a was underexpressed. They may be potential target genes of miR-451a in CRC. Of course, further studies are definitely needed.
Functions of these differentially expressed genes were predicted by GO analysis. Their functions were predicted to be involved in several processes: molecular transportation, translational elongation, cell cycle, protein localization to the endoplasmic reticulum, translation, poly(A) RNA binding, cell apoptosis, cellular growth, and proliferation. In our FSL, 28.6% upregulated genes were ribosomal protein associated genes. A lot of ribosomal proteins were upregulated in the miR-451a underexpressed CRC cells, indicating that thriving cancer cells need plenty of ribosomal proteins.37–39
However, this study has several limitations. We used CRC cell lines differentially expressing miR-451a to generate SSH library. Our results need further verification in CRC patients. Our results do provide some proof to the roles and mechanisms of miR-451a in CRC. Indeed, the vast majority of the differentially expressed genes of our library have not been reported to be abnormally expressed in CRC.
In conclusion, we used the SSH method to generate two cDNA libraries to detect differentially expressed genes regulated by miR-451a in CRC. We detected BCAP31, EEF1A1, CDC20, WDR6, TUFM, RPL13, and RPL7A to be upregulated and DKK1, PSME1, NDUFA3, and GNB2 to be downregulated when miR-451a was underexpressed. Most of them play important roles in translational elongation, protein localization to the endoplasmic reticulum, translation, and poly(A) RNA binding. Our findings suggest that miR-451a may regulate the genes involved in molecular transport, translational elongation, cell cycle, protein localization to the endoplasmic reticulum, translation, poly(A) RNA binding, cell apoptosis, cellular growth, and proliferation in CRC.
Footnotes
Acknowledgements
The authors are grateful to Dr Fei-Jun Huang and Dr Wei-Bo Chen, Department of Pathology, West China Hospital, for pathological diagnosis of CRC patients. K.X. and Y.-Y.Z. equally contributed to this work and should be considered as co-first authors.
Declaration of conflicting interests
The author(s) declared no potential conflicts of interest with respect to the research, authorship, and/or publication of this article.
Funding
The author(s) received no financial support for the research, authorship, and/or publication of this article.