
Abstract
Glutamate receptor, ionotropic, kainate 3 (GRIK3), as a member of the glutamate kainate receptor family, mainly participated in neuroactive ligand receptor interaction pathway. Other members of GRIK family were previously reported to regulate cellular migration, transformation, and proliferation in tumor. However, the mechanism of GRIK3 in tumor is still unclear. Therefore, the purpose of our study was to reveal the expression and clinical significance of GRIK3 in gastric cancer (GC). First, we performed the expression analysis and survival analysis of GRIK3 using The Cancer Genome Atlas (TCGA) database, and the results showed that the GRIK3 expressed differentially between gastric cancer tissues and the adjacent normal tissues and that higher expression of GRIK3 was associated with poor survival outcomes. And the gene ontology (GO) and Kyoto Encyclopedia of Genes and Genomes (KEGG) pathway analysis suggested that GRIK3 mainly took part in cancer-related process. Subsequently, the validated immunohistochemistry showed that GRIK3 expressed higher in the GC tissues than in the matched normal tissues and the patients with overexpressed GRIK3 had worse survival outcomes. The univariate and multivariate analyses suggested that the expression of GRIK3 was an independent prognostic factor to predict GC prognosis. Furthermore, additional experiment showed that the lymph node metastasis tissues had higher GRIK3 expression than their matched primary GC tissues. These findings suggested that elevated GRIK3 expression could serve as an independent prognostic biomarker and a novel potential treatment target for patients with GC.
Keywords
Introduction
The incidence of gastric cancer (GC) has decreased worldwide; however, it is still ranked as the fifth most common malignant tumor and the third leading cause of cancer-related death. 1 The development of GC contains multistep process and various genetic factors. Although many experiments investigating the mechanism of GC have been performed, the mechanism is still unclear up to now. Many targeted therapy methods have been used for the patients, but the outcomes remain unsatisfactory. Thus, it is urgent for us to seek novel therapeutic targets and improve the therapy method for GC patients.
Glutamate receptor mainly mediates the excitatory neurotransmission in the central nervous system.
2
It is classified into metabotropic glutamate receptors (mGlu) and ionotropic glutamate receptors. The metabotropic glutamate receptors are single-subunit proteins coupled to G proteins and mainly consist of mGlu1-8. While the ionotropic glutamate receptors contain multiple subunits that are used to constitute the ligand-gated ion channels and that are mainly composed of α-amino-3-hydroxy-5-methyl-4-isoxazolepropionic acid (AMPA) receptors (GRIAs), N-Methyl-
GRIK3, as a member of the glutamate kainate receptor family, shares the same structure with the ionotropic glutamate receptors. By Kyoto Encyclopedia of Genes and Genomes (KEGG) pathway analysis, we found that GRIK3 was mainly enriched in neuroactive ligand receptor interaction pathway. Huan et al. 9 found genes, which were stimulated or inhibited by estradiol (E2) in breast cancer cells, mainly enriched in neuroactive ligand receptor interaction pathway. Liu et al. 10 found that neuroactive ligand receptor interaction was also significantly associated with colon cancer.
However, up to now, we still know little about the roles of GRIK3 in the tumor oncogenesis and development. Whether GRIK3 have prognostic impact in GC patients and differentially express in GC tissues is still unknown. Therefore, in this study, we explored the differential expression of GRIK3 in GC patients based on The Cancer Genome Atlas (TCGA) database and validated it using the GC tissues from our hospital. Furthermore, we explored the influence of GRIK3 expression on GC patients’ prognosis and the relationship between GRIK3 and clinicopathological characteristics.
Materials and methods
Gene expression, clinicopathological, and follow-up data from TCGA
The level-3 expression data (RNA-seqV2) and clinicopathological data of 405 GC patients and 35 normal samples were downloaded from TCGA database using the TCGA-assembler in R software.11,12 Then, we constructed a data frame containing patients’ clinicopathological characteristics, prognostic information, and the expression data of GRIK family. We divided patients into two groups according to median expression for further analysis.
Identified the differentially expressed genes (DEGs) of GRIK family
We screened out the DEGs with adjusted p value (adjp) < 0.001 and |logFC| > 2 between the normal tissue group and GC tissue group using the DESeq package in R software. 13 The volcano plot and heatmap of these DEGs were obtained through gplots package in R to represent expression information of the genes among different samples. Then, we performed the differential expression and survival analyses of GRIK family using the data frame we constructed before. Both the adjusted p value (adjp) and survival p value < 0.05 were considered as significant difference.
To further investigate the DEGs, protein–protein interaction (PPI) network was constructed using STRING database (Search Tool for the Retrieval of Interacting Genes/Proteins, http://www.string-db.org/). 14 Sub-network modeling analysis was performed using the molecular complex detection (MCODE) in the whole network and visualized by Cytoscape. 15 To explore the function and pathway of the genes, the top 100 gene ontology (GO) enrichment and KEGG pathways analysis were conducted using the online tool of DAVID (a Database for Annotation, Visualization, and Integrated Discovery, http://david.abcc.ncifcrf.gov/). 16
Patients and clinicopathological data of tissue microarrays
In this study, data of 626 GC patients who received curative surgery resection between January 2006 and October 2008 in the First Affiliated Hospital of China Medical University were collected. They contained 174 females and 452 males and the mean age was 59 years (range = 20–84). Additionally, none of them received radiotherapy or chemotherapy before surgery. Follow-up was in accordance with National Comprehensive Cancer Network (NCCN) Guidelines for GC. The follow-up time was collected at the end of January 2014, and the median follow-up time was 47.5 months (range = 1–98 months).
Ethics statement
All the tissue specimens in this study got the patients’ agreements, and this research also got the permission from the Research Ethics Committee of China Medical University.
Tissue samples and pathology
The tissues of GC and their matched normal tissues were collected during operation. The pathologists gave the histological grade assessment of gastric carcinoma based on histological classification standard of the World Health Organization (WHO) and other microscopic characteristics. 17 The tumor–node–metastasis (TNM) stage for each gastric carcinoma was assessed according to the seventh edition of the American Joint Committee on Cancer (AJCC) TNM classification. 18
Tissue microarray slides and lymph node metastasis tissue were prepared
After being fixed in formalin (10%) overnight, the tissues were embedded in paraffin. Then, hematoxylin and eosin (HE) stain method was used to locate the representative region of solid tumor tissue and normal tissue (at least 5 cm away from the cancer lesions). Tissue microarray (TMA) slides were made by a manual tissue arraying tool, and we made a donor block by punching out a 1.5-mm-diameter tissue core and transferred it to the recipient block. The 4-µm-thick sections were cut from the TMA block strictly and continuously.
Immunohistochemistry
Those TMAs were deparaffinized in xylene and hydrated, and antigen retrieval was mediated by heating in water bath of citrate buffer (pH 6.0) for 15 min. And these TMAs were treated with 3% hydrogen peroxide for 15 min at room temperature and incubated with 10% goat serum. Then, the sections were incubated with 1:300 dilution of anti-GRIK3 antibody (rabbit monoclonal; Abcam, Cambridge, UK) at 4°C for overnight. Then, they were incubated for 30 min with biotin-labeled secondary antibody at room temperature and stained with 3,3′-diaminobenzidine (DAB) for 1–3 min under microscopic control. The TMAs were counterstained with hematoxylin, dehydrated, rinsed, and mounted. The negative controls were stained without primary antibody.
Evaluation of IHC stain
Immunoreactivity of GRIK3 was evaluated independently by two experienced pathologists who were blind with the patients’ information. The final evaluation result was a comprehensive consideration of the staining intensity and the proportion of positive cells. The proportion was the mean percentage of GRIK3-positive tumor cells elevated in five areas at 400× magnification. The staining intensity of GRIK3 was scored as 0 (−) negative, 1 (+) weak, 2 (++) moderate, and 3 (+++) strong. Then, the proportion of positive cells was considered as follows: 0, negative; 1, positive ≤10% of cells; 2, positive >10% and ≤50%; 3, positive >50% and ≤75%; and 4, positive in >75% of cells. The two scores were multiplied and the expression was graded as follows: negative, score = 0 (−); weak expression, score = 1–4 (+); moderate expression, score = 5–8 (++); and strong expression, score = 9–12 (+++). These specimens were divided into two groups according to their scores: 0–4 was the low-expression group, and 5–12 was the high-expression group.
Statistical analysis
All statistical analyses were performed by SPSS statistical software (Standard version 20.0; Chicago, IL, United States). The association between GRIK3 protein expression and clinicopathological characteristics was analyzed by Chi-square tests. The overall survival (OS) rates were determined using the Kaplan–Meier curves, and the differences were identified by the log-rank test. The Cox proportional hazard model was used for univariate and multivariate analyses to identify the independent prognostic factors. For all analyses, p < 0.05 was considered statistically significant.
Results
Identification of the significant DEGs of glutamate receptor family in GC
After analyzing the data from the TCGA, we totally got 662 DEGs between the GC and normal samples, including 145 upregulated and 517 downregulated genes. The volcano plot and heatmap showed us the expression distribution of the DEGs (Figure 1(a) and (b)). In GRIK family, we found that GRIK2, GRIK3, and GRIK5 had significant expression difference between GC tissues and normal tissues (all expressed p value < 0.05). For survival analysis, we indentified that only GRIK3, GRIK4, and GRIK5 had significant survival difference when we divided patients into two groups according to their median expression value (all survival p value < 0.05). Thus, combined with the differentially expressed analysis and survival analysis of the genes from GRIK family, GRIK3 and GRIK5 were selected as DEGs (Table 1).

The volcano plot and heatmap of the differentially expressed genes (DEGs) from TCGA database. (a) The volcano plot was constructed using log2 fold change and −log10 (padj) values. Red plots represented the upregulated genes, green plots represented the downregulated genes, and black plots showed those genes that were not differentially expressed. (b) The heatmap analysis of 405 gastric cancer tissues and 35 normal gastric tissues was performed by R software with DESeq package (padj1). Red nodes: upregulated genes; green nodes: downregulated genes.
The significantly expressed genes of GRIK family in gastric cancer analyzed from TCGA database.
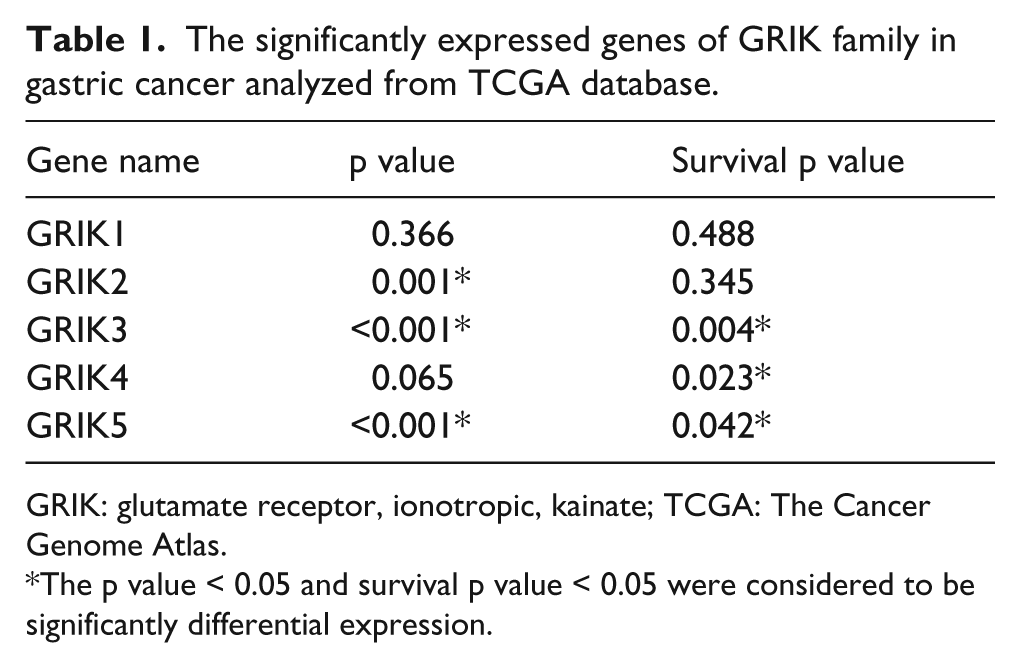
GRIK: glutamate receptor, ionotropic, kainate; TCGA: The Cancer Genome Atlas.
The p value < 0.05 and survival p value < 0.05 were considered to be significantly differential expression.
The whole PPI network contained 474 nodes and 1148 edges (Figure 2(a)). The nodes stand for the DEGs and the edges represented the interaction between these DEGs. And the sub-network modeling analysis for all members of GRIK family showed that only GRIK3 was in the sub-network. And these results suggested that GRIK3 may play an important role in the development of GC (Figure 2(b)). Subsequently, the GO enrichment analysis investigated that GRIK3 mainly participated in the regulation of cellular homeostasis (Table 2). Additionally, KEGG pathway analysis showed that GRIK3 was mainly enriched in a cancer-related pathway: neuroactive ligand–receptor interaction (Table 3). Additionally, our aforementioned results showed that patients with low GRIK3 expression showed a better prognosis in the TCGA database (Figure 2(c)). Therefore, based on the above results, our study will mainly focus on the expression of GRIK3 in GC.

Interaction networks of the DEGs. (a) Protein–protein interaction (PPI) network of the DEGs. (b) The sub-network contained GRIK3. Red nodes showed upregulated genes and green nodes showed downregulated genes in gastric cancer. (c) Kaplan–Meier curves of patients with gastric cancer based on the expression of GRIK3 in TCGA database. Patients with low expression of GRIK3 showed a better survival rate (p = 0.004).
The GO terms of the differentially expressed genes.

GO: gene ontology; BP: biological process; CC: cellular component; MF: molecular function; GO: gene ontology; FDR: false discovery rate.
The enriched KEGG pathways of differentially expressed genes.

KEGG: Kyoto Encyclopedia of Genes and Genomes.
Analyzed the relationship between the GRIK3 expression and the clinicopathological characteristics of GC patients
To investigate the role of GRIK3 in GC, we detected the expression of GRIK3 in TMAs by IHC. We evaluated the expression level of GRIK3 in the TMAs. A total of 584 GC samples (42 tissues missed during the experiment) included 226 GC tissues matched with their non-cancerous tissues and 358 unpaired cancer tissues. We found that 265 (45.4%) tissues showed strongly positive expression (Figure 3(a)), 193 (33.0%) tissues showed moderately positive expression (Figure 3(b)), and 126 (21.6%) tissues showed weakly positive expression (Figure 3(c)). Moreover, GRIK3 protein presented weak immunoreactivity in 156 of 226 (69.0%) nontumorous tissues (Figure 3(d)). Compared with the normal tissues, GRIK3 was obviously overexpressed in GC tissues (p < 0.001; Figure 3(e)). The receiver operating characteristic (ROC) curve analysis showed that the area under the ROC curve (AUC) was 0.741 (95% confidence interval (CI): 0.704–0.778, p < 0.001, the Youden’s index = 0.35), which suggested that GRIK3 could be a novel biomarker to discriminate cancer from nontumorous tissues (Figure 3(f)). When we explored the association between the expression of GRIK3 and the clinicopathological characteristics of GC, we found that overexpression of GRIK3 was obviously associated with lymph node (LN) metastasis (p = 0.027) and TNM stage (p = 0.011). However, the expression of GRIK3 was not associated with the age (p = 0.094), gender (p = 0.329), histological differentiation (p = 0.251), depth of invasion (p = 0.212), distal metastasis (p = 0.655), vein invasion (p = 0.480), and lymphatic invasion (p = 0.369; Table 4).

GRIK3 is overexpressed in gastric cancer tissues, accompanied with worse prognosis. (a) GRIK3 showed a strongly positive expression in gastric cancer, and magnifications were 200×. (b) GRIK3 showed a moderately positive expression in gastric cancer, and magnifications were 200×. (c) GRIK3 showed a weakly positive expression in gastric cancer, and magnifications were 200×. (d) GRIK3 showed weaker expression in normal gastric tissues than gastric cancer tissues, and magnifications were 200×. (e) Immunohistochemical analysis of GRIK3 protein in gastric cancer TMAs. The relative expression of GRIK3 was significantly higher in gastric cancer tissues (n = 584) than normal tissues (n = 226). (f) The ROC curve of gastric cancer patients was based on GRIK3 expression in gastric cancer samples and matched normal samples. (g) Kaplan–Meier curves of patients with gastric cancer in TMAs. Patients with low expression of GRIK3 showed a better prognosis than those with GRIK3 overexpression (p < 0.001).
Associations between high GRIK3 expression and clinicopathological characteristics in GC patients.

GC: gastric cancer.
GRIK3 influences the prognostics of GC patients
The Kaplan–Meier survival analysis was used to identify the survival difference of GRIK3 from the TMAs. We found that patients with low GRIK3 expression had a better 5-year survival rate than those with high GRIK3 expression (59.2% vs 45.1%, p = 0.001; Figure 3(g)). This result was consistent with the previous result we obtained from TCGA database (Figure 2(c)).
Multivariate analysis suggested that age, differentiation, depth of invasion, TNM stage, and lymphatic invasion (all p < 0.05) were independent prognostic factors for OS. Additionally, the LN metastasis (hazard ratio (HR) = 1.791, 95% CI: 1.277–2.510, p = 0.001) and GRIK3 expression (HR = 1.417, 95% CI = 1.076–1.865, p = 0.013) were also the independent prognostic factors for survival of the patients (Table 5).
Univariate and multivariate analyses for overall survival rate after surgery using Cox relative risk.
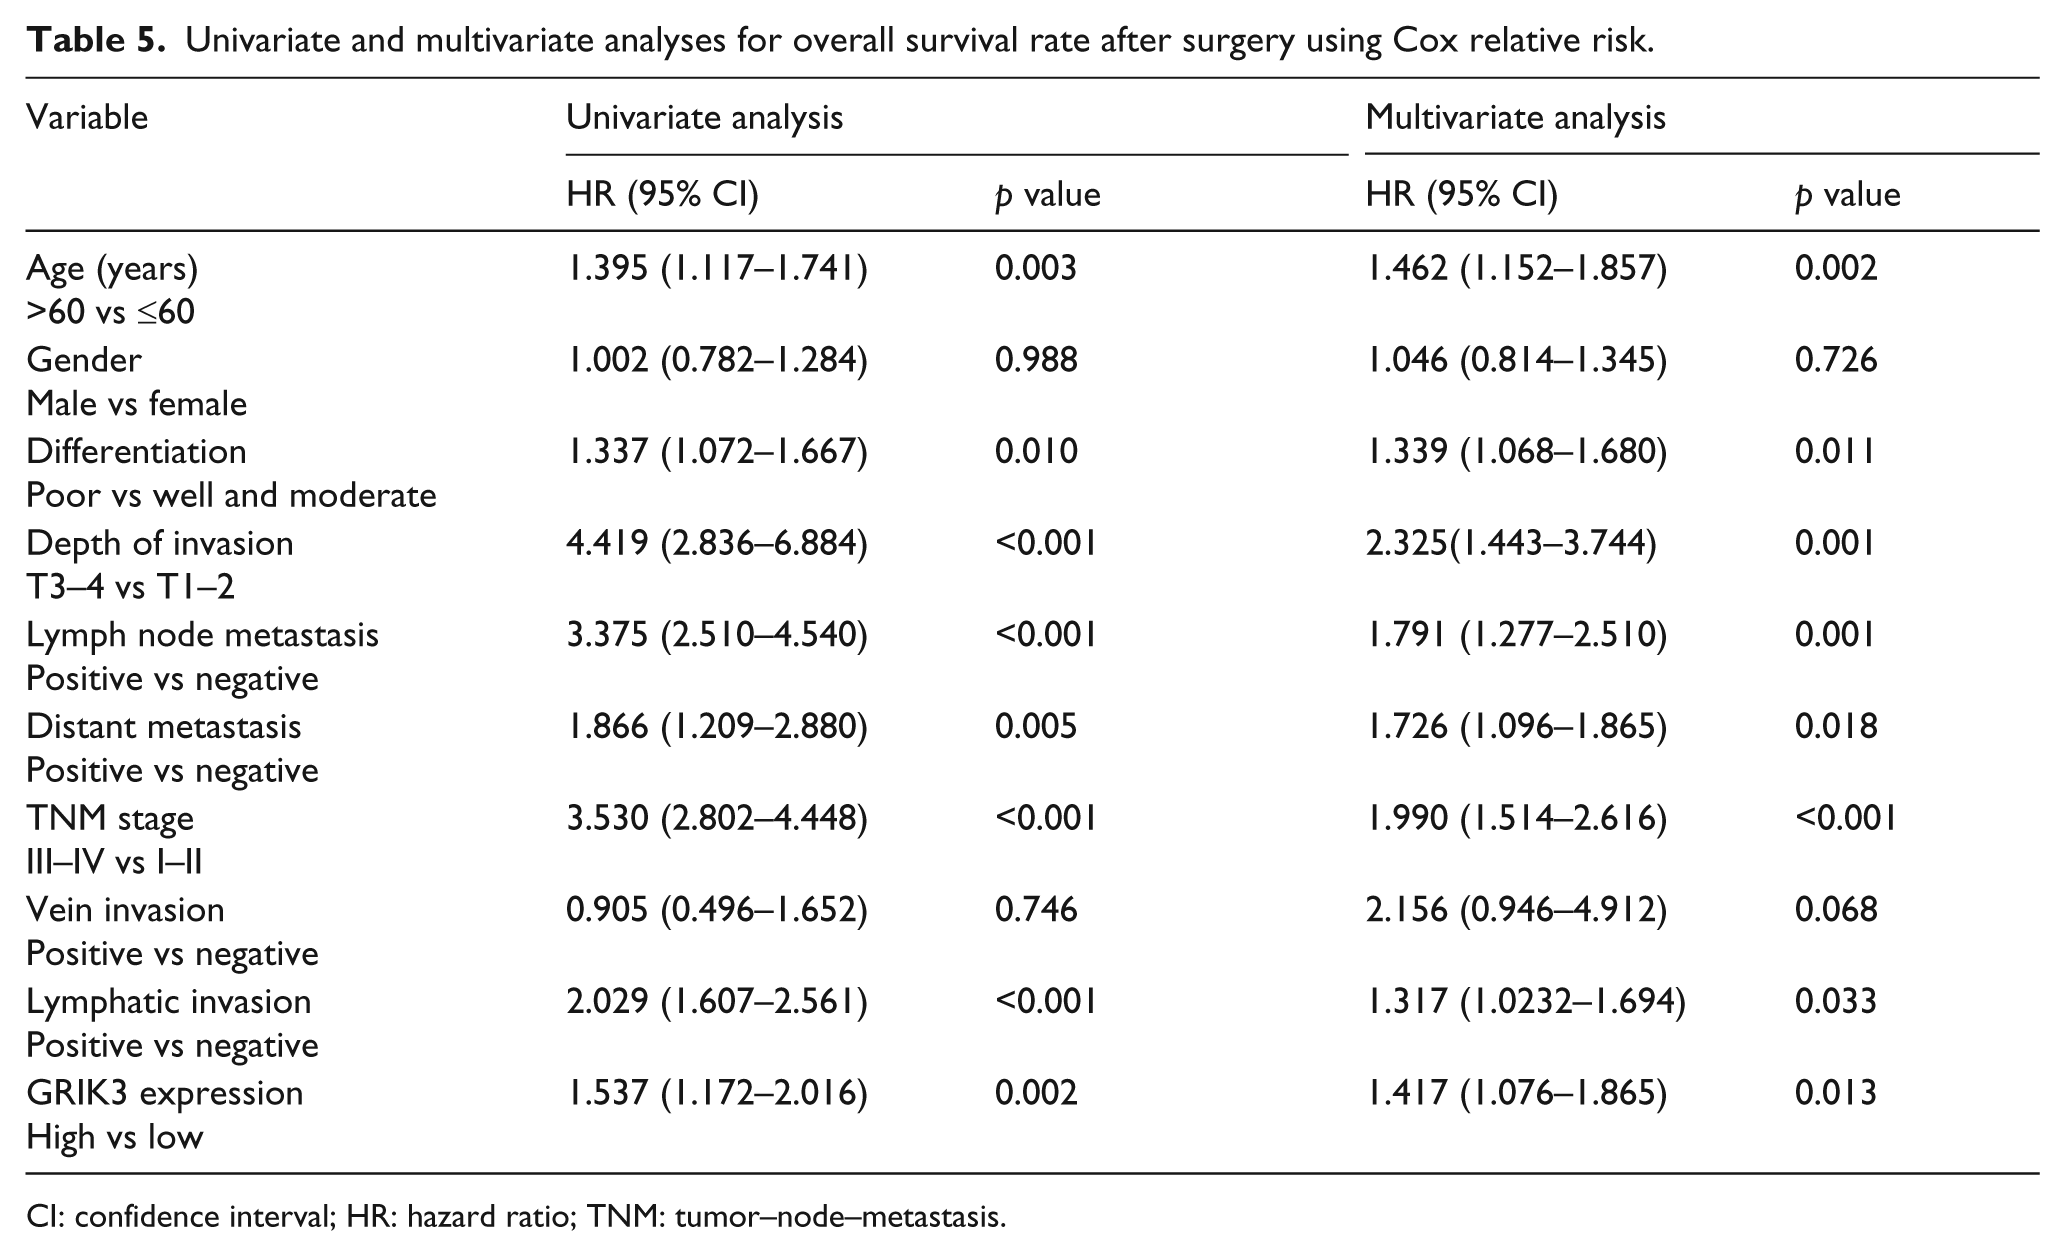
CI: confidence interval; HR: hazard ratio; TNM: tumor–node–metastasis.
Overexpressed GRIK3 associates with LN metastasis
To further investigate the association between overexpressed GRIK3 and LN metastasis, IHC was used with 20 primary GC tissues and their matched LN metastatic samples to detect the expression of GRIK3. In all, 15 (75%) LN metastasis tissues showed strong positive expression (Figure 4(a)), while 12 (60%) primary GC tissues showed positive expression (Figure 4(b)). The results showed that GRIK3 had significantly higher expression in LN metastasis group than primary GC tissues (p < 0.001, Figure 4(c)). For patients with LN metastasis, elevated GRIK3 expression showed a poor survival outcomes (p = 0.039 Figure 4(d)). However, the expression of GRIK3 had no effect on survival for patients without LN metastasis (p = 0.372, Supplementary Figure 1).

GRIK3 expression is higher in the LN metastasis tissues than primary tumors. (a) GRIK3 was strongly expressed in LN metastasis tissues, and magnification was 200×. (b) GRIK3 was positively expressed in primary gastric cancer tissues, but weaker than LN metastasis group, and magnification was 200×. (c) The GRIK3 protein in 20 LN metastasis tissues and matched primary tumors were detected by immunohistochemical analysis. The relative expression of GRIK3 in LN metastasis tissues is higher than matched primary gastric cancer tissues. (d) Kaplan–Meier curves of gastric cancer patients with LN metastasis. Patients with low expression of GRIK3 always had a better prognosis than those with GRIK3 overexpression (p = 0.039).
Discussion
In this study, we reported that GRIK3, as a novel oncoprotein, was overexpressed in human GC tissue when compared with the normal tissue, and the overexpression of GRIK3 was associated with poor survival. In addition, we also found that the expression of GRIK3 in LN metastasis tissues was higher than in their corresponding primary GC tissues, and overexpression of GRIK3 indicated a poor prognosis in patients with LN metastasis.
In spite of the improvement of treatment methods including surgery, radiotherapy, and chemotherapy for GC, the prognosis is unsatisfactory and the mortality is still high. 19 Recently, researches have suggested that targeted molecular therapy and biological treatment could improve the prognosis of GC patients.19,20 For example, the application of human epidermal growth factor receptor-2 (HER2) monoclonal antibody (Trastuzumab) and vascular endothelial growth factor receptor 2 (VEGFR2) monoclonal antibody (Ramucirumab) are typical and accepted treatments for special type GC, which could improve the prognosis of GC patients. 21 Consequently, identifying the novel protein or gene alteration in GC is crucial to the diagnosis and therapy. 22
Glutamate receptors could mediate most of the excitatory neurotransmissions in mammalian central nervous system 23 and involve in the tumor growth and act as oncogenes in cellular transformation. 24 Over-secreting glutamate could promote inflammatory response and have growth advantage in glioma. 25 Glutamate receptor 1 could promote the transformation of epithelial cells during the development of renal cell carcinoma. 26 The GO analysis showed that GRIK3 was enriched in cellular homeostasis. Once the cellular homeostasis was broken, the cell would become sensitive resulting in aberrant growth, even carcinogenesis.27,28 KEGG analysis showed that GRIK3 participated in the neuroactive ligand–receptor interaction, which was closely related to colon cancer. 10 GRIK3 was considered to be a potential oncogene in tumor development and progression. Our study investigated that GRIK3 was overexpressed obviously in the GC tissues, and it was significantly associated with LN metastasis and TNM stage. Thus, GRIK3 was considered as a novel oncoprotein and was also an independent prognostic factor for GC patients.
GC patients have high risk of local-regional recurrence and distant metastasis even after curative surgical resection. It is reported that about 50%–75% of GC patients were accompanied with LN metastasis, which directly influence the prognosis of these patients.29,30 The metastatic LNs could be the source of distant organ metastasis and local-regional recurrence.31,32 Currently, preoperative assessment of LN status is mainly based on computed tomography (CT), magnetic resonance imaging (MRI), and positron emission tomography (PET), but imaging techniques is not reliable for predicting the LN metastasis.33,34 Thus, identifying an oncoprotein, which could be used to predict the LN metastasis of GC, will make contribution to establish the treatment methods.
Overexpression of the NMDAR1, a member of glutamate receptor family, was significantly correlated with LN metastasis in oral squamous cell carcinoma. 35 Our research revealed a significant association between GRIK3 expression and LN metastasis in GC. GRIK3 could promote GC cell metastasis to LNs and influence the prognosis of GC patients. Therefore, it might provide us a new method to improve the prognosis of GC patients by preventing the metastatic spread.
In conclusion, our study first reported that GRIK3 was a novel oncoprotein and significantly associated with TNM stage and LN metastasis. The elevated GRIK3 expression was significantly associated with poor survival outcomes. These new findings suggested that GRIK3 was a novel independent prognostic factor, LN metastasis predictive biomarker, and a novel potential target for GC therapy to improve the patients’ outcomes. However, the mechanism of GRIK3 in GC is still unknown and our future studies will mainly focus on the mechanism of GRIK3.
Footnotes
Acknowledgements
B.G. and Y.L. have contributed equally to this work.
Declaration of conflicting interests
The author(s) declared no potential conflicts of interest with respect to the research, authorship, and/or publication of this article.
Funding
The author(s) disclosed receipt of the following financial support for the research, authorship, and/or publication of this article: This study was supported by grants from the National Natural Science Foundation of China (81001092) and Natural Science Foundation of Liaoning Province (2013021097).
References
Supplementary Material
Please find the following supplemental material available below.
For Open Access articles published under a Creative Commons License, all supplemental material carries the same license as the article it is associated with.
For non-Open Access articles published, all supplemental material carries a non-exclusive license, and permission requests for re-use of supplemental material or any part of supplemental material shall be sent directly to the copyright owner as specified in the copyright notice associated with the article.