
Abstract
The study was designed to evaluate the potential use of insulin for cancer-specific treatment. Insulin-induced sensitivity of MCF-7 breast cancer cells to chemotherapeutic agents 5-fluorouracil and cyclophosphamide was evaluated. To investigate and establish the possible mechanisms of this phenomenon, we assessed cell proliferation, induction of apoptosis, activation of apoptotic and autophagic pathways, expression of glucose transporters 1 and 3, formation of reactive oxygen species, and wound-healing assay. Additionally, we reviewed the literature regarding theuse of insulin in cancer-specific treatment. We found that insulin increases the cytotoxic effect of 5-fluorouracil and cyclophosphamide in vitro up to two-fold. The effect was linked to enhancement of apoptosis, activation of apoptotic and autophagic pathways, and overexpression of glucose transporters 1 and 3 as well as inhibition of cell proliferation and motility. We propose a model for insulin-induced sensitization process. Insulin acts as a sensitizer of cancer cells to cytotoxic therapy through various mechanisms opening a possibility for metronomic insulin-based treatments.
Background
It is well established that malignancies exhibiting rapid growth and high-growth fraction are more susceptible to chemotherapeutic regimens than slow-growing, low-growth fraction malignancies.1,2 The potency of clinically known chemotherapeutic drugs depends upon disruption of metabolic pathways. The activity of one biochemical pathway determines the effectiveness of a particular cytotoxic agent. Therefore, it is desirable to alter the metabolic profile of a resistant tumor in such a way that it develops specific drug sensitivity. 3
Currently, almost 60% of all patients with early breast cancer receive chemotherapy but only a minority will benefit from it. 4 While different cytotoxic therapies are employed in the management of breast carcinoma, response rates are low, and acquired resistance is common. 5 The chemotherapeutic agents 5-fluorouracil (5FU) and cyclophosphamide (CPA) have been widely used in the clinic and incorporated in the treatment of several malignancies, that is, colorectal, gastric, pancreatic, breast, or head and neck cancer. However, drug resistance of malignant cells and systemic toxicity in the course of treatment are alarming causes of failure of chemotherapy.4–6 It is therefore desirable to explore novel therapeutic approaches, including adjuvant drugs that enhance cancer cell death resulting from standard therapies.
Insulin exhibits potent anabolic properties and has been implicated in many malignancies including breast cancer. 7 It is known to regulate carbohydrate and lipid metabolism, stimulate DNA synthesis, and modulate transcription. 8 Insulin has an impact on cellular uptake of various nutritional substances by facilitated diffusion. The uptake of materials such as glucose, amino acids, potassium, magnesium, and phosphate ions is vastly enhanced in its presence.9–11 Hence, insulin is known to be a modifier of the metabolism of cancer cells.
The study was designed to examine the effect of insulin on the sensitivity of breast cancer cell line MCF-7 to chemotherapeutic agents 5FU and CPA. To investigate and establish the possible mechanisms of this phenomenon, we assessed cell proliferation, induction of apoptosis, activation of apoptotic and autophagic pathways, expression of glucose transporters (GLUTs) 1 and 3, and formation of reactive oxygen species (ROS). Additionally, we reviewed the literature regarding the use of insulin in cancer-specific treatment.
Methods
Cell culture and experiment conditions
The human breast cancer cell line MCF-7, obtained from Leibniz Institute DSMZ—German Collection of Microorganisms and Cell Cultures, was cultured in Dulbecco’s Modified Eagle Medium/Nutrient Mixture F-12 (DMEM/F-12) supplemented with heat-inactivated 10% fetal bovine serum and 1% glutamine. Cells were incubated at 37°C in a 5% CO2 and 95% humidified atmosphere. When cells reached 80% confluence, they were digested with 0.25% trypsin for the following experiments. All cell culture reagents were purchased from Gibco, Invitrogen (Thermo Fisher Scientific Inc., Carlsbad, CA, USA).
Unless otherwise specified, MCF-7 cells were seeded at a density of 7 × 10³ per well in 96-well culture plates or 8 × 10⁴ per well in 6-well culture plates, and after 24 h of incubation for adherence, the cells were exposed to insulin (Insulin solution human; Sigma Aldrich, Schnelldorf, Germany) 40 µg/mL for 8 h and then treated for a further 72 h by 5FU or CPA (Sigma Aldrich) of different concentrations 1000, 500, and 100 µM and 4000, 2000, and 400 µg/mL, respectively. The drugs were freshly diluted to the final concentration in culture medium before experiment.
Cell viability and proliferation assay
The viability of MCF-7 cells following treatment was determined by the 3-(4,5-dimethylthiazol-2-yl)-2,5-diphenyltetrazolium bromide (MTT) reduction assay. MTT solution (Sigma Aldrich) was added to the wells on a 96-well plate to a final concentration of 0.5 mg/mL and incubated at 37°C for 4 h. Following incubation, the formazan crystals were solubilized with 100 µL dimethyl sulfoxide (DMSO; Sigma Aldrich) for 15 min. The optical absorbance (A) was measured at 490 nm using a BioTek ELX800 multi-well reader (BioTek, Winooski, VT, USA). The absorbance in the untreated control group was regarded as 100% cell viability. The percentage of viable cells (VC) was calculated according to the following formula: VC (%) = (A of experimental group/A of control group) × 100. All assays were carried out three times.
Immunocytochemistry
For the immunocytochemistry analysis, MCF-7 cells were seeded at 4 × 10⁴ cells per well in three-well chamber slides (Thermo Fisher Scientific Inc.). After treatment, cells were placed in 4% paraformaldehyde at 4°C for 10 min and then washed with phosphate-buffered saline (PBS; Sigma Aldrich). Immunocytochemistry was performed using the labeled streptavidin biotin (LSAB)+ method (LSAB+ System HRP from Dako, Glostrup, Denmark). Glass slides with cells were incubated with the endogenous peroxidase-blocking buffer and then were incubated with the protein-blocking buffer. Next, primary antibodies against examined proteins (anti-GLUT-1 and anti-GLUT-3; Santa Cruz Biotechnology, Inc., Heidelberg, Germany, dilution 1:25) were used, and slides were stored overnight at 4°C. The following day, the slides were washed with PBS and incubated for 1 h with a secondary anti-mouse-HRP antibody (dilution 1:100; Santa Cruz Biotechnology, Inc.). Then, the slides were rinsed twice with PBS and stained with 3,3′-diaminobenzidine in chromogen solution. Finally, cells were counterstained with Mayer’s hematoxylin and then dehydrated in graded alcohols, cleared in xylene, and mounted with xylene-based mounting medium. The negative control was obtained by omitting the first antibody. Photographs were taken by light microscope fitted with a digital camera (Nikon Eclipse 80i with camera DS-Fil-U2, Amsterdam, The Netherlands) at magnifications of 100× and 200×.
The immunostaining for GLUT-1 and GLUT-3 was reported according to the following standards (Table 1). For each glass slide, the immunoreactivity score (IRS) was calculated by multiplying the staining intensity value by percentage of stained cells. The final score of immunoreactivity ranged from 0 to 9. Three independent pathologists evaluated the glass slides in a blind manner using the light microscope at 100× magnification. Their validation was in agreement in the case of 65% of the slides. Any disagreements were discussed, and then, slides were classified to the most adequate category of IRS.
The immunoreactivity score (IRS) calculation method.

The final score was calculated by multiplying the staining intensity value by the percentage of staining.
Terminal deoxynucleotide transferased dUTP nick end labeling apoptosis assay
The ApopTag Peroxidase in Situ Apoptosis Detection Kit (Merck Millipore, Darmstadt, Germany) detects apoptotic cells in situ by labeling fragmented DNA by the Terminal Deoxynucleotide Transferase enzyme in terminal deoxynucleotide transferased dUTP nick end labeling (TUNEL) method. MCF-7 cells were seeded at 4 × 10⁴ cells per well in three-well chamber slides (Thermo Fisher Scientific Inc.). After treatment, the cells were assayed according to the manufacturer’s instructions. Briefly, cells were fixed in 1% formaldehyde in PBS 7.4 pH. After washed twice with PBS, cells were incubated with TdT enzyme at 37°C for 1 h. The slides were washed three times in PBS and incubated with anti-digoxigenin peroxidase conjugate in a humidified chamber for 30 min at room temperature (RT), followed by three rinses with PBS at RT. Then, slides were incubated with peroxidase substrate and after that counterstained with hematoxylin, dehydrated, and mounted in medium. To detect peroxidase-stained apoptotic bodies, bright-field microscopy was used. The number of TUNEL-positive cells was determined. The rate of TUNEL-positive cells (peroxidase-positive) was determined by dividing the number of TUNEL-positive cells by the total number of cells in the slides.
Flow cytometry analysis
Staining was performed using Annexin V-fluorescein isothiocyanate (FITC) Apoptosis Kit Plus (BioVision, Milpitas, CA, USA). Up to 5 × 10⁵ cells were resuspended in 500 µL of binding buffer and stained using 5 µL of FITC-conjugated Annexin V and 1 µL of SYTOX Green Dye. After 10 min of incubation in RT, cells were analyzed in cytometer.
Analysis was performed using BD FACS Calibur flow cytometer (FC) and BD CellQuest Pro Software (BD Biosciences, San Jose, CA, USA). With one exception, at least 12,000 total events were recorded from each tube. After gating cells on Forward Scatter (FSC)/Side Scatter (SSC) dot plot to remove debris from analysis, fluorescence detected in FL1 channel was analyzed on histograms. Populations showing weak to high (lower than dead cells peak) fluorescence were considered to represent apoptotic cells.
Western blot analysis
MCF-7 cells were plated at a density of 8 × 10⁴ per well in six-well culture plates. After treatment, cell supernatants were collected, and they were washed with PBS and centrifuged at 125g for 10 min. Cell pellets were lysed. Cells on plates were washed twice with pre-cooled PBS and, subsequently, were treated with lysis buffer (4% sodium dodecyl sulfate (SDS), 0.1 M dithiothreitol (DTT), in 0.1 M Tris–HCl buffer pH 7.6, 300 µL/well) containing protease and phosphatase inhibitors (1% cocktails; Sigma Aldrich). The both lysates were cleaned by centrifugation at 16,000g for 15 min. The supernatant was collected, and the protein concentration was measured at 280 nm using a spectrophotometer, PicoDrop 2000 (Thermo Fischer Scientific, Inc., Waltham, MA, USA). Total protein extracts were separated on 4%–12% SDS–polyacrylamide gel electrophoresis (SDS-PAGE; equipment from Invitrogen, Carlsbad, CA, USA), and transferred to the nitrocellulose (Amersham Hybond; Healthcare Bio-sciences AB, Uppsala, Sweden). The membrane was blocked with PBS containing 0.1% Tween 20 (Sigma Aldrich) with 10% goat serum (Sigma Aldrich) for 1 h at RT. Subsequently, the membrane was incubated overnight at 4°C with the first antibodies’ solution. The primary antibodies used in this study included anti-β-actin (dilution 1:500; Abcam, Cambridge, UK), anti-caspase 3 and anti-caspase 8 (dilution 1:500; Merck Millipore), anti-bax (dilution 1:100; Santa Cruz Biotechnology, Inc.), anti-atg 7 (dilution 1:100; Atlas Antibodies, Stockholm, Sweden), and anti-GLUT-1 and anti-GLUT-3 (dilution 1:25; Santa Cruz Biotechnology, Inc.). After washing twice with PBS, the membrane was incubated with horseradish peroxidase–labelled secondary anti-rabbit antibody (Santa Cruz Biotechnology, Inc., Santa Cruz, CA, USA) for 1 h at RT and thereafter washed three times with PBS. The final detection was performed with enhanced colorimetric western blotting visualization reagents using the DAB Enhanced Liquid Substrate System for Immunochemistry (Sigma Aldrich). The results were documented using appropriate Bio-Rad equipment (Molecular Imager Gel Doc TMXR+; Bio-Rad, Hercules, CA, USA). Loading differences were normalized by the usage of a monoclonal β-actin antibody against the housekeeping control β-actin.
ROS determination
ROS generation was measured using manufacturer’s instruction of 2′,7′-dichlorofluorescein diacetate (DCFDA) Cellular ROS Detection Assay Kit (Abcam). MCF-7 cells were seeded into 96-well plates and treated as described in Cell experiment conditions. After treatment, the cells were washed and stained with 25 µM DCFDA in a buffer for 45 min at 37°C. After washing once with a buffer, ROS generation was analyzed by fluorescent plate reader Experion using excitation/emission wavelengths of 485/535 nm, respectively (Bio-Rad).
Wound-healing assay
MCF-7 cells were grown in six-well plates until about 80%–90% confluency was reached at which point a 10 µL pipette tip was used to create a scratch/wound with clear edges across the width of a well. Wells were treated either with cell medium or were exposed to 200 µM 5FU or 4000 µg CPA, with or without 8 h of insulin sensitization (40 µg/mL). Photomicrographs were taken over a 48-h time period. A Nikon TS100 inverted microscope was used to measure and photograph the cell migration from the wound/scratch edge.
Statistical analysis
For all quantitative parameters, the conformity of their distribution with the normal distribution was checked. The conformity assessment was carried out by the Shapiro–Wilk test. The homogeneity of variance was tested with Bartlett’s test. The significance of differences in mean values (M) in more than two populations for parameters of normal distribution and homogeneous variances was assessed with analysis of variance (ANOVA). In case of rejection of the null hypothesis of homogeneity of variance, to verify the differences between the mean values in pairs, post hoc tests were performed (Scheffe’s test). The level p = 0.05 was assumed as the critical significance level. Data were expressed as mean ± standard deviation (M ± SD) and analyzed with the statistical program STATISTICA v.12 (StatSoft, Inc., Tulsa, OK, USA).
Results and discussion
Insulin potentiates the cytotoxic effect of 5FU and CPA
To identify the optimal concentration of insulin (INS) and the incubation hours for sensitizing effect, various doses of insulin and time of exposure were tested in the preliminary study [Supplementary Figure]. Our findings were consistent with the previous literature.12,13
In our study, 40 µg/mL of insulin alone for 8 h of incubation had no significant effect on cell growth (Figure 1(a) and (b)). A combination of 500 µM 5FU with previous insulin sensitization led to significant decrease of viability of MCF-7 compared with 500 µM 5FU alone. Evidently, 100 µM 5FU had an inhibitory effect only in the presence of insulin. However, 5FU alone at high concentration resulted in an effect similar to that in the presence of additional insulin. Combination of 4000 µg/mL CPA with INS produced a significant inhibition in viability when compared with CPA alone. Similarly, 2000 and 400 µg/mL CPA had inhibitory effect on MCF-7 cells only in the prior presence of INS.
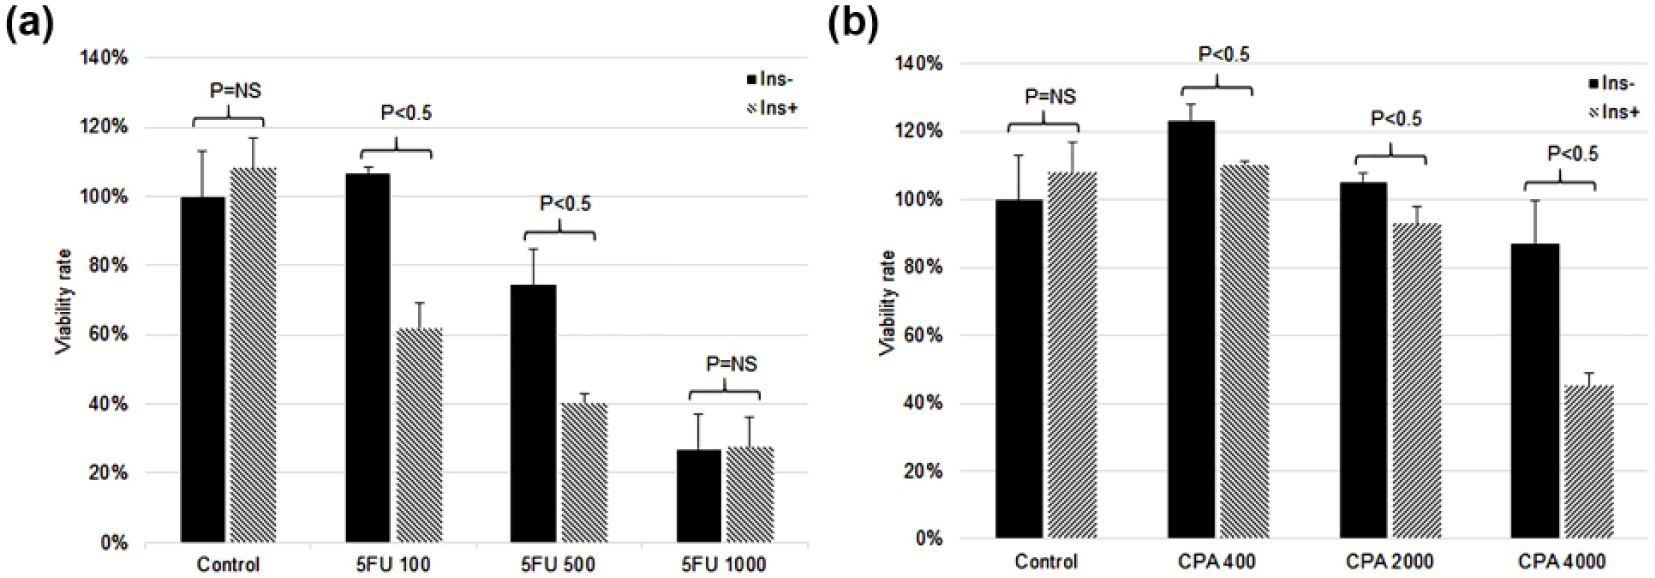
The inhibitory effect of insulin/5FU and insulin/CPA on the growth of MCF-7 cells. After insulin exposure (40 µg/mL) for 8 h, MCF-7 cells were treated with (a) 100, 500, and 1000 µM 5FU and (b) 400, 2000, and 4000 µg/mL CPA for 72 h. The inhibition rate was measured by MTT assay. The results are expressed as mean ± SD from triplicate experiments.
Insulin enhances apoptosis
We determined the apoptosis by FC analysis and TUNEL assay. In most tubes (with exception of 5FU-treated cells), dead cells could be differentiated from viable and apoptotic cells on the basis of FSC and SSC properties (Figure 2). Dead cells showed significantly lower FSC and slightly lower SSC values. In all samples treated with INS, including INS-treated control, a significantly higher apoptotic cell percentages and higher apoptosis/necrosis ratios were detected in comparison to samples treated without INS (Table 2). A high difference in apoptosis percentage was observed in CPA ± INS-treated samples, while the difference in samples treated with 5FU ± INS was comparable to control samples. Interestingly, in CPA-only treated sample, cell suspension was strikingly hypocellular and showed high percentage of necrosis, while in CPA + INS-treated sample, cell suspension cellularity was comparable to other samples and showed significantly higher apoptosis/necrosis ratio.

Original histogram plots presenting living, apoptotic, and dead cells, differentiated on the basis of their fluorescence after staining with Annexin V-FITC and SYTOX Green Dye. M1 marked events represent apoptotic cells (M2—living cells and M3—necrotic cells).
Apoptosis (%) and necrosis (%) of MCF-7 human breast cancer cells.

INS: insulin; CPA: cyclophosphamide; 5FU: 5-fluorouracil.
The number of TUNEL-positive cells was counted and presented as a percentage of apoptotic cells in relation to cells in the slide (Figure 3(a) and (b)). When tumor cells were treated with INS for 8 h followed by 5FU treatment, the apoptotic population increased significantly compared with 5FU treatment alone. Similarly, the ratio of apoptotic cells in insulin-pretreated cells in CPA group was significantly higher than in CPA alone.

Results of (a and b) TUNEL apoptosis detection assay, (c) ROS detection assay, and (d) western blot analysis in MCF-7 cell line. Cells were incubated with 40 µg/mL insulin for 8 h and then treated with 200 µM 5FU and 2000 µg CPA for 72 h. (a) and (b) Apoptosis was recognized due to an increased number of apoptotic bodies. The rate of TUNEL-positive cells (peroxidase-positive) was determined by dividing the number of TUNEL-positive cells by the total number of cells in the slides. TUNEL method is based on the ability of terminal deoxynucleotidyltransferase (TdT) to label blunt ends of double-stranded DNA breaks independent of a template. A brown color of peroxidase indicates TUNEL-positive apoptotic cell death through condensation of chromatin and cell blebbing. Peroxidase in situ TUNEL method, hematoxylin-counterstained (magnification 100×). (c) ROS generation assay. The results are expressed as mean ± SD from triplicate experiments. (d) Western blot analysis of apoptosis, autophagy-related proteins, and GLUT-1 and GLUT-3 proteins in MCF-7 cell line.
Insulin activates apoptotic and autophagic pathways
To examine possible molecular pathways affected by the treatment, we have assessed the presence of both apoptotic and autophagic proteins (Figure 3(d)). Cells treated with 5FU as well as CPA presented higher expression of proapoptotic Bax protein compared with the control group or cells treated with insulin only. More interestingly, combination of 5FU with insulin resulted in higher protein expression of caspase 8 in comparison with 5FU-only group. Comparable effect was observed for the cells treated with both CPA and insulin, which presented higher expression of caspase 3, placed downstream of the apoptotic pathway. Autophagy-related protein 7, Atg-7, was detected in higher levels in cells treated with drug/insulin combination, a result that can be connected to the increase in cells undergoing apoptosis.
Insulin-induced expression of GLUT-1 and GLUT-3
The impact of insulin on GLUT-1 and GLUT-3 protein expression was analyzed by immunocytochemistry. The tumor cells were exposed to insulin at 40 µg/mL for 8 h and then treated with 5FU at 200 µM or CPA at 2000 µg/mL for 48 h. The results showed that treatment with insulin caused an elevated expression of GLUT-1 and GLUT-3 proteins when compared with the control. Comparing to the insulin alone, the combinations of 5FU with insulin, or CPA with insulin, produced similar effects (Figure 4). The findings were confirmed in western blot analysis.
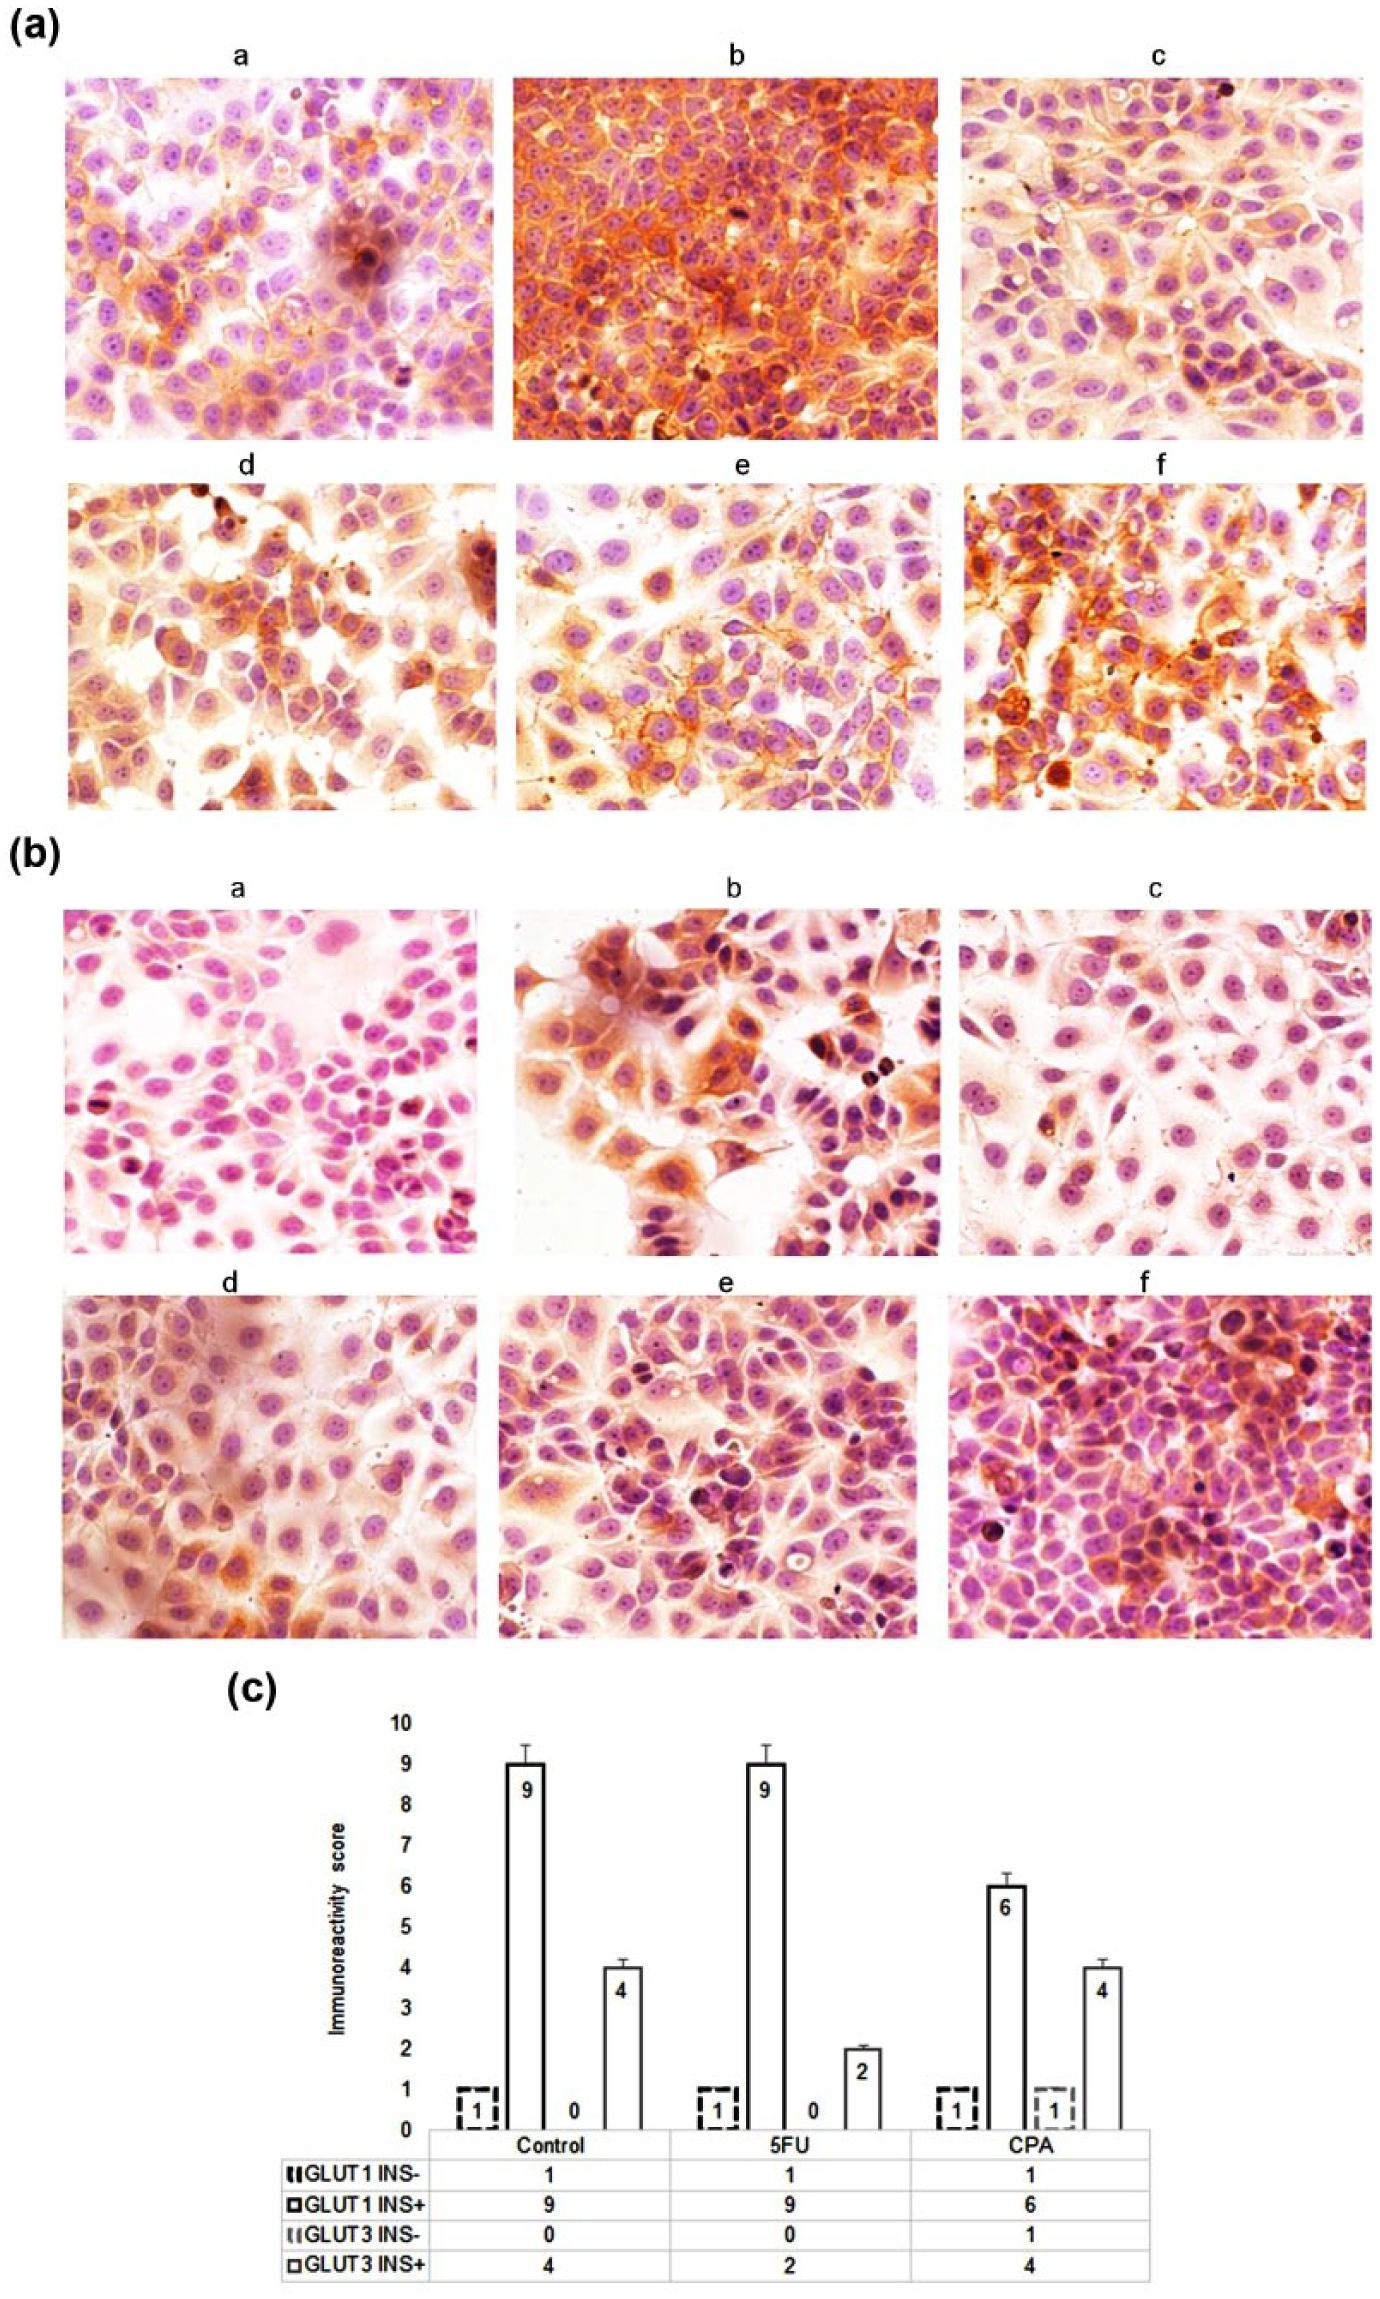
Immunostaining results of (A) GLUT-1 and (B) GLUT-3 protein expression in MCF-7 cell line. DAB method, hematoxylin-counterstained; magnification 100×. Cells were exposed to 200 µM fluorouracil or 2000 µg cyclophosphamide for 72 h, with or without 8 h of insulin sensitization (40 µg/mL). (a) Control, (b) insulin, (c) 5FU, (d) INS/5FU, (e) CPA, and (f) INS/CPA. (C) Immunoreactivity score (IRS) of the anti-GLUT-1 and anti-GLUT-3 immunostaining. The IRS calculation method is presented in Table 1.
Insulin pretreatment inhibits cell proliferation and cell motility
To further examine how insulin pretreatment affected cell proliferation along with cell motility, “wound-healing” assays were performed. The results indicated that control- and INS-treated MCF-7 cells nearly completely filled the “wound” by 48 h (Figure 5). In stark contrast, combination of 4000 µg CPA as well as 200 µM 5FU with INS slightly hindered the motility/proliferation of these cells comparing to CPA or 5FU alone. These results are a further indication that combination of CPA and 5FU with INS impairs ability of breast cancer cell proliferation and motility.
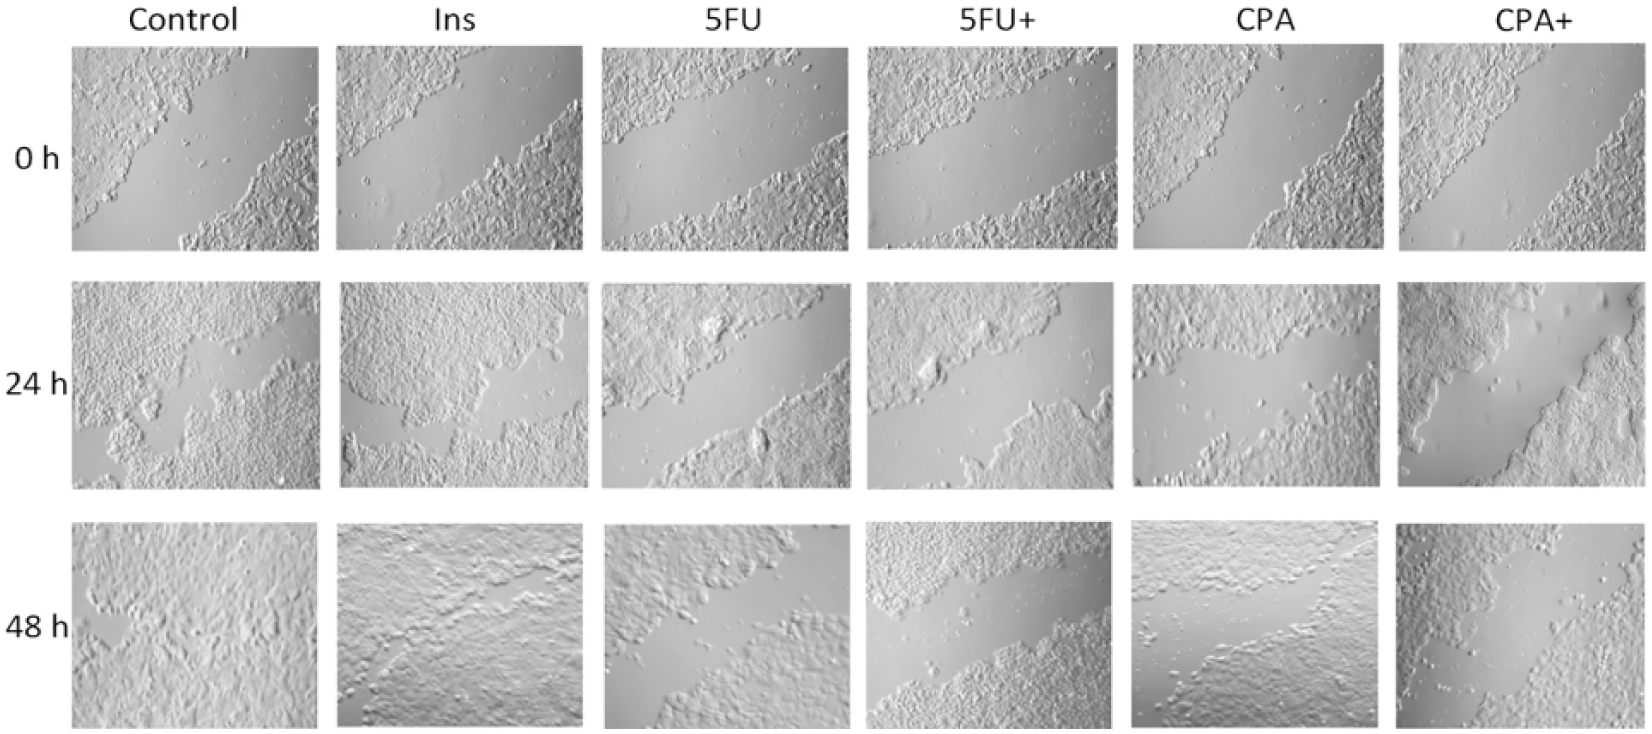
In vitro wound-healing/scratch assay. Photomicrographs were obtained at the indicated time points using a 10× objective on a Nikon eclipse TS100 inverted microscope and recorded using NIS-Elements F 3.2 software.
ROS formation
To establish the effect of combined insulin/5FU or insulin/CPA on the intracellular redox status, we determined the intracellular ROS formation. We observed that 5FU-treated cells exhibited decreased ROS formation. The addition of insulin to 5FU did not influence ROS generation. Conversely, CPA-treated cells significantly enhanced ROS generation. Insulin-/CPA-treated cells exhibited decreased levels of ROS compared with CPA-treated alone group (Figure 3(c)).
Novel application of insulin
The use of insulin as an adjunct in the management of malignant neoplasia was proposed by Ayre et al. 14 over 30 years ago. It was suggested that insulin could increase membrane permeability of cancer cells, which leads to an increased uptake of cytotoxic agents. It was hypothesized that insulin-induced hypoglycemia causes stress to cancer tissue and allows selective endocytosis of metabolic agents even in low doses.
Although the role of insulin in cancer therapy is not fully understood, there are studies reporting its novel application. In a clinical trial conducted by Lasalvia-Prisco et al., 12 it was reported that combination of methotrexate and insulin produced a significantly better clinical outcome in patients with multidrug-resistant metastatic breast cancer, compared to patients treated with methotrexate or insulin alone. In vitro studies12–15 found that activity of various chemotherapeutic agents, such as paclitaxel, 5FU, cisplatin, or methotrexate, can be considerably enhanced in the presence of insulin. It was also reported in a small-scale clinical trial that insulin improves the outcome of hormone therapy in castration-resistant prostate cancer. 16
Impact on cell proliferation, apoptosis, and autophagy
In this study, we were focused on the effects of insulin on the activity of 5FU and CPA and the underlying mechanisms. Our findings indicate that insulin can significantly raise the susceptibility of MCF-7 human breast cancer cells to 5FU and CPA. It was observed that insulin increases the cytotoxic effect of 5FU and CPA in vitro up to two-fold. These findings are consistent with the results from previous studies.12–15 It is well established that resistance to apoptosis leads to uncontrolled proliferation, resulting in tumor survival, therapeutic resistance, and recurrence of cancer. 17 Induction of apoptosis plays an important role in enhancing the activity and function of cytotoxic agents. In our study, combination of insulin/5FU and insulin/CPA produced increase in apoptosis rate compared with 5FU or CPA alone. Evidently, when the exposure of cancer cells to insulin is optimal, the ratio of cells sensitive to 5FU and CPA significantly raises. Results of our research indicate that not only does insulin promote apoptosis when followed by anticancer drugs but also the mechanism of this phenomenon may be linked to autophagy, which has been proved to correlate with cell death or survival. Previous research showed that depending on the context, autophagy can serve as a destructive or protective factor in tumor cells. 18 The increase in autophagy observed in our work may promote apoptosis due to degrading various crucial cellular factors. 19 Another suggested mechanism of enhancing cell death via autophagy relies on its energetic effect, which provides adenosine triphosphate (ATP) needed to undergo apoptosis. 20 Experiments using metformin on breast cancer prove that insulin causes an increase in caspase-3 expression, which is a result of cells entering the apoptotic pathway. 21
Role of GLUT-1 and GLUT-3
Cancer cells depend on glucose metabolism for energy production. Glucose uptake across the plasma membrane is considered the rate-limiting step for glucose metabolism. The facilitative GLUT family mediates a bidirectional and energy-independent process of glucose transport in most tissues and cells. Elevated expression of GLUTs has been reported in the majority of malignancies.2,22 GLUT-1 is an isoform that exhibits a high affinity for glucose and can also transport galactose, mannose, glucosamine, and docosahexaenoic acid (DHA). 23 It is responsible for basal glucose uptake and is expressed in all tissues under normal conditions. Overexpression of GLUT-1 has been reported in a number of malignancies including lung, brain, breast, bladder, cervical, colorectal, esophageal, hepatocellular, head and neck, gastric, ovarian, renal cell, pancreatic, thyroid, penile, and uterine cancers.24–26 While it is well established that most cancer types overexpress GLUT-1, previous research has documented mixed evidence for the expression of GLUT-1 in breast cancer varying from 40% to 90%.27–29 Similarly, GLUT-3 is a high-affinity GLUT that can also transport galactose, mannose, maltose, xylose, and DHA. 23 It is detected mainly in the central nervous system; hence, it is considered to be a neuron-specific GLUT. The expression of GLUT-3 in breast cancer is not well understood, with some studies showing higher GLUT-3 expression in poorly versus well-differentiated breast tumors. 30 In our study, we examined the impact of insulin on expression of GLUT-1 and GLUT-3. We found that insulin enhances significantly the expression of these transporters. These findings can be explained through the phosphatidylinositol 3-kinase (PI3K)–Akt pathway. Akt, a serine/threonine kinase downstream of PI3K, is shown to induce the expression of GLUT-1 and GLUT-3 in cancer cells, leading to stimulation of glucose transport and higher metabolic activity. 31 The activity of PI3K pathway is known to induce the metabolic processes regulating growth. 32 We hypothesize that activation of this pathway followed by consecutive cytotoxic treatment can be responsible for higher susceptibility of cancer cells to chemotherapeutic agents.
Formation of ROS
In malignant cells, elevated levels of ROS depend on a variety of processes including the following: increased metabolic activity, mitochondrial dysfunction, peroxisome activity, increased cellular receptor signaling, and oncogene activity.33,34 The link between ROS and insulin signaling is known but not fully understood.35,36 It is known that ROS enhances sensitivity to insulin. 37 In a tumor microenvironment, the cells respond to insulin stimulation in a more evident manner. In our study, we hypothesized that insulin may enhance the formation of ROS by cytotoxic agents. We found that combined INS/5FU produced similar effects to 5FU alone, whereas INS/CPA resulted in a decrease in ROS generation comparing with CPA alone, which can partially be explained by its increased cytotoxicity. It is therefore suggested that insulin does not play a pivotal role in the generation of ROS when combined with 5FU or CPA.
Insulin receptors and drug uptake
Membrane receptors for insulin (type 1 insulin-like growth factor receptor (IGF-1R), insulin receptor (IR)-A, IR-B, and their hybrids) play an important role in the regulation of metabolism in both malignant and non-malignant cells. The downstream effects of activation of insulin membrane receptors involve glucose uptake, glycogen synthesis, protein synthesis, cell survival, and transcription. It is well established that IR, IGF-1R, and their hybrids exhibit overexpression in many malignancies including breast cancer.3,38 Therefore, it is assumed that cancer cells exhibit a more potent response to insulin stimulation. The cellular permeability to chemotherapeutic agents can be enhanced via a process known as insulin-mediated endocytosis.39,40 This specific process enables cells to take up small and large molecular ligands, such as hormones, growth factors, enzymes, and plasma proteins.
It is suggested that through combined therapy of insulin and cytotoxic agents, the latter can accumulate intracellularly in a more significant manner. The findings of Zou et al. 16 confirm this assumption, as the uptake of 5FU was enhanced in the presence of insulin.
Insulin-induced sensitization of malignancies to chemotherapy
We propose a model for insulin-induced sensitization process (Figure 6). Exogenous insulin binds to an IR or an insulin growth factor receptor (IGFR), leading to activation of the mitogen-activated protein kinase (MAPK) and the PI3K signaling pathways. This results in stimulation of various intracellular processes including cell growth, gene expression; synthesis of lipids, proteins, and glycogen; and increase in S-phase cells. Consecutive administration of cytotoxic agents causes a higher intracellular accumulation due to mechanisms such as insulin-mediated endocytosis and insulin-induced alteration of membrane permeability. Activation of various metabolic and mitogenic pathways raises the susceptibility of a tumor, which in the presence of high intracellular drug concentration results in increased cytotoxicity and apoptosis.

Insulin-induced sensitization of cancer cell to chemotherapeutic agent. Exogenous insulin binds to insulin receptor (IR) or insulin growth factor receptor (IGFR), leading to the activation of the mitogen-activated protein (MAP) kinase and the phosphatidylinositol-3-kinase (PI3K) signaling pathways. This results in the stimulation of various intracellular processes including cell growth; gene expression; synthesis of lipids, proteins, and glycogen; increase in S-phase cells; and altered cell membrane permeability. Consecutive administration of cytotoxic agents can lead to higher intracellular accumulation due to processes such as insulin-mediated endocytosis and insulin-induced alteration of membrane permeability. Activation of various metabolic and mitogenic pathways raises the susceptibility of cancer cell, which in the presence of high intracellular drug concentration results in increased cytotoxicity, apoptosis, and the enhancement of therapeutic effect.
Conclusion
Our findings support the use of insulin as a cell sensitizing agent. We conclude that insulin can enhance the effects of cytotoxic therapy through suggested mechanisms including MAPK and PI3K pathways. The cellular processes involved in this phenomenon need further study. The concept of treating tumors by prior sensitization opens a possibility for metronomic insulin-based treatments.
Footnotes
Acknowledgements
The authors acknowledge Wroclaw Medical University funding. They also thank Prof. Andrzej Gamian for thoughtful discussions during the course of this study.
Authors’ contributions
S.A., M.W., and M.L. participated in study design and coordination, carried out the molecular studies and immunoassay, and prepared draft of the manuscript; E.P., K.W., and K.Z. carried out flow cytometry and western blot analysis; and P.Z. participated in the design of the study and coordination. All authors read and approved the final manuscript
Consent for publication
Not applicable
Ethics approval and consent to participate
Not applicable
Declaration of conflicting interests
The author(s) declared no potential conflicts of interest with respect to the research, authorship, and/or publication of this article.
Funding
The author(s) disclosed receipt of the following financial support for the research, authorship, and/or publication of this article: This research was supported by Wroclaw Medical University.
References
Supplementary Material
Please find the following supplemental material available below.
For Open Access articles published under a Creative Commons License, all supplemental material carries the same license as the article it is associated with.
For non-Open Access articles published, all supplemental material carries a non-exclusive license, and permission requests for re-use of supplemental material or any part of supplemental material shall be sent directly to the copyright owner as specified in the copyright notice associated with the article.