
Abstract
This study aims to explore the heterogeneous DNA methylation differences between individual single ovarian cancer cells isolated from the same formalin-fixed and paraffin-embedded human ovarian cancer tissue. Single cells were isolated by laser microdissection. Whole genome amplification and polymerase chain reaction purification were performed on the converted genomic DNA. Target primers designed for checking DNA methylation were used in polymerase chain reaction reactions to amplify special fragments. Sequencing was performed to analyze the heterogeneous DNA methylation statuses of different single ovarian cancer cells. Three of nine single human ovarian cancer cells showed positive bands (33.3%) on separating gel. The methylated and unmethylated CpGs were shown at the same loci in different single cells. We show heterogeneous DNA methylation statuses in same-cell subpopulations.
Introduction
DNA methylation is critical for normal tissue development,1–3 but also plays an important role in many pathological processes including cancer.4,5 In recent years, the research field of DNA methylation has become one of the most dynamic and fast-growing branches of molecular biology. The number of diseases suspected to be influenced by DNA methylation is increasing rapidly. Epigenetic status is very important in transcriptional gene regulation and is potentially heterogeneous even within a relatively homogeneous cell type, due to different cell subpopulations present.6–8 This is especially obvious in tumors, in which both the genomes and epigenomes of the single cells are heterogeneous.9,10 However, our knowledge remains limited on the genome-wide distribution of DNA methylation, how it changes during cellular differentiation, and how it relates to histone methylation and other chromatin modifications in humans. 11 We still do not know whether the DNA methylation statuses of different cells in same-cell subpopulations are the same.
Heterogeneity among cells in a population, even when they are genetically identical, arises due to the stochastic nature of intercellular biochemical reactions. Such variability has very important roles in mammalian cells, such as affecting the latency period of virus replication,12,13 T-cell activation, 14 the outcome of stem-cell differentiation, 15 and the tolerance of cancer cells to chemotherapy. 16 Due to cellular heterogeneity of methylation patterns, epigenetic analyses of a single cell are necessary. One rationale is that DNA methylation profiles are highly variable across individual cells, even in the same organ, depending on the function of the gene,17,18 disease state,19,20 exposure to environmental factors,21,22 stochastic fluctuations, 23 and various other causes. 24 It is very important, therefore, to verify the DNA methylation statuses of a single cell.
Generally speaking, there are three possible sources of single cell: cell culture, fresh frozen tissue, and formalin-fixed and paraffin-embedded (FFPE) tissue. Cell culture affects the maintenance of the differential parent-of-origin-specific intergenic differentially methylated regions, and the defects seem to progress over time or may be amplified by cell immortalization by Epstein–Barr virus. 25 However, researchers have found high correlations in the DNA methylation measurements between FFPE and fresh frozen tissue when analyzing matched tissue pairs obtained from same tumors. 26 Given that fresh frozen and FFPE samples not only differed in preparation techniques but were also subject to heterogeneity within each tumor, Harbeck et al. 26 found this high correlation adequate to exclude systematic differences in DNA methylation measurements between fresh frozen and FFPE specimens. Moreover, FFPE human tissue samples represent a large number of resources for molecular analyses and retrospective clinical studies. We must recognize the value of these samples and the potential they have to contribute to epigenetic studies and understanding the role of DNA methylation in numerous biological processes and diseases, including cancers. Although the number of epigenetic cancer studies continues to grow, the wealth of FFPE samples available remains largely untapped. Therefore, we choose FFPE tissue as our source for performing single-cell methylation analysis.
Nowadays, in the technology development field of epigenetics, some investigators are working to refine capture protocols to reduce sample input requirements and enhance multiplexing capabilities, while others intend to refine detection to single-cell and single-molecule resolution. We developed a direct, high-resolution method to analyze DNA methylation that involves the treatment of genomic DNA from single cells isolated from FFPE ovarian cancer tissue with sodium bisulfite followed by sequencing. We find heterogeneous DNA methylation statuses of different single ovarian cancer cells. Differentially methylated sites were found at the same CpG loci in different single cells of the same ovarian epithelial cancer tissue sample. Using this method, we may be able to understand the epigenome of a single cell.
Material and methods
Patient and sample collection
The patient received the operation in June 2010 in the Obstetrics and Gynecology Department of The First Affiliated Hospital of Xi’an Jiaotong University, with a clinical diagnosis of ovarian cancer FIGO stage IIIC and a pathologic diagnosis of ovarian serous papillary carcinoma, mediate differentiated. 27 FFPE samples were collected from the patient’s tumor. This study was approved by the Institutional Review Board (IRB) in Xi’an Jiaotong University, and written informed consent was obtained from the patient prior to surgery.
Hematoxylin–eosin staining
For all analyses, 10-µm-thick sections were used. Sections were mounted on membrane-covered slides (Leica Microsystems, Wetzlar, Germany). The paraffin was removed prior to staining the paraffin-embedded sections. This was achieved by washing the slides with xylene, followed by a series of descending concentrations of ethanol as follows: 3× xylene for 20 s (three separate containers), 2× 100% ethanol for 30 s (two separate containers), 2× 95% ethanol for 30 s, 2× 70% ethanol for 30 s, distilled H2O for 30 s, hematoxylin for 10 s, H2O for 1 min, eosin solution for 10 s, distilled H2O for 1 min, 70% ethanol for 30 s, and 95% ethanol for 30 s, air-dried at room temperature.
Laser microdissection
After hematoxylin–eosin (H&E) staining, a three-step dissection strategy was performed using a laser capture microdissection microscope (Leica AS LMD 7000; Leica Microsystems) with a pulsed 337 nm ultraviolet (UV) laser. The single cell was captured among human ovarian cancer cells. The cancer cell was collected into a single tube (EU thin-wall tube with cap 0.2 mL; Biologix Plastics, Jiangsu, China) filled with 20 µL DNAse/RNAse-free water (75-0024; Invitrogen, Carlsbad, CA, USA). The tube was centrifuged at full speed (>10,000×g) for 5 min, and 11 µL of water was pipetted off the top. All experiments were carried out in duplicate.
Genomic DNA bisulfite conversion
The EZ DNA Methylation-Direct™ Kit (D5021; Zymo Research Corp., Irvine, CA, USA) was used to perform bisulfite conversion on single cells; 10 µL M-Digestion Buffer and 1 µL Proteinase K were added to 9 µL of sample for digestion. The sample was incubated for 4 h at 50°C; 20 µL of the digested sample was then added to 130 µL of CT Conversion Reagent solution in a polymerase chain reaction (PCR) tube (D5003-1; ZYMO RESEARCH CORP., Irvine, CA, USA). The sample was mixed and centrifuged briefly to ensure that no droplets were in the cap or on the sides of the tube. The PCR tube was placed in a thermal cycler and the following steps were performed: 98°C for 8 min, 64°C for 7 h (we increased the conversion time from 3.5 h in protocol to 7 h in order to obtain better conversion rate), and stored at 4°C for up to 20 h. A volume of 600 µL of M-Binding Buffer was added into a Zymo-Spin IC Column, and the column was placed into a collection tube. The sample was loaded into the Zymo-Spin IC Column containing the M-Binding Buffer. The cap was closed and the sample was mixed by inverting the column several times and then centrifuged at full speed (>10,000×g) for 30 s. The flow-through was discarded. A volume of 200 µL of M-Desulphonation Buffer was added to the column and incubated at room temperature (20°C–30°C) for 15–20 min. After incubation, the sample was centrifuged at full speed for 30 s. A volume of 200 µL of M-Wash Buffer was added to the column and centrifuged at full speed for 30 s. Another 200 µL of M-Wash Buffer was added and centrifuged for an additional 30 s. The column was placed into a 1.5-mL microcentrifuge tube, and 10 µL of M-Elution Buffer was added directly into the column matrix. This was centrifuged for 30 s at full speed to elute the DNA.
Whole genome amplification of bisulfite-converted DNA
Whole genomic amplification of bisulfite-converted DNA was performed using the EpiTect Whole Bisulfitome Kit (1052668; Qiagen, Redwood City, CA, USA). Bisulfite-converted template DNA was placed into a microcentrifuge tube. The volume was adjusted to 10 µL using nuclease-free water. REPLI-g Midi DNA polymerase was thawed on ice. All other components were thawed at room temperature, vortexed, and then centrifuged briefly. An EpiTect Amplification Master Mix was prepared on ice using 29 µL EpiTect WGA Reaction Buffer and 1 µL REPLI-g Midi DNA polymerase. An amount of 30 µL of EpiTect Amplification Master Mix was added to 10 µL of bisulfite-converted DNA. The solution was incubated at 28°C for 8 h. REPLI-g Midi DNA Polymerase was inactivated by heating the sample for 5 min at 95°C. The amplified DNA was stored at 4°C for short-term storage or −20°C for long-term storage.
Purification of amplified bisulfite-converted genomic DNA
Purification of PCR products was completed using the QIAquick PCR Purification Kit (28106; Qiagen); 5 volumes of Buffer PB (19066; Qiagen) was added to 1 volume of the PCR sample and mixed. A QIA spin column was placed into a 2-mL collection tube. To bind DNA, the sample was applied to the QIAquick column and centrifuged for 30–60 s. The flow-through was discarded, and the QIAquick column was placed back into the same tube. A volume of 0.75 mL of Buffer PE (19065; Qiagen) was added to the QIAquick column and centrifuged for 30–60 s to wash. The flow-through was discarded, and the QIAquick column was placed back in the same tube. The column was centrifuged for an additional 1 min at maximum speed and the QIAquick column was placed in a clean 1.5 mL microcentrifuge tube. To elute DNA, 50 µL H2O was added to the center of the QIAquick membrane and the column was centrifuged for 1 min. DNA concentrations were measured using the Nanodrop (Thermo Fisher Scientific, Waltham, MA, USA).
DNA methylation measurement
Targeted primers were designed on several different chromosomes using the online MethPrimer software (www.urogene.org/methprimer/index.html). The PCR primer information is listed in Table 1. These primers were designed to recognize regions that lack CpG sites in order to avoid any amplification bias that may have occurred due to the differences between methylated and unmethylated sequences. PCR was performed in a 20-µL reaction tube, containing 5 ng of converted DNA, 5 µM of each primer, 4 mM deoxynucleotide triphosphate (dNTP), 2 µL of 10× PCR buffer, and 1 unit of Taq polymerase. Amplification was performed for 50 cycles using a GeneAmp PCR System 9600 (PE Applied Biosystems, Foster City, CA, USA). PCR products were then visualized on 1% agarose gels after ethidium bromide staining.
Primers for bisulfite PCR.

Sequence analyses
The purified DNA was used as templates for sequencing PCR in the BigDye Terminator Cycle Sequencing Ready Reaction Kit (Applied Biosystems, Foster City, CA, USA). Samples were analyzed on the automated sequencer (ABI PRISM 3100 Genetic Analyzer; Applied Biosystems) using GeneScan 3.7 software (Applied Biosystems). Products were sequenced from both strands to get consensus sequences. The reaction tubes were placed in a thermal cycler (PE 2700; Applied Biosystems) with the volume set to 20 µL. The samples were preheated to 96°C for 1 min, followed by 35 cycles with the following parameters: 96°C for 10 s, 50°C for 5 s, and 60°C for 4 min.
Results
Overview of single-cell DNA methylation
The optimized workflow for DNA methylation analyses of microdissected single cells from FFPE ovarian cancer tissue is summarized in Figure 1. The workflow consists of the steps described in the “Materials and methods” section. Briefly, the genomic DNA methylation analysis of single cells begins with FFPE ovarian cancer tissues. A 10-µm section was made and H&E staining was performed on the section. Malignant epithelium was found lining the cyst and on the surface of the many papillary growths and extensions and stromal invasions. The larger papillary projections had a “detached” and free floating appearance. The cancer cells lost nuclear polarity, and marked nuclear pleomorphism, hyperchromasia, and chromatin clumping were present. A single ovarian cancer cell was captured using LMD and put into a lysis buffer to expose genomic DNA. Genomic DNA was bisulfite-converted using the EZ DNA Methylation-Direct Kit. Whole genome amplification (WGA) of bisulfite-converted DNA was performed using the Qiagen EpiTect Whole Bisulfitome Kit. After PCR purification, target genomic fragments were amplified with specially designed primers. The resulting sequence was tested for analysis of methylation.

Diagram of methylation measurement of single ovarian cancer cells.
Quantity of purified DNA after WGA
We used the technique of WGA according to Arasaradnam et al. 21 First, we aimed to verify that DNA methylation measurements could be reliably obtained from routinely prepared FFPE ovarian cancer tissues. For this purpose, nine single ovarian cancer cells were dissected using LMD. After bisulfite conversion and WGA and purification, the concentration of genomic DNA from single cells was quantified by UV spectrophotometry using a NanoDrop ND-1000 Spectrophotometer (Nanodrop Technologies, Wilmington, DE, USA). We observed a high correlation of repeated measurements of DNA isolated from the same tissue preparation, indicating that converted DNA could be reproducibly assessed from a single cell using FFPE ovarian cancer tissue specimens.
Result of gel separation
We obtained nine single ovarian cancer cells from one patient. After using the 12 sets of primers randomly designed in human genome listed in Table 1, we amplified targeted fragments on different chromosomes. Only three sets showed positive bands (25%). For each primer set, only two to four of the nine single cells showed positive amplification of target fragments, accounting for 22.2%–44.4%. For example, primers mCNotch49F and mCNotch500R were designed from loci 15322909 to loci 15323382 on chromosome 19. The cloning fragment length was 474 bp. The single cell a, b, and c of nine single ovarian cancer cells showed positive bands (33.3%) on separating gel.
DNA methylation comparison between different cells
The sequences of genomic-converted DNA with positive bands during gel separation were tested for conversion efficiency. The conversion rate (i.e. percentage of modified DNA) 28 was 99.9%. For example, as shown in Figure 2, one patient showed methylated and unmethylated CpGs in different single ovarian cancer cells at the same loci of human chromosome 19. Figure 3 and Figure 4(a) provide other examples of chromosome 19 and chromosome 1. Heterozygous amplification was also found at loci 9 and 10 as shown in Figure 4(b).
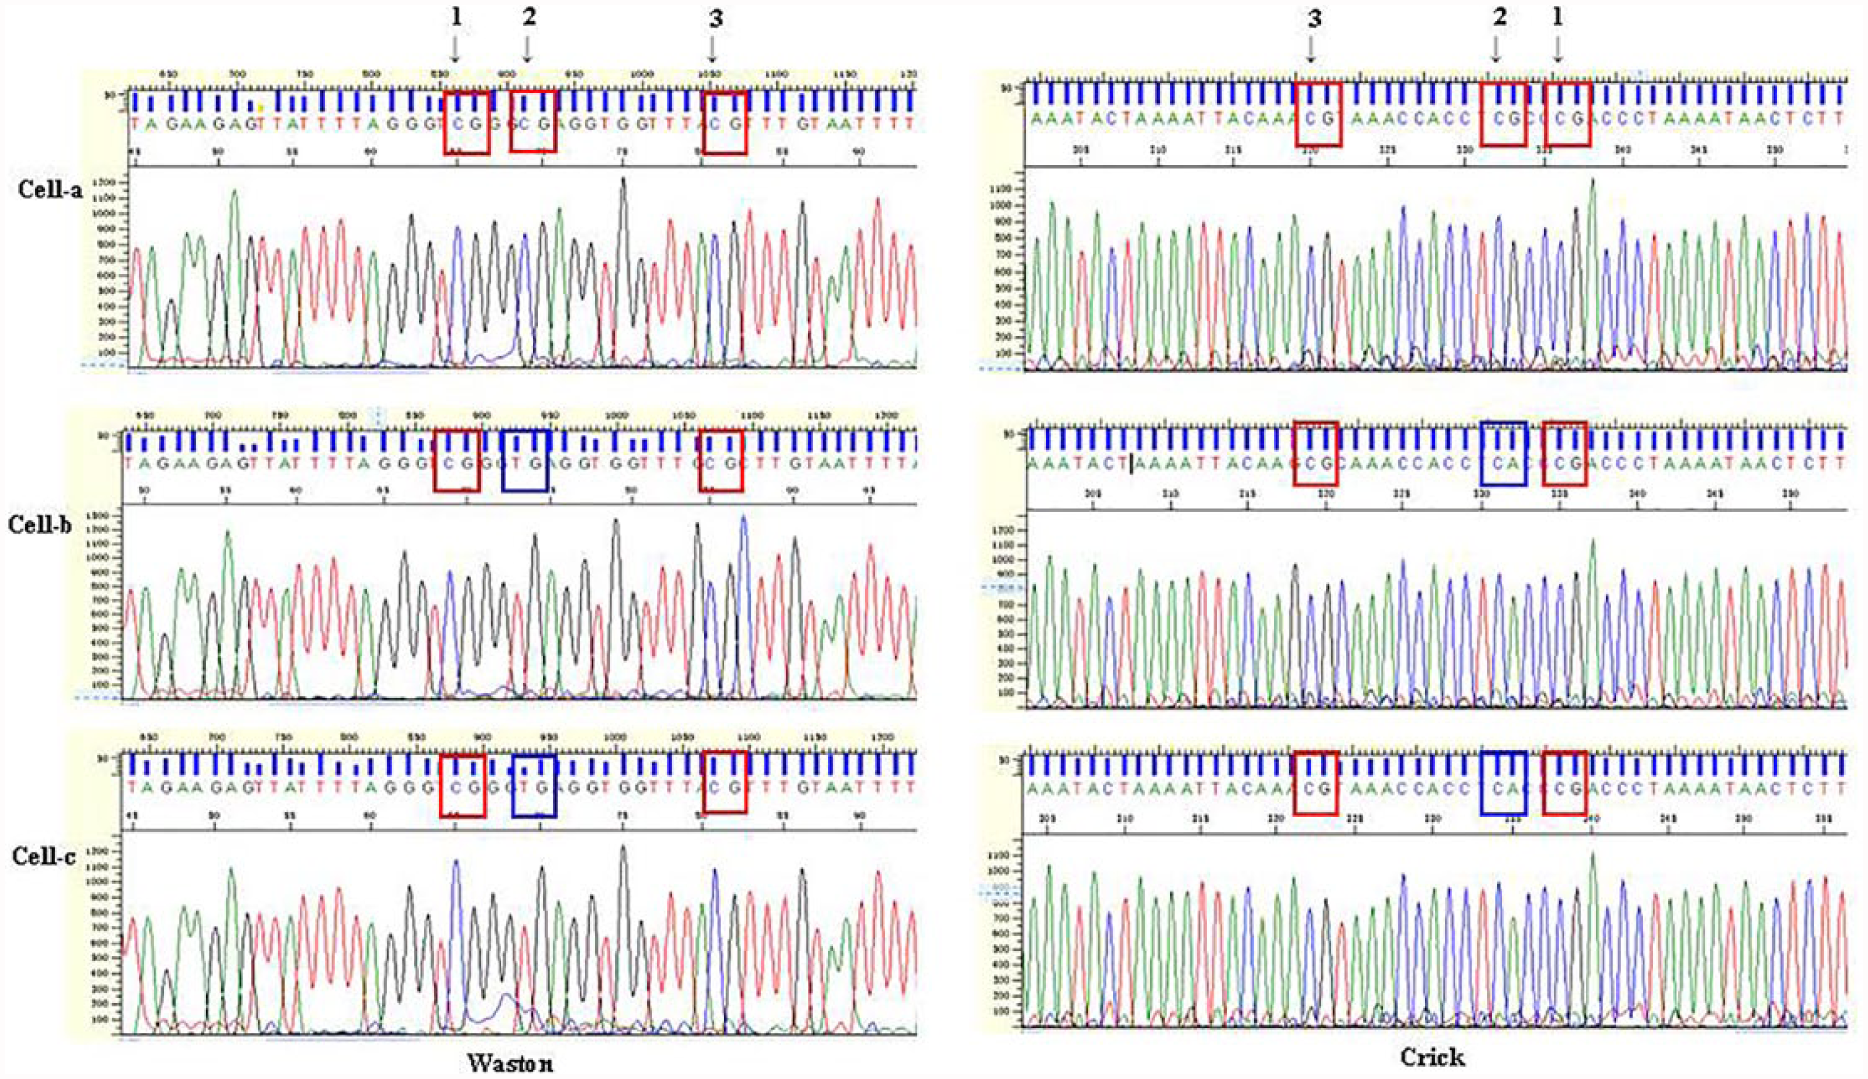
Different methylations happened on human chromosome 19 at different single cells. With targeted bisulfite primers of specific loci, sequencing was checked of single-cell a, b, and c. The conversion rate was 99.9%. At loci 1 and 3, methylation was showed among single ovarian cancer cell a, b, and c, that is, it showed “CG.” At locus 2, only cell a was methylated; in cells-b and c, this locus was not methylated. X axis represented sequencing position and Y axis represented signal intensity in every chart.
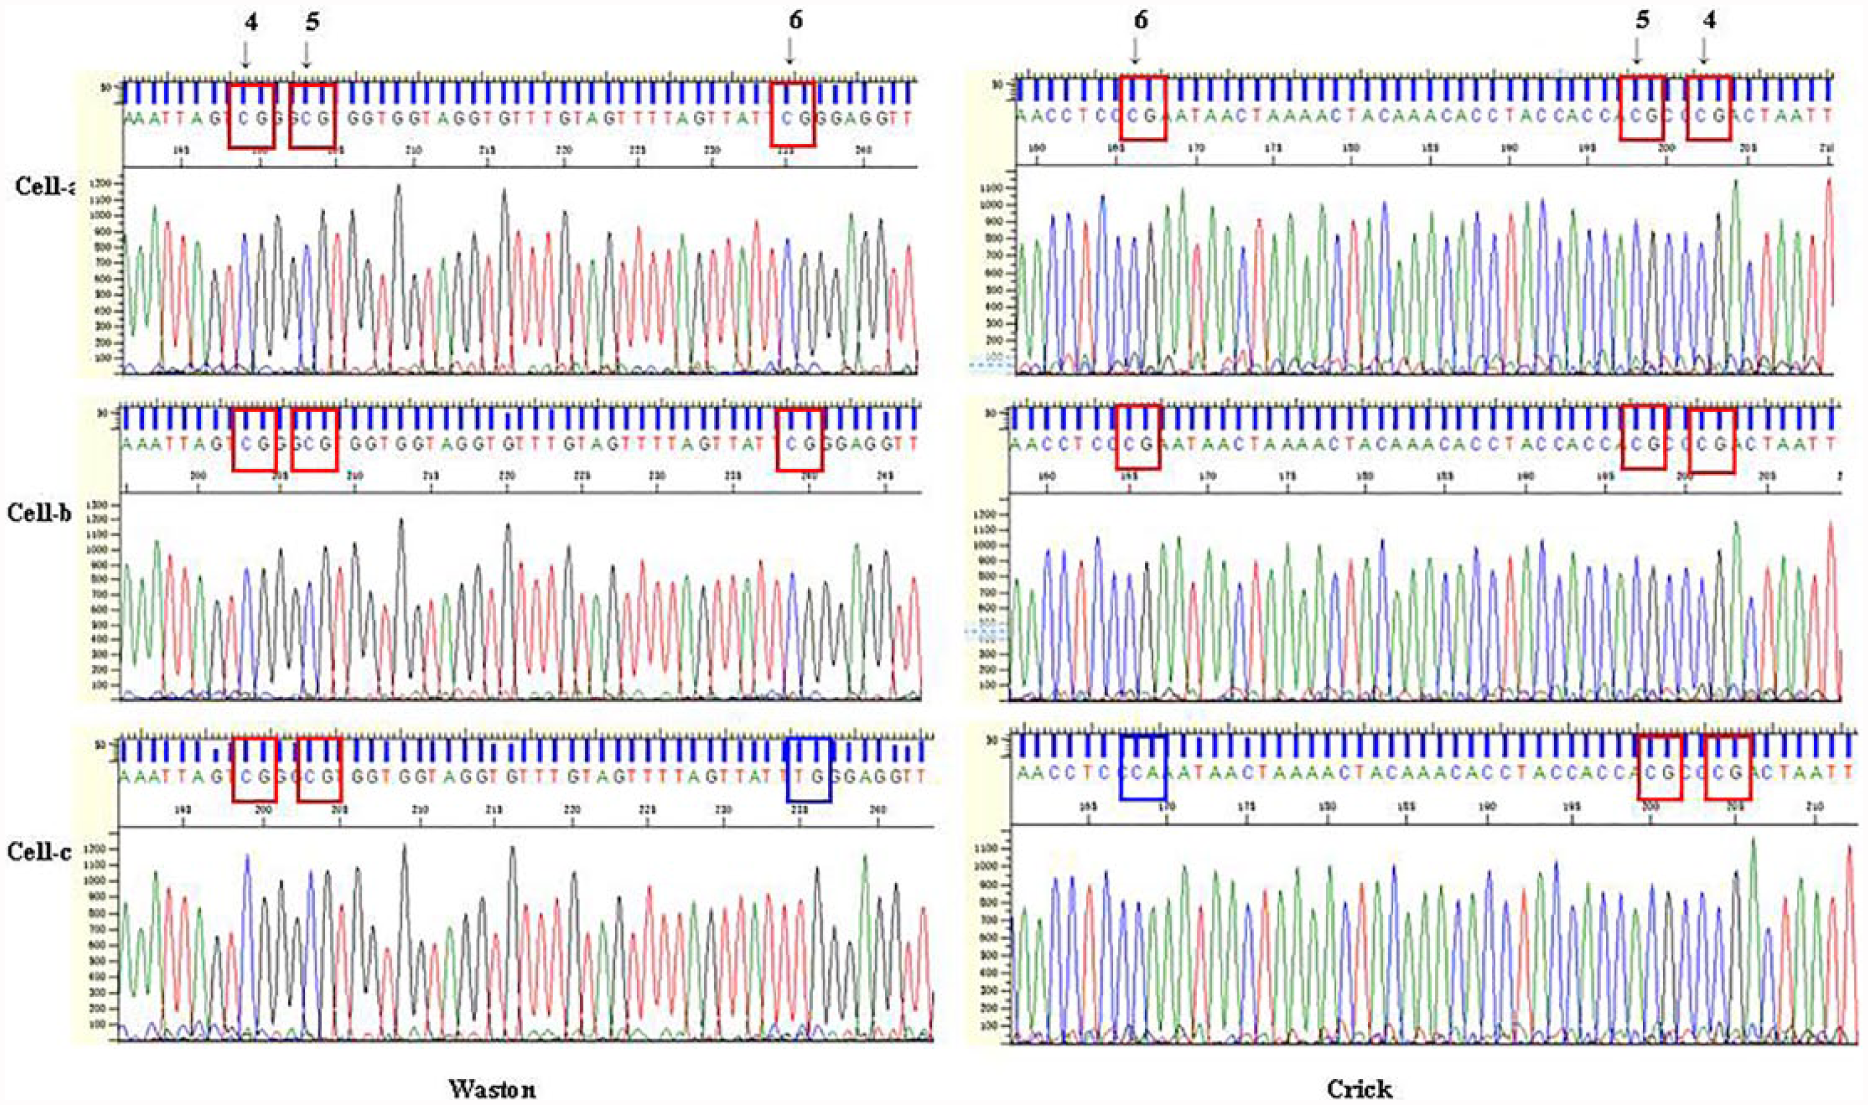
Different methylations happened on human chromosome 19 at different single cells. With targeted bisulfite primers of specific loci, sequencing was checked of single cell a, b and c. At loci 4 and 5, methylation was showed among single ovarian cancer cell a, b, and c, that is, it showed “CG.” At locus 6, cell a was methylated; in cells-b and c, it was not methylated. X axis represented sequencing position and Y axis represented signal intensity in every chart.

(a) Different methylations happened on human chromosome 1 at different single cells. With targeted bisulfite primers of specific loci, sequencing was checked of single cell d, e, and f. At loci 8, same methylation was showed among single ovarian cancer cells, that is, it showed “CG.” At locus 7, cell e was not methylated. X axis represented sequencing position and Y axis represented signal intensity in every chart. (b) Heterozygous amplification in same zones of chromosome 1.
Discussion
As one of the most important epigenetic modifications, DNA methylation plays a critical role in a large number of biological processes. It is possible to suppress the transcription of transposable and other repetitive elements, thus constraining unregulated growth of genome sizes by modifying the DNA methylation state of cytosines.29–31 Within gene regulatory regions, DNA methylation of CpG dinucleotides is a common and early event in cancer.32,33 Furthermore, hypermethylation within gene promoter regions is closely associated with the suppression of gene expression. 34 It is of interest to know about the DNA methylation state of all the cytosines in the genome because of the importance of DNA methylation in regulating fundamental biological processes. Conventional DNA sequencing techniques cannot distinguish between methylated and unmethylated cytosines. Bisulfite conversion utilizes sodium bisulfite to convert unmethylated cytosines to uracils, while leaving the methylated cytosines unconverted. By mapping the converted DNA back to the reference DNA, it is possible to determine the DNA methylation state of each cytosine simply by counting the number of cytosines and thymines that align to that position.
Recently, single-cell analyses have emerged as an important field of research because technology has improved in sensitivity and throughput sufficiently to begin to measure and understand the heterogeneity in complex biological systems and correlating it with changes in biological functions and disease processes. It is possible to explore the influence of organization and environment on rare cells and transient cell states by profiling individual cells, which cannot be described by ensemble measurement. The long-term goal of single-cell analysis is to accelerate the move toward personalizing health at the cellular level. For this goal, we must understand the link among cell heterogeneity, tissue function, and emergence of disease through the discovery, development, and translation of innovative approaches which will dramatically change the way cells are characterized.
Precise analysis of DNA methylation patterns from tiny amounts of microdissected materials would further open up new possibilities to use DNA methylation as a biomarker. In this study, a procedure is described that allows for the simultaneous quantitative analyses of DNA methylation of several loci at a single-cell level from LMD samples of archival FFPE ovarian cancer tissue. This method includes an optimized protocol for bisulfite conversion and subsequent amplification and purification. Thus, this method enables the analyses of the DNA methylation of several genes in one LMD sample. Furthermore, it is suitable for many applications beyond LMD analyses, whenever multiplex analyses of low template amounts are desirable.
One main shortcoming of this method to obtain DNA methylation information from single cells is loss of DNA. But loss of library molecules for next-generation sequencing (NGS) applications is also apparent for other bisulfite conversion protocols.35–37 This disadvantage should be considered by all NGS applications and not only for this single-cell bisulfite conversion method. Another shortcoming is the sizes of the amplicons generated by bisulfate-modified DNA, which is fragmented. In addition, FFPE DNA itself is also fragmented. In spite of three sets of primers were successful in 2–4 of the 9 cells, a lot of work needs to be done in the future to modify this method.
In summary, using laser capture microdissection to isolate different cell types from a complex tissue, one can confidently assign DNA methylation status, understand that the DNA methylation status at specific loci is specified in developing tissues, and understand the role of DNA methylation in tumor evolution. We have established a bisulfite conversion–based gene expression assay at single-cell resolution. This single-cell sequencing assay will greatly facilitate understanding the transcriptome complexity during mammalian development, especially in the fields of stem cells, early embryonic development and drug resistance to cancer. This method shows potential for clinical application as well. The ability to analyze genome-wide DNA methylation in a single cell may also identify biomarkers of disease. Our reliable workflow for DNA methylation measurements will be further modified in the future to obtain more information by high-throughput methods. The protocol described in this article shows that this technique is effective, rapid, and inexpensive.
Footnotes
Acknowledgements
The authors would like to thank Qi Yang, Morehouse School of Medicine, for performing the sequence analyses.
Declaration of conflicting interests
The author(s) declared no potential conflicts of interest with respect to the research, authorship, and/or publication of this article.
Funding
The author(s) disclosed receipt of the following financial support for the research, authorship, and/or publication of this article: This work was supported by National Institutes of Health (project nos R21HG006173, R43HG007621, HL117929, MD005964, MD007602, RR003034, and U54MD07588), the American Heart Association grant (project no. 09GRNT2300003), National Natural Science Foundation of China (project no. 81472823), the International Cooperation Project of Shaanxi Province (project no. 2013KW-30-04), and Fundamental Research Funds for Xi’an Jiaotong University (project no. xjj2015093).