
Abstract
Bone is the third most common site of cancer metastasis. In total, 30%–40% of lung cancer cases can develop skeletal metastasis for which no effective therapy in clinic is available. RCAN1 (regulator of calcineurin 1) is an important regulator in angiogenesis which is vital to tumor growth. In this study, we investigated the changes of biological behaviors in SBC-5 and SBC-3 cells after the RCAN1 expression level was changed. Briefly, overexpression of RCAN1 significantly attenuated their malignancy, including decreased ability of proliferation, colony formation, migration, invasion, and bone adherence. Furthermore, the cell cycle progression was impeded. Although the opposite changes were observed in SBC-3 cells after the RCAN1 expression was suppressed by RNA interference, the apoptosis rate was not affected by the expression level of RCAN1 in these cells. So, our research revealed that RCAN1 was involved in the development of small cell lung cancer, and it might be a cancer-inhibiting gene for the formation of bone metastases in small cell lung cancer.
Introduction
Cancer of lung and bronchus is one of the most common types of cancer and the leading cause of cancer-related death. Skeletal metastasis occurs in 30%–40% of lung cancer cases. It significantly decreases the quality of life and increases the mortality for cancer patients. There is no curative therapy for bone metastasis, and the present clinical managements are generally palliative. New molecules contributed to osteotropism metastasis are urgently needed to be studied.
Small cell lung cancer (SCLC) accounts for 15%–20% of lung cancers and represents an aggressive subtype characterized by rapid growth and widespread metastasis to distant organs. Miki et al. 1 have found that bone metastasis was formed by intravenous injection of human SCLC SBC-5 cells into natural killer (NK) cell–depleted severe combined immunodeficient (SCID) mice, whereas no metastasis was formed in mice injected with SBC-3 cells. The SBC-5 and SBC-3 cells have a similar genetic background but different potential of bone metastasis.
Regulator of calcineurin 1 (RCAN1) is an endogenous protein which interacts with calcineurin (CaN) and then inhibits its function by interfering with calcineurin–nuclear factor of activated T-cells (NFAT). 2 In the study of xenografted tumors in transgenic mice, overexpression of RCAN1 affords a generalized cancer protection via attenuating tumor angiogenesis by inhibiting the calcineurin pathway in the vascular endothelium. 3 Other studies demonstrated the involvement of RCAN1 in various cancers. RCAN1 plays a negative role in endothelial cell proliferation and angiogenesis. 4 Moreover, in the transgenic mouse model, a single extra copy of RCAN1 is sufficient to suppress tumor angiogenesis, resulting in a survival advantage.3,5 With the supply of oxygen and nutrients through blood vessels, microscopic tumor can grow into mass tumor. Therefore, tumor angiogenesis is crucial for tumor development. 6 These observations suggest that a deficit in tumor angiogenesis caused by an increased dosage of RCAN1 may provide a promising target for treating cancer. In our previous experiments, we found that calcineurin was overexpressed in SBC-5 cells which has a strong tendency for bone metastasis in nonobese diabetic (NOD)-SCID mice model; then, we testified that CnAα (an isoform of calcineurin) is closely related to osteotropism metastasis of SCLC, acting as a cancer-promoting gene for the development of bone metastasis. The expression level of RCAN1 in SBC-5 and SBC-3 cells is different and high level of RCAN1 was associated with reduced calcineurin activity.
Although certain studies indicated that RCNA1 played a role in cancer progression and represented a tumor suppressor gene in vitro, the association of RCAN1 with SCLC as well as itsosteotropism remains to be elucidated. In this study, we constructed the eukaryotic complementary DNA (cDNA) expression vector and the GV248 vectors of short hairpin RNAs (shRNAs) which targeted RCAN1. These recombined vectors were transfected into SBC-5 and SBC-3 cells to explore the function of RCAN1 in SCLC.
Materials and methods
Cell culture
The human SCLC cell lines SBC-5 and SBC-3 were gifts from Sone and Yano (Tokushima University, Japan). The cells were maintained at 37°C with 5% CO2 in RPMI-1640 medium (Gibco) supplemented with 10% (v/v) fetal bovine serum (FBS; Bio International), 100 U/mL streptomycin, and 100 U/mL penicillin.
RNA extraction and reverse transcription polymerase chain reaction
TRIzol reagent (Invitrogen) was used to extract the total RNA. Reverse transcription polymerase chain reaction (RT-PCR) assay was performed by the two-step reaction system. RNA was reverse transcribed into cDNA according to the instructions of the SuperScript™III Reverse Transcriptase (Invitrogen). PCR was performed using the following primer pairs: RCAN1—5′-AGGACGTATGACAAGGACAT-3′ (forward) and 5′-ATCAGAAACTGCTTGTCTGGA-3′ (reverse); glyceraldehyde 3-phosphate dehydrogenase (GAPDH)—5′-TGTGGGCATCAATGGATTTGG-3′ (forward) and 5′-ACACCATGTATTCCGGGTCAAT-3′ (reverse).
Quantitative real-time PCR was performed by Bio-Rad iCycler IQ™ 5 (Bio-Rad) with SYBR Master Mix (TaKaRa) according to the manufacturer’s instructions. GAPDH was used as an endogenous control in this study.
Western blotting
The cell proteins were extracted by radioimmunoprecipitation assay (RIPA) and then were separated by sodium dodecyl sulfate–polyacrylamide gel electrophoresis (SDS-PAGE) and transferred to nitrocellulose membrane (Hybond-C; Amersham Biosciences). After been blocked by 10% defatted milk, the membrane was washed with Tris-buffered saline with Tween 20 (TBST) and then incubated with rabbit anti-human RCAN1 polyclonal antibody (1:1000; Chemicon) or mouse anti-human monoclonal β-actin (1:10000; Sigma) at 4°C overnight. Next, the membrane was washed and incubated with horse radish peroxidase–conjugated goat anti-rabbit or anti-mouse antibody (1:10000; Chemicon) for 1 h. β-actin was used as an internal control in this study. Finally, the amount of the proteins was detected using the EzWay DAB Western Blot Kit (KOMA BIOTECH).
Measurement of calcineurin activity
Cellular calcineurin activity was measured using a colorimetric assay from EMD Biosciences Inc. According to the manufacturer’s recommended protocol, cells were washed twice and resuspended with ice-cold Tris-buffered saline (TBS). After been centrifuged, the cells were lysed by proteinase inhibitors–containing lysis buffer and sheared with a 16-gauge needle. The cell lysates were ultracentrifuged. Phosphate was removed from the samples by passing the cell lysates through a desalting resin (P6 DG desalting resin, Bio-Rad, USA) and a chromatography column (5 mL polypropylene column, Bio-Rad, USA). Phosphatase activity was then measured as total phosphatase activity; phosphatase activity in the presence of okadaic acid (OA), which inhibits phosphatase activity but has no effect on calcineurin and protein phosphatase (PP2C); and phosphatase activity in the presence of OA and ethylene glycol-bis(β-aminoethyl ether)-N,N,N′,N′-tetraacetic acid (EGTA; OA + EGTA), which inhibits all phosphatase activity except PP2C. Calcineurin activity was then calculated using the formula: CaN (PP2B) = OA − (OA + EGTA). Experiments were performed in duplicate on two separate occasions as described in the figure legends.
Plasmid construction and stable transfection
The full-length sequence (833 base pairs (bp)) of human RCAN1 was obtained from bio-synthesis containing the BamHI restriction site at 3′ end and the XhoI restriction site at 5′ end. The product was digested with BamHI and XhoI and then was recombined with the eukaryotic cDNA expression vector GV146 (CMV-MCS-IRES-EGFP-SV40-Neomycin). Kan-resistant colonies were expanded. The selected clones were sequenced on an ABI 3730xl 96-capillary DNA Analyzer (Applied Biosystems). GV146 containing the human Rcan1 was designated as GV146-RCAN1. GV146 and GV146-RCAN1 were transfected into SBC-5 cells using Lipofectamine 2000 (Invitrogen) following the manufacturer’s instructions. After 48 h, the transfected cells were cultured with medium containing 600 ng/mL of neomycin (Geneticin; Invitrogen). After 1 month of transfection, neomycin-resistant colonies were expanded and were designated as SBC-5-RCAN1 and SBC-5-V, respectively. Transfected RCAN1 gene was verified by RT-PCR (RNA level) and western blotting (protein level).
Small interfering RNA design, plasmid construction, and transfection
Four 19-nt small interfering RNAs (siRNAs) were designed to target different nucleotide sites of RCAN1 messenger RNA (mRNA; NM-004414). According to the targeting sequences, four pairs of shRNAs were designed and synthesized and then were inserted into GV248 (hU6-MCS-Ubiquitin-EGFP-IRES-puromycin) vector by double digesting with AgeI and EcoRI (New England BioLabs) and ligating with T4 DNA ligase (New England BioLabs) according to the manufacturer’s guidelines. A corresponding random siRNA sequence (TTCTCCGAACGTGTCACGT) was used as a control for RCAN1 siRNA.
The vector was then packaged into recombinant lentiviral particles through shRNA-mixTM. The 293T cells were transiently co-transfected with a phosphate calcium system (Invitrogen). Meanwhile, nuclear capsid (NC) lentivirus (inserted with control sequence) was also packaged. After 48 h of transfection, the viral supernatants were harvested, filtered, and concentrated. The viral titers were determined by quantitative PCR (qPCR). Lentiviral–green fluorescent protein (LV-GFP) virus was provided by GeneChem.
The GV248-RCAN1-RNAi, NC-LV, and LV-GFP virus were added into SBC-3 cells with ENi.S (enhanced infection solution; GeneChem) and polybrene (Sigma). LV-GFP was used as a positive control to indicate the infection rate. After 48 h, the transfected cells were selected with medium containing 1.0 µg/mL of puromycin (Sigma) for 14 days to obtain stably transfected RCAN1-RNAi-SBC-3 and SBC-3-NC cells. Then, these cells were maintained in growth media containing 0.5 µg/mL of puromycin. The interference efficacy was assessed by real-time PCR and western blotting.
In vitro cell proliferation assay
To detect cell proliferation rate of RCAN1-RNAi-SBC-3, SBC-3-NC, SBC-5-RCAN1, SBC-5-V, and parental cells, cells at logarithmic phase were harvested and placed onto 96-well plates. Then, the cells were incubated at 37°C with 5% CO2. A volume of 20 µL/well 3-(4,5-dimethylthiazol-2-yl)-2,5-diphenyltetrazolium bromide (MTT) solution (5 mg/mL) was added onto 96-well plates everyday at the expected time. After 4 h of incubation at 37°C, 150 µL of dimethyl sulfoxide (DMSO) was added to dissolve the formazan crystals. Absorbance was detected at wavelength of 490 nm by enzyme-linked immunosorbent assay (ELISA) plate reader. This assay was performed three times.
Soft agar colony formation assay
The six-well culture plates were covered with a layer of 0.6% agar in RPMI-1640 medium containing 10% (v/v) FBS to prevent the attachment of the cells to plates. Cell suspensions of the RCAN1-RNAi-SBC-3, SBC-3-NC, SBC-5-RCAN1, SBC-5-V, and parental cells were prepared with 0.3% agar and added onto the agar foundation. After 2 weeks of incubation, the colonies containing at least 50 cells were counted under inverted microscope (CKX41, Olympus, Japan). All assays were performed three times.
Cell apoptosis and cell cycle assay
Cell apoptosis rate was determined by flow cytometry with the Annexin V–FITC–PI Kit (Keygen). The cells to be detected were collected, washed with cold phosphate-buffered saline (PBS), and resuspended in binding buffer. Then, 10 µL of Annexin V–fluorescein isothiocyanate (FITC) and 5 µL of propidium iodide (PI) were added and the cells were incubated at room temperature for 15 min in the dark. The apoptosis rate was analyzed with FACSCalibur system (BD Biosciences).
Cell cycle distribution was determined by the following steps: Cells were resuspended with PBS and then fixed with 75% ethanol at 4°C overnight. Next, the cells were washed and resuspended with cold PBS. A volume of 5 µL of RNase (10 mg/mL) was added into the cell suspension and incubated for 1 h at 37°C. Then, the cells were stained with 100 µg/mL of PI in a 0.1% sodium citrate/0.1% Triton X-100 solution for 30 min at RT (room temperature) in the dark. Finally, the cells were washed with cold PBS. Analysis of cellular DNA content was performed by flow cytometry at an excitation wavelength of 488 nm. The distribution of cell cycle in these cells was analyzed using CellQuest and MidFit softwares (BD Biosciences).
In vitro cell migration and invasion assay
To detect the migration ability of the cells, 24-well transwell plates (matrigel uncoated) were used. RCAN1-RNAi-SBC-3, SBC-3-NC, SBC-5-RCAN1, SBC-5-V, and parental cells were placed onto the upper chamber of the wells and 500 µL of RPMI-1640 containing 10% FBS was added to the lower chamber. After 24 h, the inserts were fixed with 10% formalin and stained with crystal violet. The cells on the upper surface of the inserts were removed by swabbing with cotton swabs, and the cells migrated to the lower surface were counted under microscope. Five fields (200×) of every sample were selected randomly for statistical analysis. All assays were performed three times.
Cell invasion assays were performed using matrigel-coated (BD Biosciences) 24-well transwell plates containing chambers of 8.0 µm pore size (Costar). The other steps were conducted as per the same procedures described above.
Bone adhesion ability assay in vitro
DDY mice (5 days old) were killed and their calvariae were aseptically harvested and divided into halves. After 24 h of incubation in Hank’s solution containing 1000 U/mL penicillin, they were treated with collagenase and trypsinase at 37°C for 2 h. The 24-well culture plates were covered with a layer of 1% agar. The calvariae were placed onto the foundation agar and washed with RPMI-1640 without FBS. Then, RPMI-1640 with 10% FBS was added onto the culture plates which were incubated at 37°C for 30 min. SBC-3, SBC-5, and the transfected cells were planted onto the calvariae. After 36 h of incubation, the calvariae were washed with Hank’s solution, fixed with formalin, and stained with crystal violet. The cells attached to the calvariae were digested with trypsinase and then were resuspended with PBS. The optical density (OD) value was detected at wavelength of 560 nm by ELISA plate reader, which was used to evaluate the adhesive affinity of cancer cells to bone. All assays were performed three times.
Statistical analysis
The statistical analysis of data was performed by t test and statistical package (origin 8 for Windows). Differences between groups were considered to be statistically significant at p < 0.05, and all the statistical tests were performed with two-sided tests.
Results
SBC-3 cells showed higher RCAN1 expression and lower calcineurin activity
Expression level of RCAN1 in SBC-3 cells was significantly higher than that in SBC-5 cells (p < 0.05, Figure 1). On the contrary, the calcineurin activity in SBC-3 cells was lower than that in SBC-5 cells (p < 0.05, Figure 2). This result indicated that there was a negative relation between RCAN1 expression and calcineurin activity.
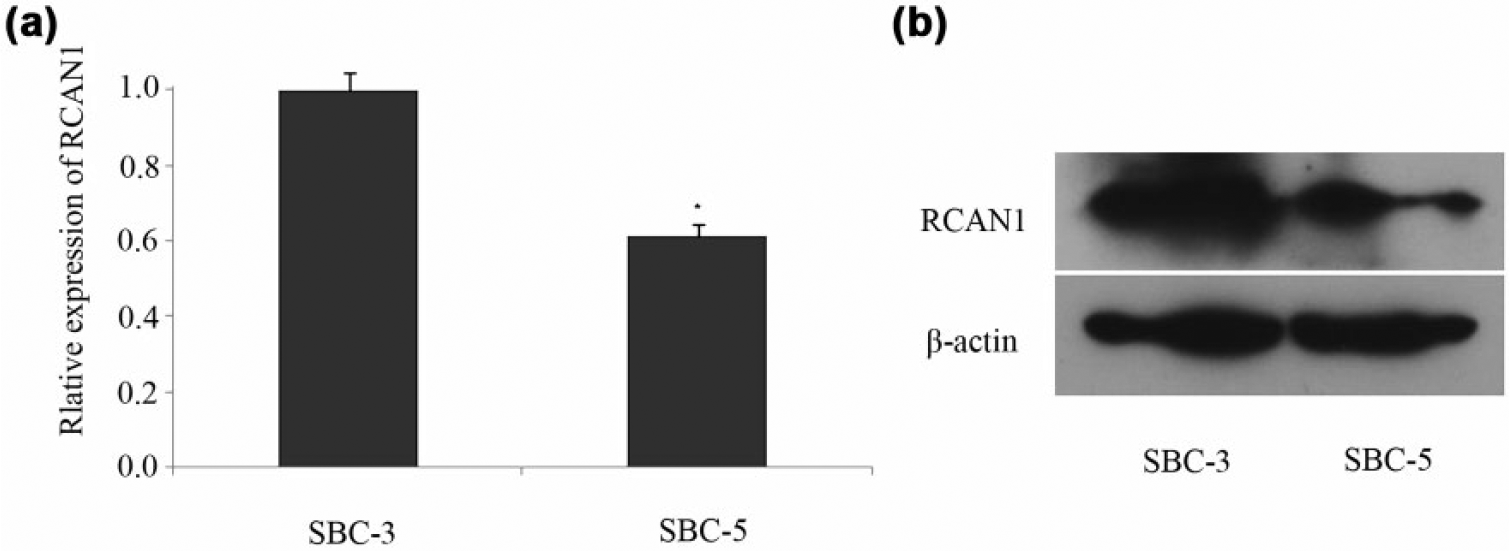
The expression of RCAN1 in SBC-3 and SBC-5 cells. (a) The mRNA expression and (b) the protein expression of RCAN1 in SBC-3 and SBC-5 cells (*p < 0.05).

The calcineurin activity in SBC-3 and SBC-5 cells. The statistical results were shown as mean ± SD (*p < 0.05).
Increased RCAN1 inhibited the cell proliferation rate
The transfection efficiency was confirmed by real-time PCR and western blot assay (Figure 3). The RCAN1 expression in SBC-5 cells was greatly increased, while in SBC-3 cells, it was obviously downregulated. After transfection, the proliferation ability of SBC-5-RCAN1 cell was obviously decreased compared with SBC-5-V and SBC-5 cells (Figure 4(a)). On the other side, RCAN1-RNAi-SBC-3 cell proliferated faster than SBC-3-NC and SBC-3 cells (Figure 4(a)). These differences were shown from the third day (p < 0.05). This assay indicated that RCAN1 played a negative role in the proliferation of SBC-5 and SBC-3 cells.

Validation of the transfection efficiency. The expression of RCAN1 in SBC-3, SBC-3-NC, and RCAN1-RNAi-SBC-3 cells at (a) mRNA and (c) protein levels. The expression of RCAN1 in SBC-5, SBC-5-V, and SBC-5-RCAN1 cells at (b) mRNA and (d) protein levels (*p < 0.05 compared with the control groups (SBC-5-V/SBC-3-NC)).

Effect of the change in the RCAN1 expression levels in SCLC cells. (a) The cell proliferation curve of SBC-3, SBC-3-NC, and RCAN1-RNAi-SBC-3 cells, as well as SBC-5, SBC-5-V, and SBC-5-RCAN1 cells. (b) The whole image of the colonies formed in these cells. (c and d) The statistical analysis of the colony assay resulted from random fields (*p < 0.05 compared with the control groups (SBC-5-V/SBC-3-NC)).
In order to reconfirm this function, soft agar colony formation was performed. As shown in Figures 4(b) and (c), SBC-5-RCAN1 group formed 23 ± 2.3 colonies, which was less than that formed by SBC-5-V (56 ± 3.2) and SBC-5 cells (58 ± 2.45; p < 0.05). On the contrary, the number of colonies developed by RCAN1-RNAi-SBC-3 cell (58 ± 2.56) was larger than that in SBC-3-NC and SBC-3 groups, which were 27 ± 2.54 and 28 ± 2.34, respectively (p < 0.05). There was no statistical difference between SBC-5-V and SBC-5 groups and between SBC-3-NC and SBC-3 groups (p > 0.05).
RCAN1 did not affect the apoptosis but could inhibit the cell cycle progression
After the transfection, SBC-5-RCAN1 cells shared a similar apoptosis rate with SBC-5-V cells and the parental SBC-5 cells, indicated by the figures—1.40% ± 0.03%, 1.57% ± 0.02%, and 1.91% ± 0.03% (p > 0.05, Figure 5(d)–(f)). Even interfering with the expression of RCAN1 did not change the apoptosis rate in SBC-3 cells (Figure 5(a)–(c)). Specifically, the apoptosis rates were 2.52% ± 0.28%, 2.20% ± 0.17%, and 2.29% ± 0.23% in RCAN1-RNAi-SBC-3, SBC-3-NC, and SBC-3 cells (p > 0.05, Figure 4(b)). These data indicated that the RCAN1 did not change the apoptotic potential of SBC-5 and SBC-3 cells.
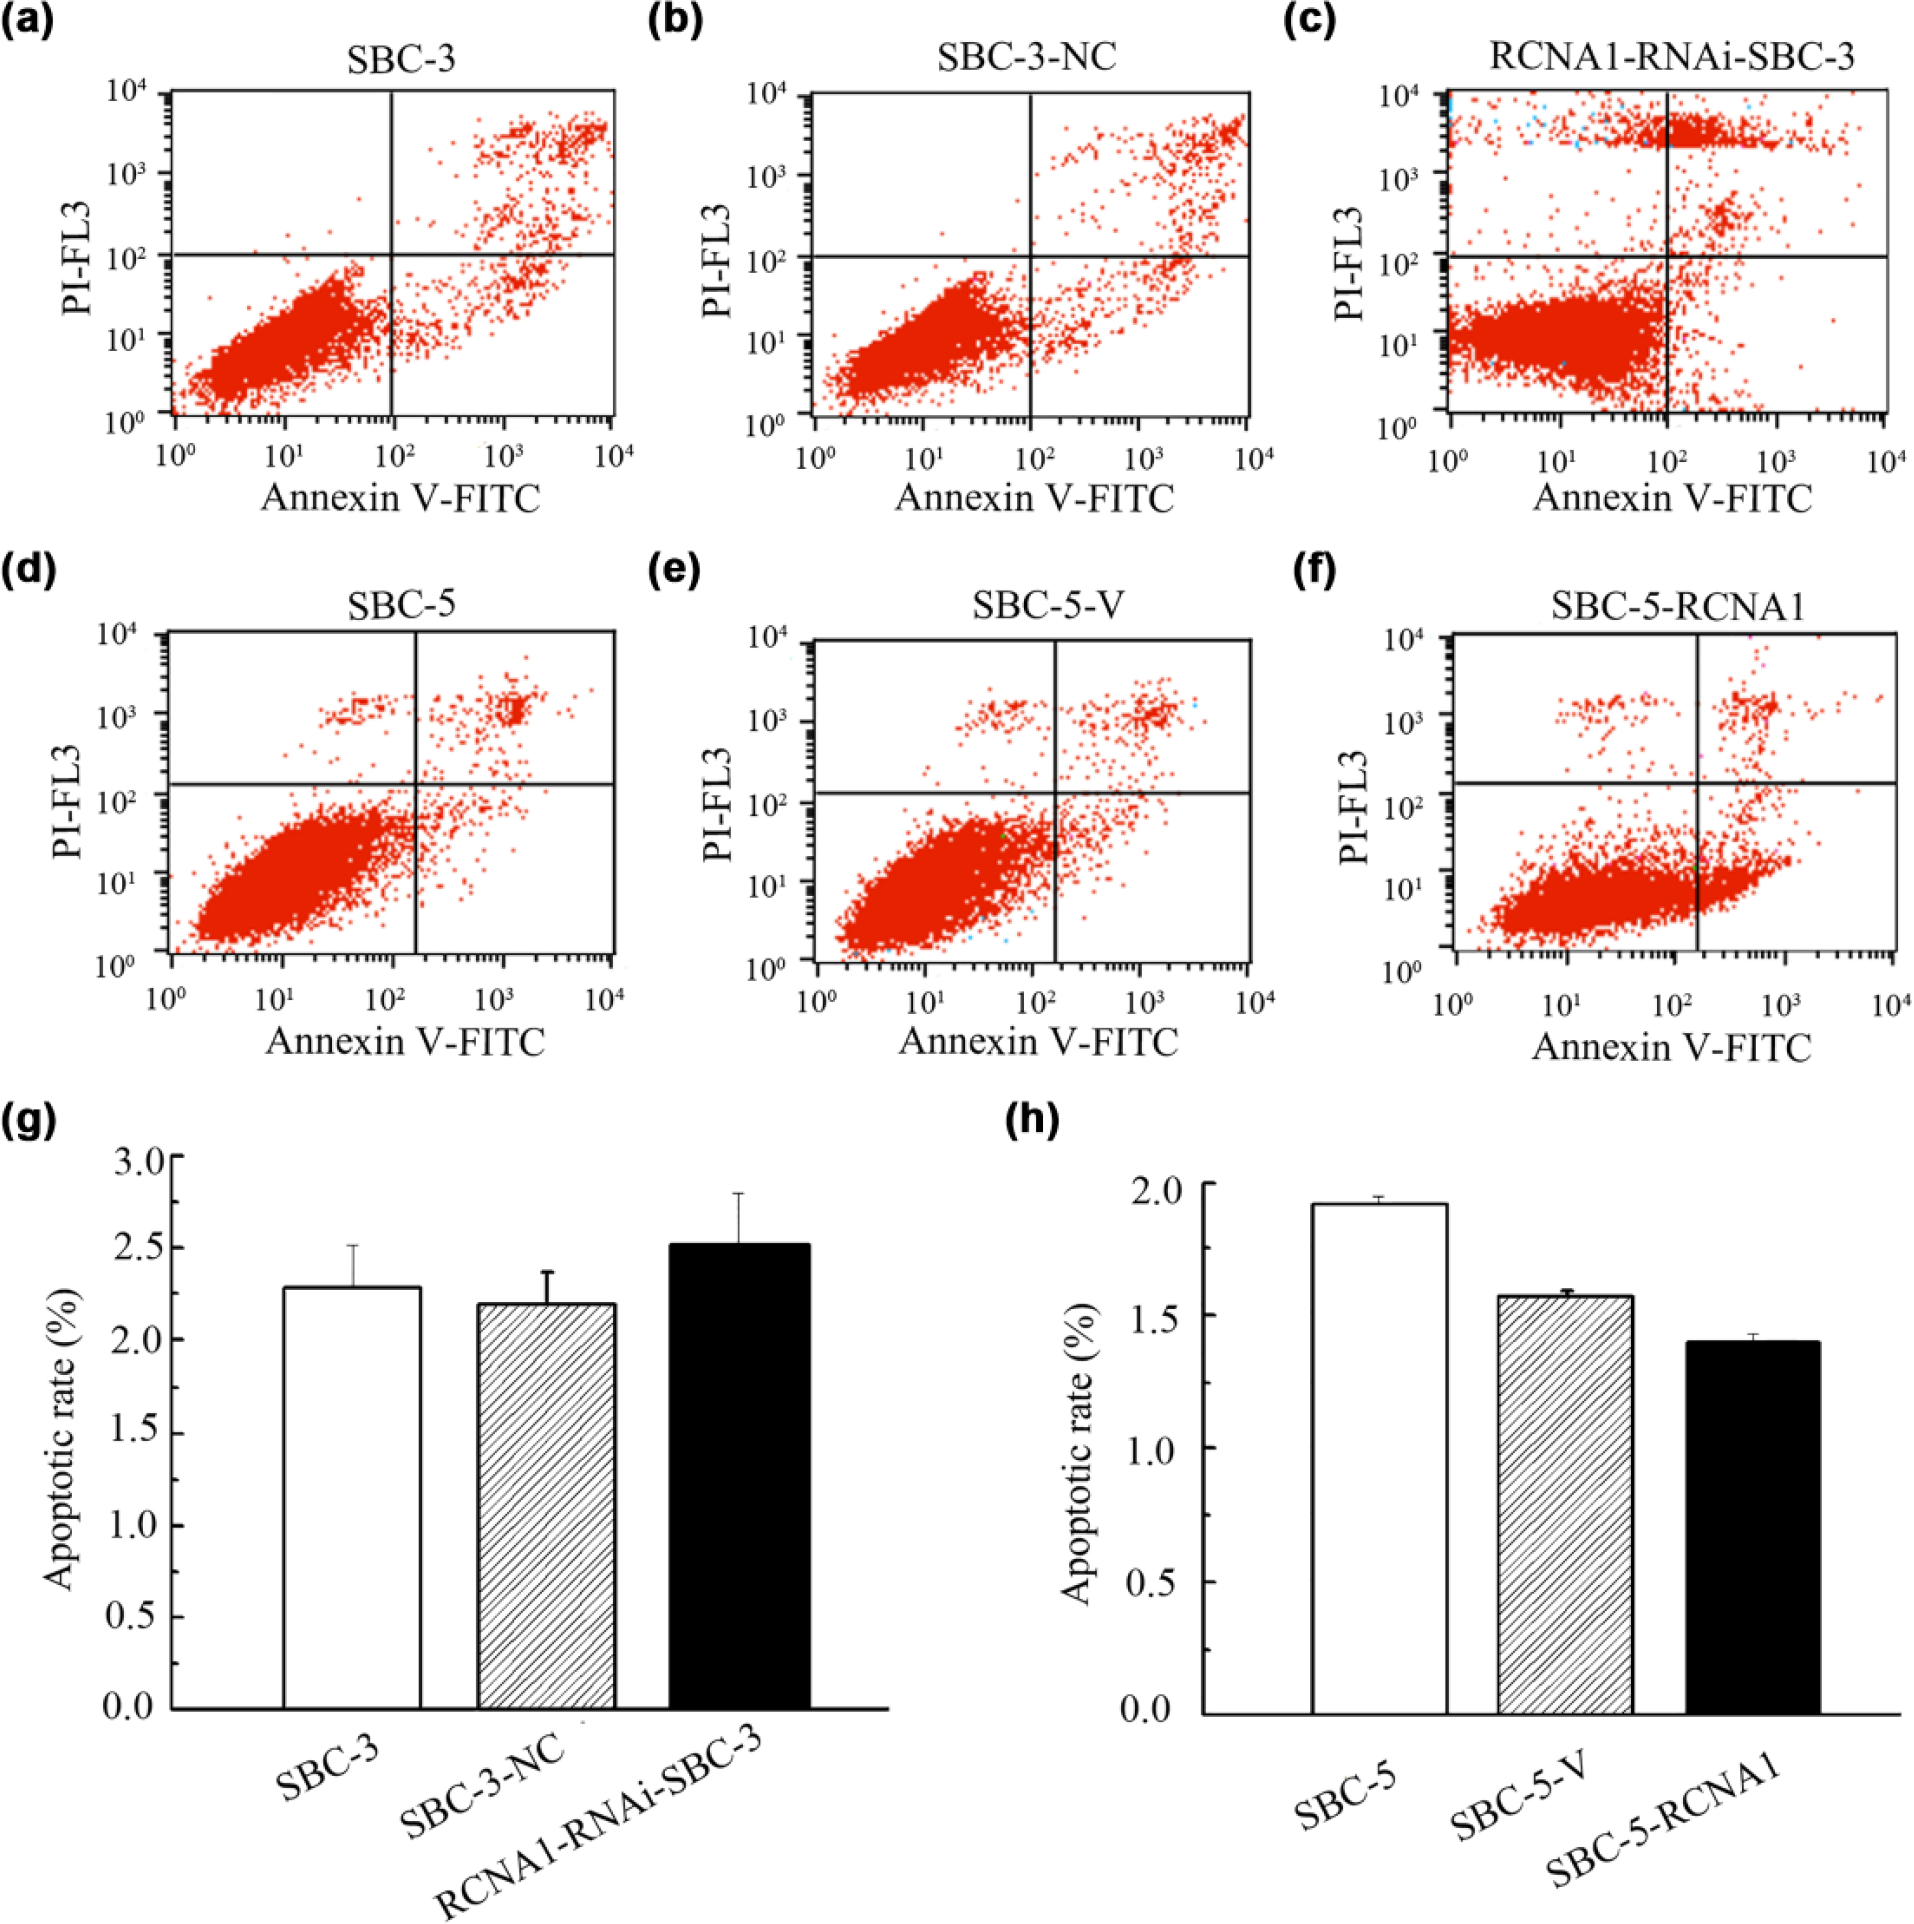
The cell apoptosis assay was performed by FACS. (a–c) The representative images of cell apoptotic rate of SBC-3, SBC-3-NC, and RCAN1-RNAi-SBC-3 cells. (d–f) The representative images of cell apoptotic rate of SBC-5, SBC-5-V, and SBC-5-RCAN1 cells. (g and h) The statistical analysis of the apoptosis rate was represented as mean ± SD (*p < 0.05 compared with the control groups (SBC-5-V/SBC-3-NC)).
Then, the cell cycle distribution was analyzed to detect the effect of RCAN1 on cell cycle progression in SBC-5 and SBC-3 cells (Table 1). Cells in G1 phase were greatly increased in SBC-5-RCAN1 cells, 68.64% ± 0.95%, compared to SBC-5-V, 31.79% ± 0.87%, and SBC-5 cells, 32.40% ± 2.37% (p < 0.05, Figure 6(d)–(f)). While the proportion of S phase cells in SBC-5-RCAN1 cells (11.90% ± 1.07%) was smaller than that in SBC-5-V (51.06% ± 0.97%) and in SBC-5 cells (49.25% ± 1.18%; p < 0.05, Figure 6(d)–(f)). Furthermore, compared with SBC-3-NC and SBC-3 cells, RCAN1-RNAi-SBC-3 cells showed a smaller proportion of G1 phase cells (37.29% ± 1.54% vs 47.06% ± 0.74% and 49.30% ± 1.76%) and a larger proportion of S phase cells (51.05% ± 1.67% vs 36.83% ± 0.96% and 31.66% ± 6.38%; p < 0.05, Figure 6(a)–(c)). This result implied that RCAN1 may impede the G1–S transition in SBC-5 and SBC-3 cells, prohibiting the cells to undergo mitotic divisions.
The cell cycle distribution of the transfected cells and the parental cells.

p < 0.05.

The representative images of cell cycle distribution. (a–c) The cell cycle distribution in SBC-3, SBC-3-NC, and RCAN1-RNAi-SBC-3 cells. (d–f) The cell cycle distribution in SBC-5, SBC-5-V, and SBC-5-RCAN1 cells.
RCAN1 can inhibit the invasion and migration ability
Transwell assay was used to investigate the roles that RCAN1 played in the invasion and migration of SBC-5 and SBC-3 cells. Briefly, the invasive capacity of SBC-5-RCAN1 cell was reduced significantly. The mean numbers of the cells which passed through the inserts were 19 ± 1.79, 40 ± 3.02, and 41 ± 3.77 in SBC-5-RCAN1, SBC-5-V, and SBC-5 group, respectively; p < 0.05, Figure 7). In addition, the change trend of migratory ability was same to the invasion ability (Figure 8). In total, 42 ± 3.20, 80 ± 2.88, and 79 ± 2.79 cells had migrated to the downside of the inserts in SBC-5-RCAN1, SBC-5-V, and SBC-5 cells, respectively. The statistical difference between SBC-5-RCAN1 group and SBC-5-V group was significant (p < 0.05).

The detection of invasive ability in these cells. (a) The representative image of invasion assay in SBC-3, SBC-3-NC, and RCAN1-RNAi-SBC-3 cells, as well as in SBC-5, SBC-5-V, and SBC-5-RCAN1 cells. (b and c) The statistical analysis of invasion assay resulted from five random fields under microscope was represented as mean ± SD (*p < 0.05 compared with the control groups (SBC-5-V/SBC-3-NC)).

The detection of migratory ability in these cells. (a) The representative image of migration assay in SBC-3, SBC-3-NC, and RCAN1-RNAi-SBC-3 cells, as well as in SBC-5, SBC-5-V, and SBC-5-RCAN1 cells. (b and c) The statistical analysis of migration assay resulted from five random fields under microscope was represented as mean ± SD (*p < 0.05 compared with the control groups (SBC-5-V/SBC-3-NC)).
In SBC-3 cells, downregulation of RCAN1 resulted in enhanced invasive and migratory ability. As shown in Figures 7 and 8, the cells that invaded through the inserts in SBC-3-NC cells (91 ± 2.79) were more than that in SBC-3-NC (43 ± 3.58) and SBC-3 cells (44 ± 3.73; p < 0.05). Consistently, the number of RCAN1-RNAi-SBC-3, SBC-3-NC, and SBC-3 cells that migrated onto the lower surface was 88 ± 4.24, 47 ± 6.11, and 51 ± 4.93, respectively. The difference between RCAN1-RNAi-SBC-3 and SBC-3-NC cells or SBC-3 cells was obvious (p < 0.05). This assay indicated that transfection of RCAN1 to SBC-5 cells could inhibit the cell migration and invasion, while downregulation of RCAN1 in SBC-3 cells could enhance the invasion and migration capability.
RCAN1 suppressed the cells to adhere to the bone
Bone adhesion assay was carried out to investigate the adhesive capacity of SCLC cells to the bone, imitating the microenvironment of bone metastasis in vivo. The OD560 value of the SBC-5-RCAN1 cells digested off from the bone pieces was 0.22 ± 0.02, which was lower than that of SBC-5-V (0.52 ± 0.02) and SBC-5 cells (0.54 ± 0.031; p < 0.05, Figure 9). The OD560 in RCAN1-RNAi-SBC-3 group was 0.55 ± 0.05, higher than SBC-3-NC (0.15 ± 0.02) and SBC-3 group (0.13 ± 0.02; p < 0.05, Figure 9). The result suggested that RCAN1 might be a negative factor in regulating the cell adhesion to bone.

Detection of bone adhesion capacity. (a) The representative images of the cells adhered onto the bones. The OD560 value of the cells digested off from the bones in (b) SBC-3, RCAN1-RNAi-SBC-3, and SBC-3-NC cells and in (c) SBC-5, SBC-5-RCAN1, and SBC-5-V cells was represented as mean ± SD (*p < 0.05 compared with the control groups (SBC-5-V/SBC-3-NC)).
Discussion
Bone metastasis is a serious complication that occurs in the late stage of SCLC progression and remains the most difficult question in the clinical treatment. The development of metastatic lesions involves complex mechanisms. 7 However, the metastasis is not random but selective. Bidirectional interactions between cancer cells and the particular organ microenvironment result in a preferential advantage for tumor growth and can lead to metastases. In earlier 1889, Stephen Paget 8 had put forward the “seed and soil” hypothesis, which was an important milestone for the study of cancer. Breast cancer, prostate cancer, and lung cancer preferentially spread to bone. Bone is rich in growth factors and cell types, making it a hospitable environment for cancer growth. Crosstalk between tumor and bone activates numerous signaling pathways which drive a vicious cycle.9,10 Cancer cells express chemokine receptors, cadherins, and integrins and secrete hormones, cytokines, and inflammatory factors that facilitate their adhesion to bone and remold the microenvironment to support their survival.11–13 Due to the sophistication of this regulatory signal network, the precise molecular mechanisms and the “master” genes that govern these fatal changes remain elusive.
An interesting phenomenon which evokes a new strategy to suppress and prevent the development of bone metastases is that the incidence of most solid tumors, including lung cancer, is really low in individuals with Down syndrome. 14 The lower incidence of many cancers in this special subpopulation suggests that a general mechanism contribute to such a protection from broad-spectrum cancers. Coincidentally, patients of Down syndrome show a low morbidity of angiogenesis-related disease such as atherosclerosis and diabetic retinopathy.15,16 As some genes on chromosome 21 can encode endogenous angiogenesis inhibitors17,18 and angiogenesis is so essential for the tumor growth 6 that the low incidence of solid cancers in individuals with Down syndrome may stem from the extra copy of these genes on chromosome 21. RCAN1 is located on chromosome 21 and encodes an endogenous inhibitor for calcineurin, a calcium-dependent serine/threonine phosphatase, of which inhibition can attenuate the signal pathway of vascular endothelial growth factor (VEGF) in the vascular endothelium.19,20 These observations suggest that a deficit in tumor angiogenesis caused by an increased dosage of RCAN1 may be a part of the general mechanism underlying generalized protection of victims of Down syndrome against cancer.
As a novel endogenous angiogenesis inhibitor, RCAN1 does play a role in the tumor growth. Liu et al. have identified that RCAN1 combined with IκBα and affected the phosphorylation of IκBα, resulting in inhibition of nuclear factor kappa B (NF-κB) signaling activity. Furthermore, overexpression of RCAN1 in lymphoma cells can reduce the cell viability in vitro and suppressed the growth of lymphoma transplants in vivo. 21 Consistently, some studies stated that overexpression of RCAN1 rendered cells more sensitive to dexamethasone (DEX). In addition, the level of pro-apoptotic proteins were decreased, while that of anti-apoptotic Bcl-2 family proteins were increased in RCAN1-disrupted cells, which maybe the underlying mechanism of RCAN1 enhancing the sensibility of leukemia cells to DEX. 22 Baek et al. 3 also showed that the elevated expression afforded by a single extra transgenic copy of RCAN1 was sufficient to confer significant inhibition of tumor growth in mice, resulting from a deficit in tumor angiogenesis arising from disruption of the calcineurin pathway. In our previous studies we identified that expression level of CnAα, an isoform of calcineurin, was significantly higher in tissues of SCLC patients with bone metastasis compared with those without bone metastasis. CnAα acted as a tumor-promoting factor. 23 In order to move forward energetically on this research to develop new therapeutic target for treating bone metastasis in lung cancer, we decided to investigate the function of RCAN1, the upstream regulator of CnAα. In this study, first, we found that SBC-3 cells showed higher RCAN1 expression level and lower calcineurin activity compared to SBC-5 cells. Then we detected the function of RCAN1 played in SCLC cells. The transfection of RCAN1 into SBC-5 cells obviously inhibited cell proliferation, colony formation, migration, invasion, and bone adhesion and delayed cell cycle progression, denoted by the interruption of G1 → G2 phase transition. However, the downregulation of RCAN1 by transducing RNA interference (RNAi) with recombinant lentiviral vector in SBC-3 cells can significantly increase the ability of cell proliferation, colony formation, migration, invasion, and bone adhesion and promote G1 → G2 transition. However, neither upregulation nor downregulation of RCAN1 influenced the apoptotic rate in SBC-5 and SBC-3 cells.
In conclusion, these results indicated that RCAN1 played an important role in regulating the biological behaviors of the human SCLC cells in vitro, indicating that RCAN1 may be a candidate for suppressing the development of bone metastasis in SCLC. So, our study implicated a promising therapeutic approach for the prevention and treatment of bone metastases in SCLC.
Footnotes
Declaration of conflicting interests
The author(s) declared no potential conflicts of interest with respect to the research, authorship, and/or publication of this article.
Funding
The author(s) disclosed receipt of the following financial support for the research, authorship, and/or publication of this article: This study was supported by the National Natural Science Foundation of China (No. 81272345), the Provincial Project (No. 2012D11), and the Natural Science Foundation Research Project of Shaanxi Province (No. 2016JM8036).