
Abstract
Maintaining intracellular pH is crucial for preserving healthy cellular behavior and, when dysregulated, results in increased proliferation, migration, and invasion. The Na+/H+ exchanger isoform 1 is a highly regulated transmembrane antiporter that maintains pH homeostasis by exporting protons in response to intra- and extracellular signals. Activation of Na+/H+ exchanger isoform 1 is exquisitely regulated by the extracellular environment and protein cofactors, including calcineurin B homologous proteins 1 and 2. While Na+/H+ exchanger isoform 1 and calcineurin B homologous protein 1 are ubiquitously expressed, calcineurin B homologous protein 2 shows tissue-specific expression and upregulation in a variety of cancer cells. In addition, calcineurin B homologous protein 2 expression is modulated by tumorigenic extracellular conditions like low nutrients. To understand the role of calcineurin B homologous protein 2 in tumorigenesis and survival in lung cancer, we surveyed existing databases and formed a comprehensive report of Na+/H+ exchanger isoform 1, calcineurin B homologous protein 1, and calcineurin B homologous protein 2 expression in diseased and non-diseased tissues. We show that calcineurin B homologous protein 2 is upregulated during oncogenesis in many adeno and squamous carcinomas. To understand the functional role of calcineurin B homologous protein 2 upregulation, we evaluated the effect of Na+/H+ exchanger isoform 1 and calcineurin B homologous protein 2 depletion on cellular function during cancer progression in situ. Here, we show that calcineurin B homologous protein 2 functions through Na+/H+ exchanger isoform 1 to effect cell proliferation, cell migration, steady-state pH i , and anchorage-independent tumor growth. Finally, we present evidence that calcineurin B homologous protein 2 depletion in vivo has potential to reduce tumor burden in a xenograft model. Together, these data support the tumor-promoting potential of aberrant calcineurin B homologous protein 2 expression and position calcineurin B homologous protein 2 as a potential therapeutic target for the treatment of non-small cell lung cancer.
Introduction
One-quarter of all predicted cancer deaths will be a result of lung cancer in 2019 with non-small cell lung cancer (NSCLC) being the largest subset. 1 Gaining insight into factors that drive NSCLC tumor development is invaluable in understanding tumor survival, growth, and eventually metastasis. The tumor microenvironment (TME) is a complex network of malignantly transformed cells, developing vasculature, and an evolving extracellular environment.2–4 Cells with tumorigenic potential must be able to contend with these harsh conditions by enacting unique gene expression profiles. During tumor neogenesis, growing tumors with subdiffusive surface area to volume ratios are unable to effectively absorb nutrients until vasculature is recruited. Low nutrient conditions are known to induce changes in cellular behavior but the molecular signals driving this response and the biological implications on tumor progression remain unclear.
Another defining characteristic of the TME is an acidic extracellular environment generated by a reversal in the pH gradient across the plasma membrane as a result of cancer metabolism.4–6 Non-diseased cells have an intracellular pH (pH i ) range of 6.99–7.15 while cancer cells show pH i of 7.12–7.7. Low pH e generated by excreted protons alters gene expression and initiates extracellular signaling events that enhance tumorigenic behavior such as increased proliferation, invasion, and metastasis.7–9 This transformed phenotype is maintained by a variety of ion transporters including the ubiquitously expressed Na+/H+ exchanger isoform 1 (NHE1).4,10–12
NHE1 is a 12-pass transmembrane transporter that exchanges one extracellular Na+ for one intracellular H+. Transport of ions is facilitated by the transmembrane N-terminal domain which is regulated by a proton sensing domain responsible for establishing proton set point and transport equilibrium. NHE1 proton transport is further tuned by a long disordered cytoplasmic tail, unique to the NHE1 isoform, containing multiple phosphorylation sites and several protein and lipid binding domains.4,13–15 Despite the multifaceted regulation of NHE1,4,10,11 several cofactors have emerged as particularly critical for NHE1 proton transport activity including an isoform of the Ca2+-binding proteins called calcineurin B homologous protein 2 (CHP2).16,17
Calcineurin B homologous protein 1 (CHP1) and CHP2 are essential cofactors for NHE1.10,16,17 Removal of CHP1 from cells leads to a decrease in NHE1 transport activity by over 90%. 17 CHP1 is ubiquitously expressed while CHP2 is primarily expressed in non-diseased small and large intestinal cells 18 and in malignantly transformed cells including hepatomas, colon adenocarcinoma (AC), cervical carcinoma, and leukemia 17 ; however, the number of tissues assessed in each of these studies was limited and the expression in non-diseased cells was not rigorously examined. Functionally, CHP1 is known to regulate calcineurin activity, participate in vesicular transport, and activate multiple isoforms of NHE.19,20 The functionality of CHP2 is less known, but studies have demonstrated its effects on cancer progression.17,21–23 Recently, CHP2 expression was detected as a putative tumor marker in patients with acute leukemia, where CHP2 was not detected in non-diseased tissue. 24
Binding of CHP1 and CHP2 occurs on the cytoplasmic regulatory domain on NHE1. 25 It has been proposed that NHE1 bound CHP increases NHE1 H+-affinity and stabilizes its active conformation. 26 Due to a high amino acid homology of 61%, CHP2 is thought to be similar in structure and function to CHP1, but CHP2 is reported to bind to NHE1 with a 4–5 fold higher affinity.17,27 It has been reported that during serum deprivation, CHP2 activates NHE1 to alkalinize pH i , protecting cells from apoptosis. 17 Also, overexpression of CHP2 in ovarian cancer, breast cancer, and HEK293 cells causes an increase in proliferation, invasion, and metastasis.22,28,29
Here, we strengthen our understanding of CHP expression and modulation of NHE1 synergistically regulates the TME. What has yet been determined is how CHP2 drives NHE1 function in support of cancer cell survival while both CHP isoforms are expressed and compete for the same location of NHE1 in tumor cells. Earlier studies exogenously expressed CHP2 in the presence of CHP1 or used non-CHP interacting NHE1 mutant expression to demonstrate a role for CHP2-NHE1 regulation. This study focuses on the endogenous expression and roles of NHE1 and CHP2 in NSCLC tumorigenesis and tumor survival. We evaluated expression levels of NHE1, CHP1, and CHP2 from multiple normal and malignant tissues from patient samples and cell lines then assessed the functional roles of NHE1 activation by CHP2 in an NSCLC cell line, NCI-H1299. We showed that increases in CHP2 activity, not CHP1, are critical for NHE1-related cell behavior and that loss of CHP2 expression results in a loss of cell survival. Finally, we evaluated how NHE1 or CHP2 knock down impacts proliferation, migration, anchorage-independent growth, and tumor formation. Overall, our study concludes that CHP2 expression, not CHP1, can support NHE1 activity to enhance cancer cell survival and promote cancer progression of NSCLC in the nascent tumor environment.
Materials and methods
Cell culture and stable expression
NCI-H1299 non-small cell lung carcinoma cells (American Type Culture Collection, Manassas, VA) were maintained in RPMI 1640 medium containing 25-mM NaHCO3 and 10% fetal bovine serum (FBS) at 37°C in a 5% CO2 incubator. Stably transfected knockdown cell lines for NHE1 or CHP2 were created using shRNA constructs. Knockdown cell lines were produced by transfecting H1299 cells (Fugene-6, Roche Biochemical) in serum- and antibiotic-free OptiMEM 1 media (Invitrogen, Carlsbad, CA), incubating the cells overnight followed by three rounds of selection using 1-mg/mL G418. Following selection, H1299 cells that were successfully transfected were maintained by culturing in RPMI medium with 10% FBS containing 0.25-mg/mL G418. Stably transfected cells were serial diluted to obtain single cell clonal isolation. Clonally isolated cell lines were selected and tested for lack of NHE1 or CHP2 expression. Prior to use in each experiment, cells were cultured in medium without G418 to reduce the impact of selection agent. All cells were maintained at 37°C and 5% CO2.
Expression data from protein databases
RNA-Seq analysis is reported as transcripts per million (TPM) database from either the Expression Atlas (April 2018) or The Cancer Genome Atlas. The Expression Atlas database is an open source database to analyze protein expression using a quantitative comparative analysis of RNA-Seq data sets including NCBI’s Gene Expression Omnibus, NIH Epigenomic Roadmap, and Genotype-Tissue Expression (GTEx vs 6). Normalization of each study processed using iRAP pipeline to provide a first level FASTQ-QC processing, alignment, and gene expression quantification. Data are further normalized for co-expression baseline analysis using TopHat. 30
Antibodies
Primary antibodies for immunoblotting were anti-NHE1 mouse, anti-β-actin mouse, anti-CHP1 rabbit, and anti-CHP2 rabbit and purchased from Santa Cruz Biotechnology Inc. (NHE1 and β-actin), Origene Technologies Inc. (CHP1), and Sigma-Aldrich Inc. (CHP2). Anti-mouse secondary antibody was purchased from Santa Cruz Biotechnology Inc., and anti-rabbit secondary antibody was purchased from Sigma-Aldrich Inc.
Immunoblotting sample preparation
Patient samples and cell lines were harvested in phosphate-buffered saline (PBS) and centrifuged. The pellet was resuspended in NP-40 lysis buffer (100-mM Tris-HCl, 1.0% NP-40, 150-mM NaCl, pH 7.5) containing protease inhibitor cocktail (VWR®). After centrifugation, samples were pushed through a 27-guage needle then recentrifuged. Supernatant was added to sample buffer (4X Laemmli Sample Buffer, Bio-Rad Laboratories, Inc.), and a sample of the supernatant was taken for a protein quantification assay (Microplate BCA™ Protein Assay Kit, ThermoScientific®).
Immunoblotting
Samples were run through 10% and 12% polyacrylamide SDS PAGE gels and transblotted onto PVDF membranes (Amersham™Hybond™, GE Healthcare Life Sciences, Inc.). After blocking non-specific binding (bovine serum albumin in PBS with NaN3), membranes were incubated in primary antibodies (1:1000 for NHE1 and β-actin, 1:500 for CHP1 and CHP2) overnight at 4°C. Membranes were rinsed and incubated in appropriate secondary antibodies (1:10,000) then visualized by chemiluminescence (Rockland, Inc.). Signal intensity was measured using a transilluminator system (UVP, Inc. EC3 Imaging System), and analysis was done with VisionWorks® software. Knockdown verification western blots were exposed to x-ray film for 10 min and developed using a x-ray developer.
TissueScan Cancer qPCR Arrays
Lung cancer patient data were obtained using TissueScan Cancer qPCR Arrays from Origene. The array included matched pairs of non-tumor and tumor samples loaded with DNA normalized to β-actin control. Relative Expression was calculated standardizing expression to the lowest expressing tissues in the array.
XTT proliferation assay
Cell proliferation assay was performed by the reduction of XTT (2,3-bis(2-methoxy-4-nitro-5-sulfophenyl)-2H-tetrazolium-5-carboxyanalide) from Trevigen (Gaithersburg, MD). H1299, NHE1KD, and CHP2KD cells were plated at 2500 cells/well in a 96-well plate and incubated for 4 h to allow for attachment. Then, the cells were incubated in either RPMI media containing 10% FBS or 0.5% FBS. After 48 h, activated XTT reagent was added to each well to attain a final concentration of 0.3 mg/mL and absorbance was read at 450 and 690 nm.
Electric cell-substrate impedance sensing migration assay
Using the electric cell-substrate impedance sensing (ECIS) Z system (ECIS® Z, Applied Biophysics Inc.), impedance was measured to characterize migration rates in H1299, NHE1KD, and CHP2KD cell lines. Cells were seeded at 100,000 cells/well in 8-well arrays (8W1E-PET) in RPMI medium containing 10% FBS. For 10% FBS assays, cells were grown to confluency for approximately 24 h before a 16,000-Hz shock for 20 s was sent to the 250-µm diameter electrode located in the middle of each well. Cell death occurred only to the cells attached to the electrode. Impedance was measured in real time as cells migrated onto the electrode. For 0.5% FBS assays, cells were seeded in high serum media and replaced with low serum media after approximately 21 h. At the 24-h point, the electrode was shocked same as before and impedance was measured as cells migrated back onto the electrode.
pH i determination
Steady-state pH i was measured using 2′,7′-bis-(carboxyethyl)-5-(and-6)-carboxyfluorescein (BCECF), a pH-sensitive fluorescent dye. Cell monolayers were cultured in multi-well dishes and treated with experimental treatment conditions as described. Prior to pH i determination, cells were incubated with 10-µM BCECF (BCECF-AM, Molecular Probes) in PBS for 10 min at 37°C and 5% CO2. BCECF solution was replaced with DMEM media (without bicarbonate) with or without serum depending on treatment to remove free dye and incubated at 37°C and 5% CO2 for 10 min at before imaging. Fluorescence was measured using a fluorescent plate reader (ThermoFisher Scientific Fluoroskan Ascent Fluorescence 96/384 Well Plate Reader) at 440:527- and 485:527-nm excitation:emission corresponding with pH independent and pH dependent regimes of BCECF excitation, respectively. pH i was calculated by taking the fluorescence intensity ratio of pH independent over pH dependent fluorescence compared to an internal K+-Nigericin calibration curve from each well. Curves were generated by incubating cells in buffered 50-µM Nigericin (130-mM KCl, 20-mM NaCl, 10-mM MgCl2, 15-mM glucose, 10-mM HEPES, 10-mM PIPES, 50-µM nigericin, pH 6.5 or 7.5) for 5 min and measuring BCECF fluorescence.
NH4Cl acid load and recovery
Intracellular acidification was induced using a
Anchorage-independent growth assay
Six-well tissue culture plates were prepped with three layers. The bottom layer consisted of 0.5% agar/1X RPMI media, the middle layer consisted of 0.35% agarose/1X RPMI media/250,000 cells (H1299, NHE1KD, or CHP2KD), and the top layer was 1X RPMI media which was replaced every 2–3 days to feed cells. Note that 1X RPMI media contained either 10% FBS or 0.5% FBS. Plates were incubated at 37°C and 5% CO2 for 28 days to allow formation of spheroids in bottom agar layer. The top media layer was replaced with a 0.005% crystal violet solution. Spheroids were counted and sized as large (>450 µm), medium (300–450 µm), or small (150–300 µm) using a stage micrometer.
Tumor formation in vivo
Eight-weeks-old athymic nude mice (Harlan, Indianapolis, IN) were used conforming to guidelines laid down by the National Research Council and approved by Minnesota State University Moorhead Institutional Animal Care and Use Committee. Mice were kept in laminar-flow cages in standardized environmental conditions. Sterilized food (Harlan, Indianapolis, IN) and water were supplied ad libitum. H1299, NHE1KD, and CHP2KD cells were harvested at near confluence with trypsin/EDTA solution. Each animal received a solution containing 200 µL of cells suspended in PBS (totaling 2 × 10⁶ cells per injection) injected into the subcutaneous rear flank of five mice per cell type. Mice were euthanized after 15 days, and tumor weight and dimensions were measured. Tumor volume was calculated based on sphere (V = 0.4 × A × B).
Results
Expression profiles of NHE1, CHP1, and CHP2 in normal tissues
Previously, immunoblotting and RT-PCR techniques have demonstrated that NHE1 and CHP1 are ubiquitously expressed in human tissues while CHP2 is primarily expressed in the intestinal epithelium and in diseased cells including hepatoma, colon AC, cervical carcinoma, and acute leukemia as well as in breast, ovarian carcinoma, and lung cancer.17,23,24,29 These methods have sampled CHP2 specifically in a limited subset of tissues and cancer types. To comprehensively understand the expression profiles of NHE1, CHP1, and CHP2 expression in non-diseased normal tissues, we analyzed archived RNA-Seq data from the Expression Atlas31,32 (Figure 1(a)). Consistent with previous findings, NHE1 and CHP1 expression was clear across all tissues sampled, which is consistent with immunohistochemical datasets. In contrast, CHP2 expression profiles showed variation across tissues. Most tissues showed little or no detectable expression while a handful of tissues, notably the small intestine, duodenum, rectum, zone of skin, and colon show significant baseline CHP2 expression which is also consistent with immunohistochemical data. 33 These data show that CHP2 exhibits a unique expression profile in non-diseased tissues with large variance across tissues types. This analysis also reveals that CHP2 expression is not limited to the intestinal epithelium as assumed by other studies, showing expression in the skin, colon, urinary bladder, testis, pons, kidney, and prostate gland.
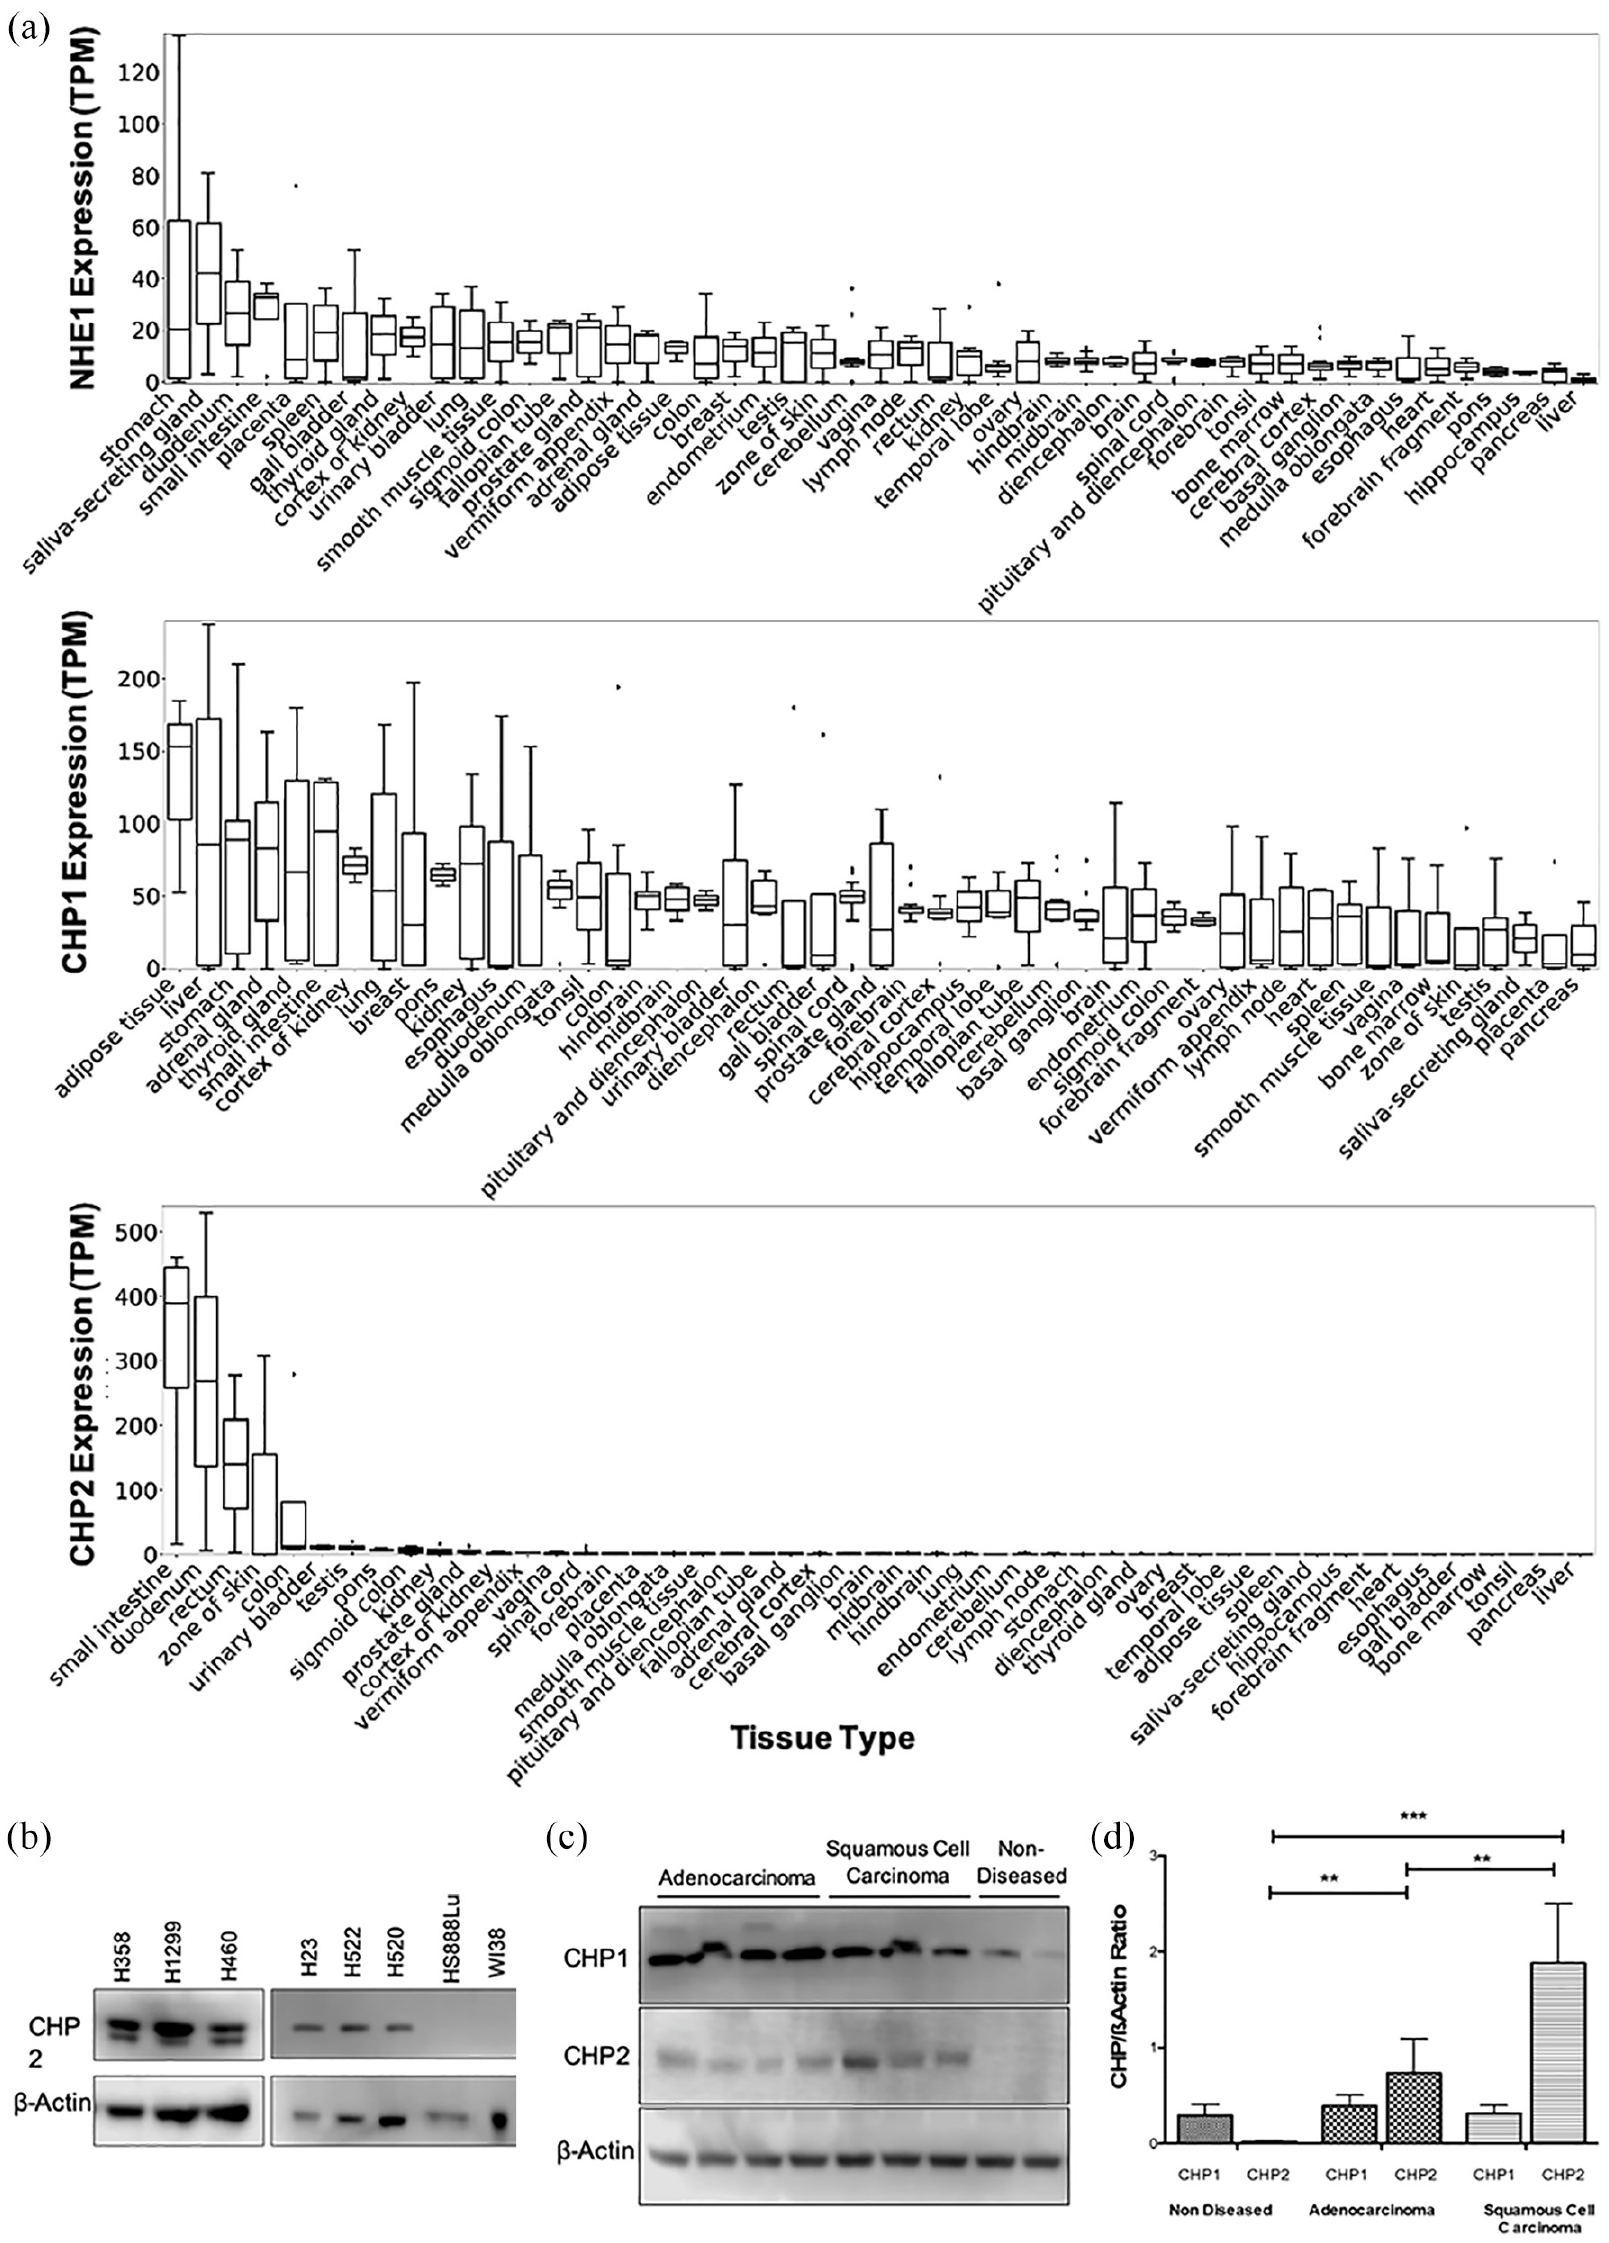
Normalized RNA-Seq expression analysis of normal human tissue for NHE1, CHP1, and CHP2. (a) Normalized RNA-Seq analysis from non-diseased, normal human tissues was determined from 122 individual human tissue samples aggregated from 30 baseline studies. Normalization of each study was processed using iRAP pipeline to provide a first level FASTQ-QC processing, alignment, and gene expression quantification. Data are further normalized for co-expression baseline analysis using TopHat. Baseline expression was determined using NIH Road Map, 32 Uhlen’s Lab, and GTEx RNA-Seq public databases of tissues from human adult patients. Databases analyzed and normalized by EMBL-EBL Expression Atlas to allow qualitative comparisons between database sets. (b) Western blot analysis of NSCLC cell lines. Tested 50 µg of cultured cell lysates for each sample against house-keeping gene β-actin and CHP2. (c) 50 µg of lysate from adenocarcinoma, squamous cell carcinoma, and non-diseased tissues were probed for CHP1, CHP2, and β-actin as a control. (d) Ratio of CHP to β-actin expression was determined after quantitative analysis of bands with background correction from Western blot. A one-way repeated measures ANOVA with Tukey post-test was performed with 99% CI p < 0.01 (**) for all columns. Total CHP1 (n = 26) is detected across all tissues, while CHP2 (n = 42) was detected in significantly higher levels in either adenocarcinoma or squamous cell carcinomas as compared to controls.
Expression profiles of CHP1 and CHP2 in lung cancer
Expression data for CHP2 in malignantly transformed cells are limited. To provide experimental evidence for the difference in CHP2 protein expression in diseased lung cell lines, we immunoblotted for CHP2 in six lung carcinomas and two non-diseases normal lung cell lines. All three carcinoma cell lines (H358, H1299, H460), both AC cell lines (H23, H522) and the SCC cell line (H520) displayed CHP2 expression while the two non-diseased normal lung cell lines (HS888LU and WI38) showed no detectable CHP2 expression (Figure 1(b)).
To confirm the pathological relevance of CHP2 expression in NSCLC, we then screened a series of non-paired, normal, and lung cancer tissue samples collected from patients (USD IRB—samples obtained from Cooperative Human Tissue Network Tissue Bank). We identified an increase in CHP2 expression in two prominent forms of NSCLC, AC and SCC (Figure 1(c)). CHP1 expression was not statistically different between non-diseased, AC, and SCC samples; however, expression of CHP2 was significantly greater in AC and squamous cell carcinoma (SCC) versus non-diseased human lung tissues (Figure 1(c)). In addition, SCC showed twofold greater CHP2 expression than AC. We then used qPCR to measure the expression of CHP2 in matched patient samples (adjacent non-diseased and tumor cells) from patients with SCC. Five of the seven patients displayed greater than twofold higher CHP2 expression in SCC than in the normal adjacent tissue (Figure 1(d)).
CHP2 expression is sensitive to serum deprivation
Western blot analysis was used to evaluate changes in expression levels of NHE1, CHP1, and CHP2 during serum depletion over 24 and 48 h in H1299 cells. Lysate samples of H1299 cells grown in normal serum conditions were used as controls. NHE1 and CHP1 expression remained constant 48-h time course of serum depletion (Figure 2(a)). Expression of CHP2 in H1299 cells increased after 24 h of serum depletion then decreased at 48 h but remained elevated over control levels (Figure 2(b)). Normalized gene expression was calculated after qPCR amplification of NHE1, CHP1, and CHP2 RNA extracted from H1299 cells grown in either 10% or 0.5% FBS conditions. After 24 h of serum depletion, CHP2 expression increased by greater than 15-fold while NHE1 and CHP1 expression increased by less than two-old (Figure 2(c)). These results indicate that CHP2 expression increases after 24 h of serum depletion and support the role of CHP2 as a survival protein for cancer cells in developing tumors. The disparity between changes in protein expression and mRNA are either due to changes in RNA half-life or possibly increased protease activity on CHP2. One explanation may be the limited quantitative nature of an immunoblot. However, a simple analysis of CHP2 proteolytic sites reveals more than 46 putative sites of hydrolysis. While this may explain the lack of observed protein expression compared to mRNA levels, a buffering, or lack of coordination between protein expression and mRNA changes have been seen in many proteins in a range of tissues. This could be a mechanism to buffer changes in protein expression in response to hypoxia or another stimuli. 33

Expression of NHE1, CHP1, and CHP2 in serum-deprived H1299 cells. (a) Western blot of CHP1, CHP2, and NHE1 in H1299 cells. Samples were extracted from H1299 lung fibroblasts after 24 and 48 h in 10% FBS or 0.5% FBS in RPMI at 37°C, 5% CO2. (b) Vision Works® LS Analysis Software was used to measure the ratio of protein expression compared to β-actin controls. 24- and 48-h ratios were normalized to the control. For NHE1 and CHP1 n = 3 and CHP2 n = 5. A 1-way ANOVA and post hoc, Bonferroni pairwise t-test was used to detect difference between groups. (c) Normalized gene expression (NGE) calculated as 2−ΔΔCT. No expression change (N.G.E. = 1) shown as a blue line. RNA extracted from H1299 cells grown in 10% FBS or 0.5% FBS for 24 h. DNA concentration of 50 µg with β-actin, NHE1, and CHP1 primers (Biorad) and CHP2 primer (Qiagen). Data were normalized to β-actin. Values are means ± SEM (n = 3), **p < 0.01, *p < 0.1 by two-tailed Student’s t-test. (d) Knock down verification. H1299 cell lines with stable NHE1 or CHP2 KD siRNA showing successful knockdown in both lines.
To evaluate the effects of NHE1 and CHP2 expression on NSCLC progression, we produced two stably transfected shRNA knockdown cell lines from H1299 lung fibroblasts lacking either NHE1 expression (NHE1KD) or CHP2 expression (CHP2KD). The cell lines were immunoblotted to determine the expression of NHE1, CHP1, and CHP2. The NHE1KD cell line expressed CHP1 and CHP2 but not NHE1, while the CHP2KD cell line expressed NHE1 and CHP1 but not CHP2 (Figure 2(d)).
Effects of serum deprivation and NHE1/CHP2 expression on NSCLC cell proliferation and migration
Regulation of cellular proliferation is partly driven by NHE1 activity. 34 Here, we show that lack of NHE1 expression significantly reduces proliferation and migration in stimulated and unstimulated H1299 cells (Figure 3(a)). We also show that lack of CHP2 reduces proliferation similarly to NHE1 knock down where CHP2 KD cells in normal serum conditions show similar proliferation rates to wild-type H1299 cells grown in low serum conditions.

Impact of NHE1 and CHP2 expression on cell adaptation to serum deprivation. (a) Cell proliferation of H1299 wild type, NHE1 KD, or CHP2 KD cells was measured using activated XTT proliferation reagent after 48 h in medium containing 10% FBS or 0.5% FBS. Statistical analysis using 1-way ANOVA followed by a pairwise t-test (*p < 0.05). Error bars represent SEM (3 biological replicates, n = 8). (b) ECIS 8W1E PET migration arrays. Each trace was averaged for 4 wells per cell type and condition. Normalized trace of H1299, NHE1KD, and CHP2KD migration in 10% FBS. (c) 10% FBS migration trials 4 h after shocking (n = 3). NHE1KD and CHP2KD normalized to H1299. Error bars show SEM. (d) Normalized trace of H1299, NHE1KD, and CHP2KD migration in 0.5% FBS. (e) 0.5% FBS migration trials 4 h after shocking (n = 3). H1299, NHE1KD, and CHP2KD normalized to H1299 in 10% FBS. Error bars show SEM.
NHE1 is reported to translocate to the leading edge of migrating cells indicating NHE1’s importance in cell migration. 35 To observe the impact of NHE1 and CHP2 on cell migration during nascent tumor formation, ECIS migration analysis was carried out in H1299, NHE1KD, and CHP2KD cell lines under normal serum (10% FBS) and low serum (0.5% FBS) to mimic the nascent tumor environment. Four hours after shocking, H1299 cells in the presence of 10% FBS migrated at a faster rate than either the NHE1KD or CHP2KD cell lines under the same condition (Figure 3(c)). H1299 cells in 0.5% FBS migrated slower than H1299 in 10% FBS; however, these cells maintained a faster migration rate than both NHE1KD and CHP2KD cells in 0.5% FBS (Figure 3(e)). Lack of NHE1 expression impacts migration rates in H1299 cells. H1299 cells that lack only CHP2 expression and not NHE1 also migrate at slower rates. This indicates CHP2 is responsible for activating NHE1 leading to increased migration of NSCLC.
Effects of NHE1 and CHP2 expression on NSCLC pH i
Activated NHE1 increases pH i by increasing H+ efflux. 36 This elevated pH i and concomitant acidification of pH e are essential events in the regulation of proliferation, migration, and invasion.7,10,37 To measure the impact of serum depletion on NHE1 activity, steady-state pH i and acid load recovery assays were carried out. pH i was measured throughout 48 h of serum depletion in H1299 cells. After 48 h of serum depletion, pH i significantly decreased by approximately 0.25 pH units (Figure 4(a)). This suggests NHE1 activity decreases when serum is not present. A known inhibitor of NHE1, 5-(N-ethyl-N-isopropyl) amiloride (EIPA), in conjunction with serum was used to assess the effects of NHE1 on pH i . With the absence of serum and presence of EIPA, pH i was significantly lower than when serum was present without EIPA or both serum and EIPA were present (Figure 4(b)). The impact of EIPA on pH i in H1299 cells is statistically equal to the impact of serum deprivation. pH i was also evaluated in the absence and presence of serum in H1299, NHE1KD, and CHP2KD cell lines. Lack of NHE1 and CHP2 expression lowered pH i in 10% and 0.5% FBS media (Figure 4(c)). CHP2KD cells in the presence of serum are at the same pH i level as H1299 cells without serum. This clearly indicates the importance of CHP2 in maintaining steady-state pH i through NHE1 activation. The rate of recovery from an intracellular acid load was also evaluated in H1299, NHE1KD, and CHP2KD. pH i was acidified to 6.65, and the rate of recovery to normal pH was measured over 60 s. H1299 cells returned to a steady state of 7.10 pH units during that time demonstrating a substantially enhance rate of pH recovery than both the NHE1KD and CHP2KD cells which remained at a pH of approximately 6.8 following 60 s of recover (Figure 4(d)). These results indicate that CHP2 expression plays a major role in the regulation of pH i in NSCLC cells.

Steady-state and real-time intracellular pH measurement in H1299, NHE1KD, and CHP2KD cell lines. (a–d) A type two mixed measure ANOVA was measured with a post Tukey analysis of p < 0.001***, pH measured using 10-µM BCECF, fluorescence measured at 440:527 and 485:527. pH calculated using an internal calibration curve. Error bars show SEM. (a) pH i measured in H1299 cells in 0.5% FBS over 48 h. (b) H1299 cells exposed to a combination of 10% FBS (+), 0.5% FBS (−), NHE1 inhibition (1-mM EIPA) (+); n = 3. (c) Comparison of H1299, NHE1KD, CHP2KD cell in either 10% FBS (+) or 0.5% FBS (−) for 12 h; n = 8 (d) Acidification was induced in H1299, NHE1KD, and CHP2KD cells using buffered NH4Cl. Cells were treated with sodium free choline chloride buffer to lock pH, then with buffered sodium chloride solution to initiate sodium dependent proton transport at t = 0 (n = 12).
Experimental modeling of tumorigenicity dependence on NHE1 and CHP2
NHE1 has been found to impact spheroid growth in breast cancer cells. 38 Using a soft agar assay, we evaluate the effects of NHE1 and CHP2 on anchorage-independent growth in NSCLC. Soft agar assays were set up in both normal and depleted serum conditions for H1299, NHE1KD, and CHP2KD cells. Spheroids were counted and sized after 28 days. Cells lacking NHE1 or CHP2 formed a significant number of small sized spheroids, just as the H1299 cells did; however, few to no medium and large sized spheroids formed in either 10% or 0.5% FBS whereas the H1299 cells were able for form an average of 50 spheroids per well in 10% FBS (Figure 5(a)). These data again support the central role of NHE1 and CHP2 in cancer progression in NSCLC.

CHP2 expression impact on anchorage-independent growth in vitro and tumorigenesis in vivo. (a) A soft agar assay was used to evaluate the effects of NHE1 and CHP2 expression on anchorage-independent growth. Crystal violet was used to visualize cell masses. Large masses measured at 450 µm+, medium masses measured 300–450 µm, and small masses measured 150–300 µm. (b) Injections were subcutaneous rear flank in 5 athymic mice per cell type. Images provided show xenograft tumor growth for all mice. (c) Tumor volume calculated based on a sphere (V = 0.4 × A × B).
Tumor formation in vivo was assessed by subcutaneously injecting H1299, NHE1KD, and CHP2KD cells into five athymic nude mice for each cell type. Mice were sacrificed after 15 days that the tumors were extracted and measures. All five mice injected with H1299 cells grew significant tumors at the injection site. Only one mouse injected with NHE1KD cells grew a significant tumor, while no mice injected with CHP2KD cells formed tumors (Figure 5(c)). These data indicate the importance of CHP2 in tumor formation in vivo and support the pursuit of CHP2 as a potential therapeutic target for the treatment of NSCLC.
Discussion
Non-diseased NHE1, CHP1, and CHP2 expression profiles
NHE1 regulates cancer progression in a broad range of solid tumors.4,5,10,11 Of the numerous protein and lipid cofactors that regulate NHE1, CHP1 and CHP2 are essential in regulating transport activity and proton set point, along with modulating cell behaviors.10,16,29 Ubiquitous NHE1 and CHP1 expression in human tissues facilitates pH homeostasis and alleviates acid stress by driving proton efflux, while CHP2 expression allows for increased proton efflux both in non-diseased tissues like the intestinal epithelium and in diseased-induced acidification as seen during tumorigenesis.8,10,16,18 Existing work did not examine a wide range of non-diseased tissues or used less sensitive techniques resulting in a limited understanding of CHP2 expression. 17 To expand on several focused studies of CHP2 expression, we directly compared RNA sequencing profiles of CHP2 expression with NHE1 and CHP1 expression in normal tissues.17,36,23,24 As expected, NHE1 and CHP1 expression is ubiquitous across many human tissues with most tissues expressing high levels of NHE1 and all tissues expressing high levels of CHP1 while CHP2 was found at nonexistent or low levels in most normal tissues (Figure 1(b)) with 7 of 32 tissues showing no expression level. This analysis shows that high levels of CHP2 expression were not only found in large and small intestinal epithelium, but also in the colon, spinal cord, testis, trunk, leg, suprapubic skin, and tibia nerve. This suggests either vestigial expression or functional roles for CHP2 in these tissues and, with further testing, may implicate CHP2 in the metastatic nature of testicular and colon cancers.
NHE1, CHP1, and CHP2 expression in lung cancer
CHP2 is activated during tumorigenesis in a subset of cancer types where expression of CHP2 correlates to poor patient outcomes.17,23,24,29 To investigate CHP2 expression in lung cancer, we measured CHP2 expression in paired and unpaired-patient samples as well as in NSCLC cell lines showing that patients with SCC showed a greater than twofold increase in diseased compared to adjacent non-diseased tissue (Figure 1(b)). In non-paired patient samples, all AC and SCC patients showed distinct CHP2 expression, while the two non-cancerous tissue samples displayed no expression (Figure 1(c)). Finally, in CHP2 levels were elevated in three carcinoma cell lines, two AC cell lines, and one SCC cell line while no expression was identified in two normal lung cell lines (Figure 1(d)). These data demonstrate that CHP2 expression levels are elevated in both AC and SCC from patient samples and cell lines. The examination between patient diseased and non-diseased samples shows that in non-cell culture conditions CHP2 expression increases concurrent with the progression of disease. The work also suggests a function for CHP2 expression regulation, independent of CHP1 and NHE1 expressional regulation, in promoting or maintaining tumor viability during tumorigenesis in some but not all tumor populations. This function likely acts via NHE1-CHP2 interaction to maintain pH i and may involve other signaling pathways like AKT/PKB to control cell proliferation and cell cycle. 29 Because this expression pattern is present in only a subset of cancers, it is likely a driver of tumorigenesis, but not necessary for cancer progression and may provide a general mechanism for increased tumorigenesis and metastasis across cancer types.
CHP2 expression is induced during serum deprivation
Low nutrients in the TME, modeled using serum deprivation, is a known feature of early tumorigenesis.3,39 CHP2 directly supports NHE1 proton export 26 and during serum deprivation in cultured lung cancer cell lines, exogenous expression of CHP2 protects cells from apoptosis by increasing proton efflux 17 suggesting that CHP2 expression may play a role in responding to extracellular serum conditions. Earlier work showed that overexpression of CHP2 and not CHP1 would rescue cells from acidic conditions, but did not show if this occurred at endogenous expression levels in cancer cells responding to cancer microenvironmental challenges. To test if CHP2 expression responds to changes in serum levels in lung cancer, we measured CHP2 protein and mRNA expression using Western blot analysis and qPCR, demonstrating that CHP2 expression increased during the first 24 h of serum deprivation while CHP1 and NHE1 expression remained constant (Figure 2(a)–(c)). Elevation of CHP2 expression is transitory, with levels of CHP2 decreasing between 24 and 48 h then remaining elevated above normal serum conditions after 48 h of serum deprivation. Because expression levels of both NHE1 and CHP1 remain constant, these data suggest for the first time, that CHP2 expression can be modulated in response to low serum to modulate pH i homeostasis in response to external factors in a poorly irrigated nascent tumor environment. 39
Proliferation and migration
NHE1 plays a central role in the regulation of cell proliferation through intracellular calcium signaling in diseased and non-diseased tissues where NHE1-induced alkalization of pH i and concurrent calcium oscillation is a required permissive step in the regulation of cell proliferation.8,40,41 In HEK293, ovarian cancer, and breast cancer cells, expression of CHP2 elevates cell proliferation and migration17,23,29 while in HepG2 cells, knockdown of CHP2 cells inhibits cell proliferation. 22 It is suggested CHP2 independently activates proliferative signaling pathways and NHE1 independently activates cell cycle progression and migration, but it is unclear how CHP2 and NHE1 work together to activate cell proliferation and migration. In addition, knowing that CHP2 is upregulated during serum deprivation, we were interested in how low serum conditions, as experienced by the nascent tumor, can drive proliferation to determine if CHP2-dependent NHE1 function is a driver of tumor growth and metastasis in these conditions.
To test the role of CHP2 in proliferation during serum deprivation, we measured cell viability using an XTT Assay in cells lacking NHE1 (NHE1KD) or lacking CHP2 (CHP2KD) in the presence or absence of serum. Cells grown in normal serum conditions (10% FBS) displayed high viability and growth (Figure 3(a)). When either NHE1 or CHP2 were absent, cells displayed a twofold decrease in proliferation. Proliferation was further reduced when cells were exposed to low serum conditions (0.5% FBS) suggesting that in serum-deprived conditions NHE1 and CHP2 contribute to maintaining cell proliferation and viability.
This trend is preserved when evaluating cell migration. NHE1 also coordinates migration and invasion, two essential characteristics that are dysregulated during metastatic transformation.5,10,42,43 Migration as evaluated by ECIS showed that cells lacking either NHE1 or CHP2 were less capable of migration in high or low serum environments (Figure 3(b)–(e)). Surprisingly, H1299 cells under serum deprivation can eventually adapt to low serum conditions showing slow migration while neither NHE1KD nor CHP2KD cells show migration over 12 h of serum deprivation. These data together suggest that CHP2, likely acting through NHE1, plays a role in maintaining cell proliferation and migration in low nutrient environments.
pH
NHE1 is also a primary regulator of pH i homeostasis in both normal and cancer cells,4,5,10 and CHP2 overexpression in an NHE1 expressing background allows for acute pH i restoration after serum deprivation. 17 To investigate the role of CHP2 in recovery from intracellular acidification upon serum deprivation, we used a fluorescent reporter to ratiometrically measure steady-state pH i during serum deprivation in the presence or absence of NHE1 or CHP2. We showed that prolonged serum deprivation causes a time-dependent acidification in H1299 lung cancer cells (Figure 4(a)) and that inhibition of NHE1 using a small molecule inhibitor reduces the cells ability to overcome acidosis associated with serum deprivation (Figure 4(b)). Comparing genetic knockouts lacking NHE1 or CHP2, we see that NHE1 and CHP2 both account for a significant portion of proton efflux in normal and low serum conditions (Figure 4(c)). To determine if the effect on steady-state pH is a result of reduced proton efflux rate, we also measured real-time pH i recovery after acute intracellular acidification (Figure 4(d)). Cells without NHE1 or CHP2 were severely impaired in their ability to reestablish pH i homeostasis even though CHP1 remained expressed at normal levels.
These data demonstrate the central role of NHE1 in pH regulation in NSCLC particularly during long-term serum-deprived conditions, like that in a prevascularized solid tumor, and implicate CHP2 expression in the time-dependent response to serum deprivation. When cells are challenged with acid stress, CHP2 appears to provide regulation of NHE1 activity, without which cancer cells are less able to maintain steady-state pH i or quickly export protons as seen in the CHP2 knockout cells. Maintaining these factors is necessary for survival during acidosis and for acidification of the extracellular space during cell migration and metastasis.2,6,12,44 These data also show a correlation between pH i regulation, proliferation, and migration suggesting that in the absence of CHP2, dysregulation of pH homeostasis likely contributes to reduced cell proliferation and migration (Figure 3). Furthermore, while other studies indicate that CHP2-NHE1 support these functions, these studies were conducted in overexpressing systems in breast or other cell types. Here, we show that in lung cancer cells endogenous levels of CHP2 is required for NHE1-related functions and that CHP1 alone could not recover a functional loss of CHP2.
Anchorage-independent growth and tumor formation in vivo
CHP2 expression leads to increased proliferation, migration, and pH i maintenance under serum-deprived conditions. To determine if these features contribute to the tumorigenicity and metastatic potential of tumor growth in situ and in vivo, we tested anchorage-independent growth and xenograft tumor growth of cells lacking NHE1 or CHP2 (Figure 5). Using a soft agar growth assay, we observed the average size and number of large, medium, and small colonies formed in the presence and absence of serum. Cells expressing both NHE1 and CHP2 grown in low serum formed fewer large and medium colonies than those grown with serum (Figure 1(a), left) suggesting that in serum-deprived conditions tumor size is restricted due to the accessibility of nutrients and the ability for cells to mitigate acid stress as tumor size increases.
In cells lacking NHE1, cells grown in normal serum form occasional large tumors, some medium tumors, and mainly small tumors while in serum-deprived conditions are exclusively able to form small tumors (Figure 5(a), middle). This suggests that without NHE1, the viability of medium and large tumors is severely impaired due to an inability to regulate pH i in poorly irrigated larger cell masses. 39 This is similarly true in CHP2 deficient cells where large and medium tumors are largely absent in either high or low serum conditions. Surprisingly, CHP2KD cells form almost exclusively small tumors regardless of serum conditions suggesting that even with NHE1 expression, CHP2 depletion is sufficient to prevent large tumor formation in situ.
To determine if these features hold true in vivo during tumor formation in a complex tissue environment, we measured tumor formation of the above cell lines in a xenograft nude mouse mode. Cells expressing NHE1 and CHP2, when injected into the mouse flank, formed visible tumors of significant volume and mass (Figure 5(b) top, (c)). In agreement with our soft agar tumor formation studies, NHE1KD cells showed impaired tumorigenicity forming smaller tumors (Figure 5(b) middle, (c)) and surprisingly CHP2 cells showed no visible tumor formation in any animal tested (Figure 5(b) bottom, 5(c)). These results suggest that CHP2 plays other roles in addition to stimulating NHE1 during nascent tumor formation that permit tumor growth in serum-deprived environments. These data clearly demonstrate a multifaceted and longitudinal role for CHP2 expression in tumor formation and cancer progression in NSCLC indicating the potential for CHP2 as a therapeutic target.
Conclusion
Overall, this study argues for the potential of CHP2 as a major driver of tumor survival and growth during nascent tumor formation. We show for the first time that CHP2 in non-diseased cells has potential to regulate cell viability and more critically that while CHP1 was expressed, modulation of CHP2 is likely responsible for driving NHE1-related cancer cell behavior. This study shows that cells can shift genetic expression of CHP2 to respond to tumor progression where CHP2 expression is increased in low serum conditions to support tumor cell survival. Yet unknown is the potential for other factors (outside of simple expression) to drive CHP2-NHE1 binding and activity. At physiological calcium concentrations, both CHP isoforms bind to NHE1 with nearly the same nanomolar affinities 45 similar to our work with recombinant proteins (data not shown). While quantitative comparisons CHP1 and CHP2 levels are sparse, a review of the protein abundance database (PAX-db.org) identifies that for a handful of non-diseased tissues the ratio of CHP1:CHP2 expression ranges from 6 to over 30 in the same tissue. 46 Integrated over whole organism (Homo sapiens), the ratio ranged from 60 and 217, to 1366. 47 As shown here, the baseline for CHP2 expression is higher for diseased tissues and cells and a doubling or more of the CHP2 expression is critical to observe CHP2-related effects. Thus, CHP2 can clearly drive NHE1-related behavior but, based on similar binding affinities of CHP for NHE1, protein expression alone may not be the mechanism for CHP2 survival in low serum. It is therefore enticing to think that the factors driving increased CHP2 expression also induce post translational modifications driving preferential CHP2 binding to NHE1 which has not been observed in earlier overexpression studies. There are three documented phosphorylation sites in common between CHP1 and CHP2 while three and four sites are unique to CHP1 and CHP2, respectively, suggesting that environmental cues could impact both the expression level and affinity of both CHP isoforms for NHE1.
An additional potential outcome of CHP1/CHP2 regulation could be that CHP1, displaced by CHP2 and no longer sequestered by NHE1, could have a secondary intracellular or nuclear role further coordinating cancer cell survival. These data taken together also suggest the therapeutic potential of CHP2-based therapies for the treatment of a subset of CHP2 expressing NSCLC and likely additional cancer types. We have demonstrated that elevated expression of CHP2 in NSCLC supports increased proliferation, migration, and alkalinization of steady-state pH i , as well as increased anchorage-independent growth in situ and tumor formation in vivo. It is interesting that loss of either CHP2 (but not CHP1) or NHE1 did not abrogate tumor formation in soft agar studies, rather limited the mass potential of tumor growth. This was also observed in our mouse studies where tumor burden and volume were significantly limited showing for the first time that tumor progression or the ability of tumors to respond to tumor microenvironmental challenges requires CHP2-NHE1 expression. To take advantage of this potential, further investigations into the differential binding characteristics of CHP isoforms to NHE1 will be essential as the goal of a therapeutic modality will be to block CHP2 binding while leaving other binding intact to support baseline NHE1 function in non-diseased tissues.
Footnotes
Author’s note
Kristine Kay Anderson is now affiliated with Department of Chemistry and Biochemistry, Minnesota State University Moorhead, Moorhead, MN, USA.
Declaration of conflicting interests
The author(s) declared no potential conflicts of interest with respect to the research, authorship, and/or publication of this article.
Funding
The author(s) received no financial support for the research, authorship, and/or publication of this article.