
Abstract
The plasmacytoma variant translocation 1 gene (PVT1) is a large non-coding locus at adjacent of c-Myc, and long non-coding RNA PVT1 is now recognized as a cancerous gene co-amplified with c-Myc in various cancers. But the expression and functional role of PVT1 in colorectal cancer are still unelucidated. In addition, all the reported long non-coding RNAs so far are discovered in either cells or tissues, but no research about long non-coding RNAs detection in extracellular vesicles has been reported yet. In the present study, we firstly investigated the expression of PVT1 in colorectal cancer specimens and its correlation with the expression of c-Myc and other related genes by real-time polymerase chain reaction. Then, we isolated the extracellular vesicles from colorectal cancer cells culturing medium by differential centrifugation and detected the PVT1 expression in extracellular vesicles by using real-time polymerase chain reaction. The PVT1 targeting siRNA was transfected into SW480 and SW620 cells, and 3-(4, 5-dimethylthiazol-2-yl)-5-(3-carboxymethoxyphenyl)-2-(4-sulfophenyl)-2H-tetrazolium assay and flow cytometry were used to evaluate the cell proliferation and apoptosis. The results showed that the PVT1 expression in tumor tissues was higher than that in normal tissues, which was significantly correlated with the expression of c-Myc and three c-Myc regulating genes FUBP1, EZH2, and NPM1 and also correlated with the expression of two other PVT1-associated transcript factors nuclear factor-κB and myocyte-specific enhancer factor 2A. Here, we reported for the first time that PVT1 as a long non-coding RNA was successfully detected in extracellular vesicles excluded from SW620 and SW480 cells, and the expression level of PVT1 was higher in extracellular vesicles from the more aggressive cell SW620 than from SW480. The results also showed that by down-regulating the PVT1 expression, the c-Myc expression was suppressed, the cell proliferation was inhibited, and cell apoptosis was increased. Taken together, these findings implicated that PVT1 may be a new oncogene co-amplified with c-Myc in colorectal cancer tissues and extracellular vesicles and functionally correlated with the proliferation and apoptosis of colorectal cancer cells.
Introduction
In recent years, numerous cancer-related long non-coding RNAs (lncRNAs) have been discovered. However, the function and the regulation of many lncRNAs are still poorly understood.1,2 A large number of these lncRNA transcripts originate from transcription at promoters or other nearby location of protein-coding genes. These lncRNA/messenger RNA (mRNA) gene pairs are interacted with each other in expression and in their functions. 3
Plasmacytoma variant translocation 1 gene (PVT1) is a very large non-coding locus (300 kb) located on human chromosome 8q24 at adjacent downstream of c-Myc locus, producing various spliced non-coding RNAs and a cluster of microRNAs (miRNAs).4,5 The functional relationship between c-Myc and PVT1 has long been discussed.6,7 In PVT1 locus, there are many transcription factor binding sites (data from UCSC website). In addition, c-Myc is one of the PVT1 transcription activators. Alternatively, PVT1 has been implicated as a c-Myc activator. 7 PVT1 is now recognized as a co-amplified gene with c-Myc.8,9 But the expression relationships between PVT1 and other transcription factors still remain elusive.
Recently, the PVT1 expression has been demonstrated to be correlated with cancer. High copy number or overexpression of PVT1 has been detected in acute myeloid leukemia, Hodgkin lymphoma, breast cancer, ovarian cancer, and pediatric malignant astrocytomas.8–14 It is reported that PVT1 is lowly expressed in normal tissue but highly expressed in many transformed cell lines.9,15 Further work has demonstrated that downregulation of PVT1 inhibits proliferation and induces apoptosis in ovarian and breast cancer cell lines and that PVT1 acts as a regulator of chemosensitivity in pancreatic cancer cells.8,9,16,17 The PVT1 expression has also been found to be correlated with poor prognosis in colorectal cancer (CRC). 18
To our knowledge, all the reported lncRNAs, including PVT1, are largely found either in tissues or in cells; lncRNAs are seldom detected in extracellular vesicles (EVs) so far. 19 EVs are small membranous vesicles released by almost all cell types. They are important mediators of intercellular communication, containing a variable spectrum of parental cell informational molecules, including mRNA, miRNA, proteins, and lipids.20,21 We speculated that lncRNA PVT1 can also be contained in EVs and transported from one cell to another.
In this study, we found that PVT1 is co-amplified with c-Myc, and two PVT1-related transcript factors nuclear factor-κB (NF-κB) and myocyte-specific enhancer factor 2A (MEF2A) in CRC and PVT1 expression are regulated by c-Myc. We also found that three c-Myc control genes (FUBP1, NPM1, and EZH2)22–26 are significantly correlated with PVT1 expression. We also demonstrated that PVT1 knockdown affects the proliferation and apoptotic response of CRC cell lines SW620 and SW480.
Interestingly, we additionally found that the lncRNA PVT1 can be detected not only in CRC tissue specimens and cells but also in the EVs excluded from SW620 and SW480 cells in their culturing medium. And the expression level of PVT1 is significantly higher in EVs from SW620, which is the more aggressive cell line, than from SW480.
Materials and methods
Patient samples
Patients with CRC who underwent initial surgery in Our Hospital from 2011 to 2012 were retrospectively selected for this study. Clinicopathological characteristic information for all samples was shown in Table 1. No patient had received therapy before resection. The utilization of the tumor material for research was approved by the Ethical Committee of PLA General Hospital.
Clinicopathological characteristics of colorectal cancer.

M: male; F: female.
Cancer cell lines
The human CRC cell lines SW620 and SW480 were purchased from American Type Culture Collection (Manassas, VA, USA). The SW620 and SW480 cells were cultured in Leibovitz’s L-15 Medium (Gibco, Rockville, MD, USA) containing 10% fetal bovine serum (FBS; Invitrogen, Carlsbad, CA, USA) at 37°C with 5% CO2.
Microvesicle isolation
SW620 and SW480 cells at passage 1–15 were cultured in microvesicle-free medium (Leibovitz’s L-15 containing 10% dialyzed fetal bovine serum (dFBS)), and conditioned medium from 5 × 10⁷ cells was collected after 48 h. EVs were purified by differential centrifugation. In brief, the medium was centrifuged for 15 min at 300g to eliminate cell contamination. Supernatants were further centrifuged for 25 min at 16,500g and filtered through a 0.22-µm filter. EVs were pelleted by ultracentrifugation at 110,000g for 70 min.
EV RNA isolation and real-time polymerase chain reaction
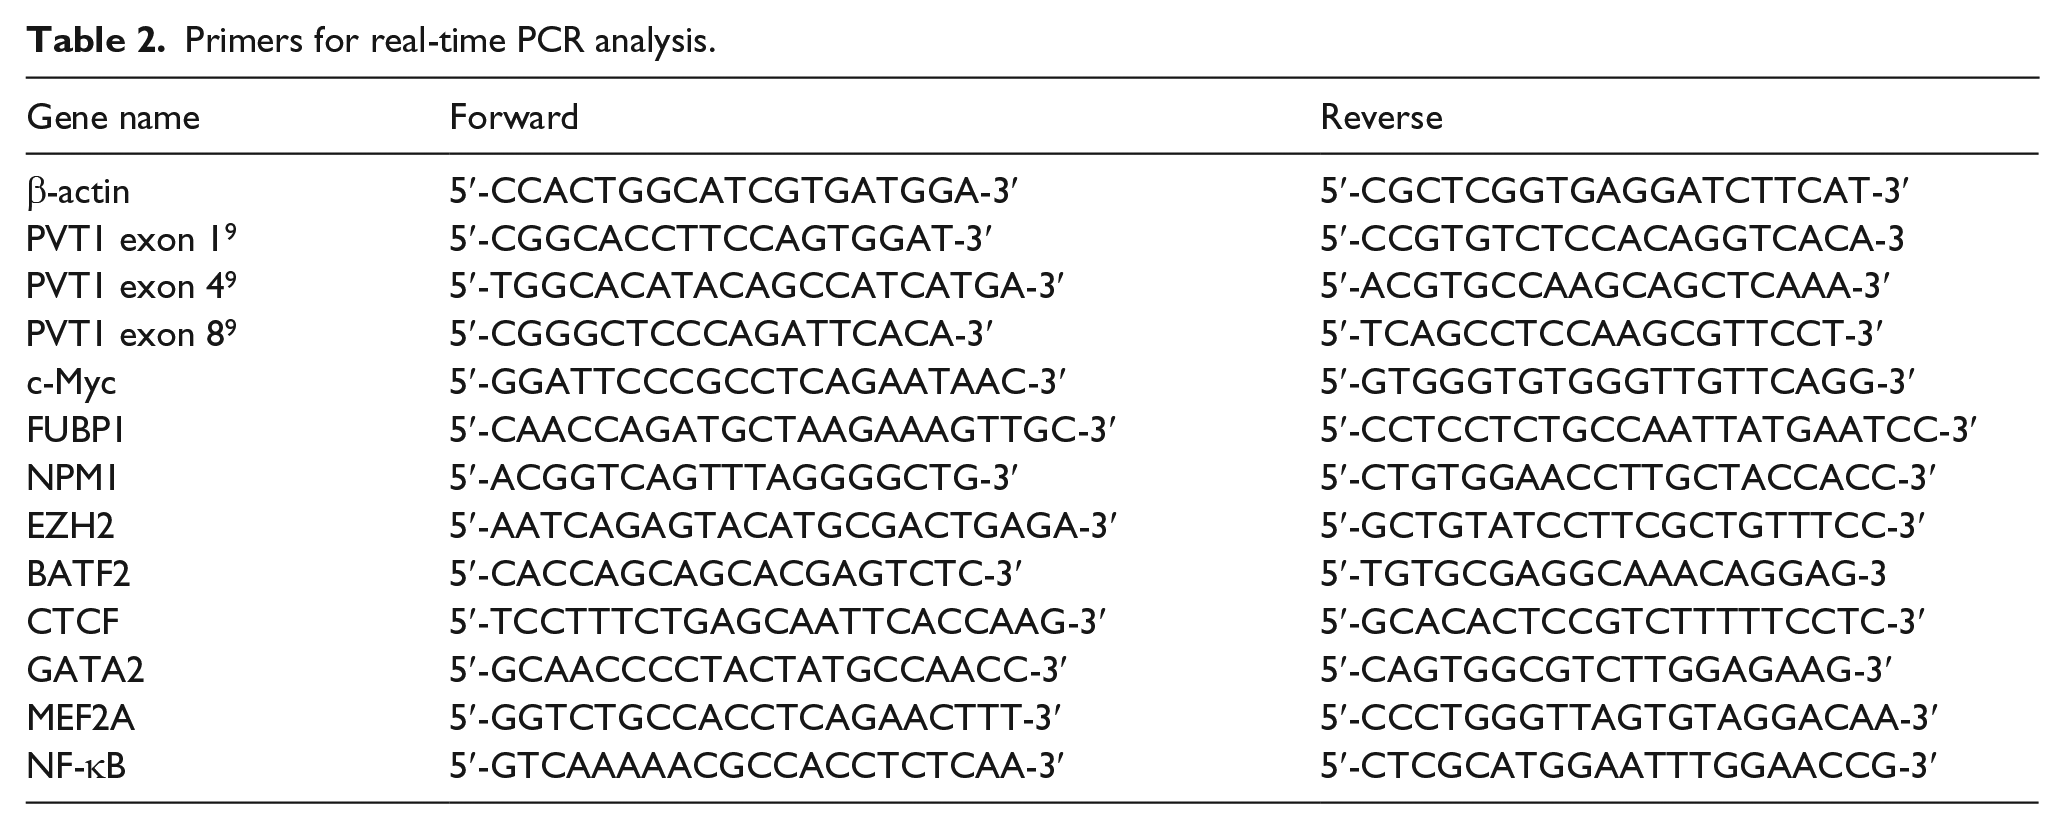
To evaluate whether RNA was present inside the EVs, RNase A (Fermentas, CA) was added to suspensions of EVs at a final concentration of 100 µg/mL and incubated for 15 min at 37°C. Total RNA was then purified using the TRIzol Total RNA Reagent. Total RNA from EVs of SW620 and SW480 cells was analyzed and quantified using a Bioanalyzer 2100 (Agilent Technologies, Santa Clara, CA). Complementary DNA (cDNA) synthesis was performed with 2 µg total RNA using the PrimeScript 1st Strand cDNA Synthesis Kit (Takara, Otsu, Japan). The primers of PVT1 exon 4 have been shown in Table 2. The polymerase chain reaction (PCR) protocol was as follows: 5 min at 94°C; 30 s at 94°C, 30 s at 55°C, and 15 s at 72°C for 30 cycles; and 72°C for 10 min. PCR products sizes (130 bp) were checked on a 4% agarose gel. Amplified product sequence was analyzed by the ABI 3730XL Genetic Analyzer (Applied Biosystems, Foster City, CA, USA).
Primers for real-time PCR analysis.
Electron microscopy
Place a drop, approximately 10 µg of EVs resuspended in phosphate-buffered saline (PBS), on a Parafilm. Position a Formvar carbon-coated nickel grid on the top of each drop for 30 min. Wash the grid with three drops of PBS. Fix the sample with a drop of 2% paraformaldehyde for 10 min. Then, postfix the sample with a drop of 2.5% glutaraldehyde for 10 min. Repeat the wash with three drops of deionized water. Embed the sample with a drop of tungstophosphoric acid to the Parafilm and incubate the grid on top of the drop for 10 min. Remove excess liquid using an absorbing paper; before positioning the grid on a paper with the coated side up, let it air dry for 5 min. Examine the preparations with an electron microscope before observation in a JEM-1400 (JEOL, Japan) operated at 800 kV.
Real-time quantitative polymerase chain reaction
RNA in EVs was isolated as described above. Total RNA was isolated from CRC tumor tissue, matched adjacent normal tissue, and CRC cells using the TRIzol Total RNA Reagent (Invitrogen, Carlsbad, CA, USA). The RNA was quantified using a nanodrop ND-1000 (Thermo Fischer Scientific, Waltham, MA). cDNA synthesis was performed with 2 µg total RNA using the PrimeScript 1st Strand cDNA Synthesis Kit. The primers were obtained from Shanghai Sangon Biotech Co., Ltd. (Shanghai, China), and the sequences are shown in Table 2.
Quantitative PCR (qPCR) was performed using the SYBR PrimeScript RT-PCR kit (Takara, Otsu, Japan) in an Applied Biosystems 7500 Fluorescent Quantitative PCR System (Applied Biosystems). The reaction mixtures were incubated at 95°C for 30 s, followed by 40 amplification cycles of 95°C for 5 s and 60°C for 34 s. The quantification of gene expression was performed using the ΔΔCT calculation with CT as the threshold cycle. The expression level of a target gene in a patient was calculated as the ratio: target in tumor tissue/target in nontumorous tissue (R (C/N)). The expression level of a target gene in EVs from SW620 or SW480 was normalized with the quantity of EV protein (µg) and calculated as the ratio: SW480 EVs/SW620 EVs.
Transfection of siRNA
For small interfering RNA (siRNA) analysis, siRNA for PVT1 sequence and non-targeting siRNA were obtained from GenePharma (Shanghai, China). PVT1: sense strand: 5′-CAGCCAUCAUGAUGGUACU-3′ and antisense strand: 5′-AGUACCAUCAUGAUGGCUG-3′. 8 Approximately 5% SW620 and SW480 cells was plated to each well of 12-well plates at least 24 h before transfection to achieve 30%–50% confluency. SiRNA transfection was done with X-tremeGENE Transfection Reagent (Roche, Basel, Switzerland) according to the manufacturer’s instructions. Cells were harvested or fixed 48 h after transfection for RNA isolation, cell proliferation assay, and apoptosis analyses.
Cell proliferation assay
SW620 and SW480 cells were cultured and transfected with PVT1 siRNA or with negative control siRNA as described above. After 48 h, cell proliferation was assessed by 3-(4,5-dimethylthiazol-2-yl)-5-(3-carboxymethoxyphenyl)-2-(4-sulfophenyl)-2H-tetrazolium (MTS) assay (Promega, Madison, WI) according to the manufacturer’s protocol. SW620 and SW480 cells (2000 cells per well) in each group were plated in 96-well plates. A volume of 20 µL of the MTS reagent was added to each well containing 100 µL culture medium. The plate was incubated for 2 h at 37°C in a humidified, 5% CO2 atmosphere. The plate was then read at 490 nm using a plate reader.
Cell apoptosis assay
SW620 and SW480 cells (106 cells per 6 cm2 dish) in each group were plated for the assay, and flow cytometry analysis was performed. Before harvesting, the cells were washed twice with cold PBS and resuspended in 1× binding buffer at a concentration of 1 × 10⁶ cells/mL. After centrifugation, cells were double-stained with Annexin V–fluorescein isothiocyanate (FITC; BD Biosciences, San Jose, CA, USA) and propidium iodide (PI) according to the manufacturer’s instructions. Cells were then analyzed using a FACSCalibur flow cytometer (BD FACSCalibur; BD Biosciences).
Statistical analysis
Differences between groups were analyzed using Student’s t-test. Correlation between gene expression ratios was studied by using log2. Pearson’s correlation was used to explore the relationships between gene expression ratios in CRC specimens. Statistical analyses were performed using SPSS version 18.0 (SPSS, Chicago, IL, USA) and GraphPad Prism Software (GraphPad Software, Inc., San Diego, CA, USA). For all statistical analyses, p < 0.05 was considered statistically significant.
Results
PVT1 and c-Myc expression correlated in CRC tissue specimens
The PVT1 and c-Myc expression levels were assessed in a group of 30 patients with CRC (Table 3). We analyzed a panel of paired specimens obtained from patients with CRC. From each CRC patient, lncRNA was isolated from cancerous tissue and adjacent nontumorous CRC tissue. The results showed that the expression levels of PVT1 exon 1, exon 4, and exon 8 in tumor tissues were all remarkably higher than those in normal tissues, as well as c-Myc (Figure 1(a)–(d)). Furthermore, the expression ratios of PVT1 were significantly correlated with those of c-Myc in CRC tissue samples (R = 0.57, p < 0.05; Figure 1(e), Table 3). To test the potential association between the three exons with different position of PVT1 locus and c-Myc expression, the data set was divided into three individual correlation coefficients. This revealed a strong correlation between PVT1 exon 1 (the closest exon to c-Myc) and c-Myc expression (R = 0.63, p < 0.05; Table 3), while the correlation was substantially weaker in PVT1 exon 8 (R = 0.52, p < 0.05; Table 3), and the correlation of exon 4 was in the middle (R = 0.56, p < 0.05; Table 3).
Correlation of PVT1 exons with c-Myc.
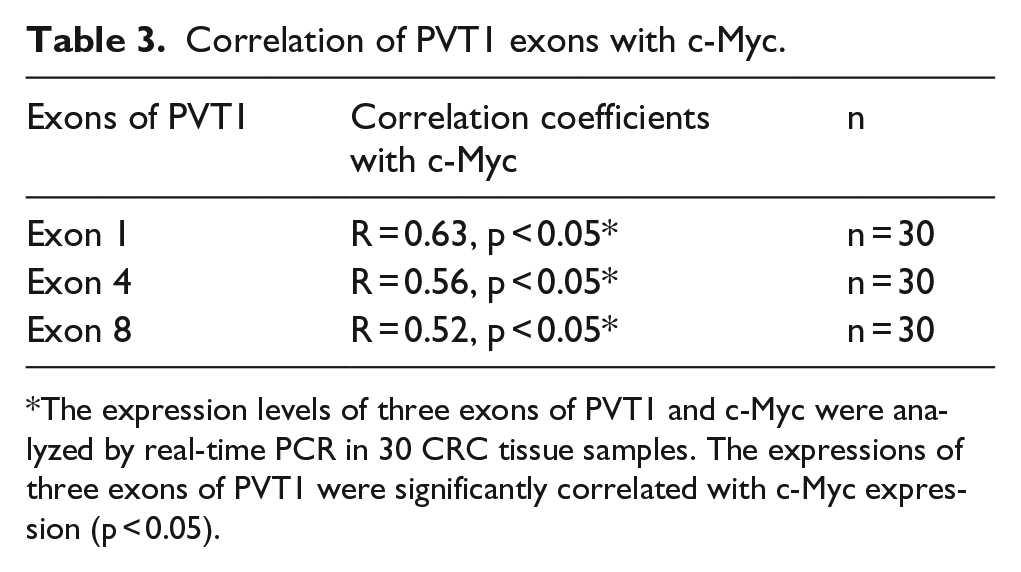
The expression levels of three exons of PVT1 and c-Myc were analyzed by real-time PCR in 30 CRC tissue samples. The expressions of three exons of PVT1 were significantly correlated with c-Myc expression (p < 0.05).

The PVT1 and c-Myc expression levels were analyzed by real-time PCR in 40 CRC tissue samples. (a)–(d) The expression levels of three exons of PVT1 as well as c-Myc were all significantly higher in tumor tissues than in normal tissues (p < 0.05). (e) The expression of PVT1 (exon 4) was significantly correlated with that of c-Myc (p < 0.05).
PVT1 and three c-Myc regulating genes FUBP1, EZH2, and NPM1 expression correlated in CRC tissue specimens
To test the potential association between the PVT1 and c-Myc upper-stream regulating genes, we assessed the correlation of the three PVT1 exons and three c-Myc regulating genes FUBP1, EZH2, and NPM1 expression levels in 40 CRC patients’ specimens (Table 4). The results showed remarkable correlation of PVT1 exon 1 with FUBP1 (R = 0.65, p < 0.05; Table 4) and EZH2 (R = 0.63, p < 0.05; Table 4) expression and strong correlation of PVT1 exon 4 (R = 0.63, p < 0.05; Table 4) and exon 8 (R = 0.65, p < 0.05; Table 4) with NPM1 expression.
Correlation of PVT1 exons with c-Myc regulating genes.

The expression levels of three exons of PVT1 and three c-Myc regulating genes (FUBP1, EZH2, and NPM1) were analyzed by real-time PCR in 40 CRC tissue samples. The expressions of three exons of PVT1 were significantly correlated with FUBP1, EZH2, and NPM1 expression (p < 0.05).
PVT1 and the two PVT1-related transcript factors NF-κB and MEF2A expression correlated in CRC tissue specimens
To test the potential association between the PVT1 and PVT1-related transcript factors in RNA expression, we assessed the correlation of the three PVT1 exons and six PVT1-related transcripts expression levels in 20 CRC patients’ specimens (Figure 2, Table 5). The results showed a remarkable positive correlation of PVT1 exon 4 with NF-κB (R = 0.56, p < 0.05; Figure 2(e), Table 5) and a significant negative correlation with MEF2A (R = −0.51, p < 0.05; Figure 2(d), Table 5) in expression.
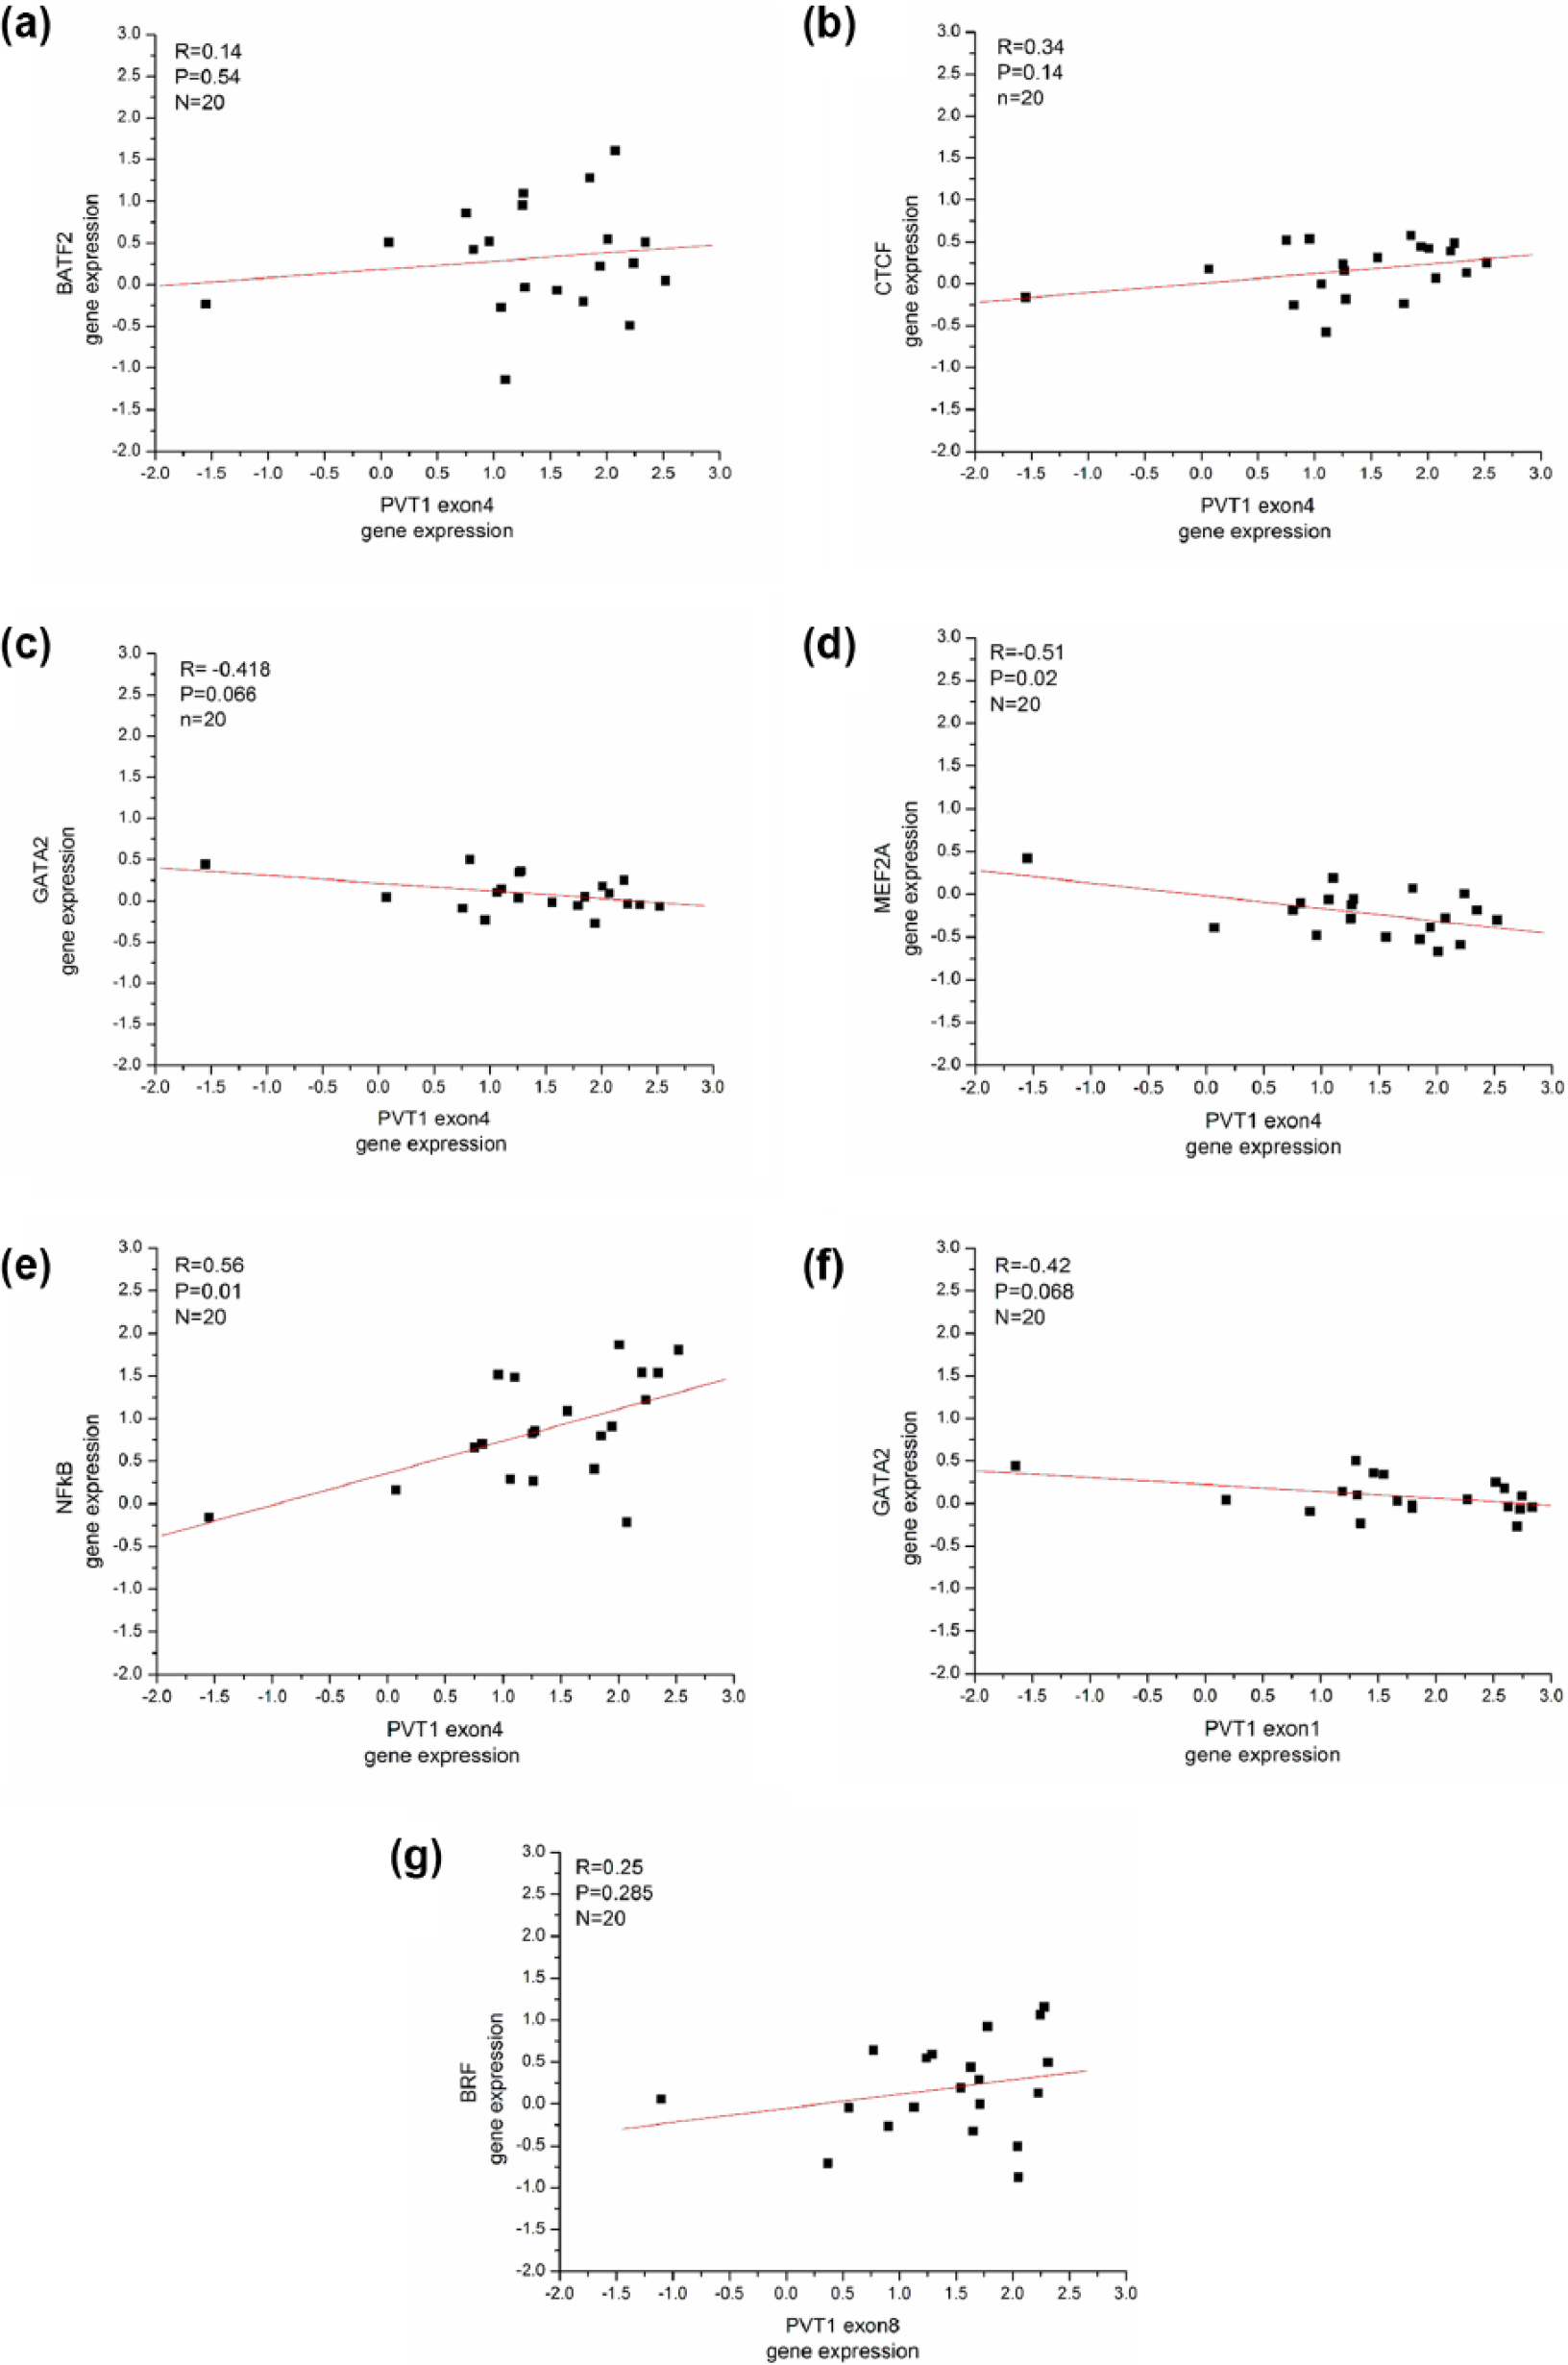
The expression levels of three exons of PVT1 and six PVT1-related transcripts were analyzed by real-time PCR in 20 CRC tissue samples. (a)–(g) The PVT1 exon 4 was significantly correlated with (d) MEF2A (R = −0.51, P < 0.05) and (e) NF-κB (R = 0.56, p < 0.05) in expression.
Correlation of PVT1 exons with PVT1-related transcripts.

The expression levels of three exons of PVT1 and six PVT1-related transcripts were analyzed by real-time PCR in 20 CRC tissue samples. The PVT1 exon 4 was significantly correlated with NF-κB (R = 0.56, p < 0.05) and MEF2A (R = −0.51, p < 0.05) in expression.
PVT1 expression detected in SW620 EVs was higher than SW480 EVs
EVs isolated from culturing medium of SW620 and SW480 cells were varied in size from about 50 to 200 nm (Figure 3(a) and (b)). To eliminate the RNA outside of the EVs, the EVs samples were exposed to RNase A. A bioanalysis of RNA from EVs revealed that the EVs contain a broad range of RNA sizes, consistent with a variety of mRNAs and miRNAs, and other unidentified RNAs, but lack the ribosomal RNA peaks characteristic of cellular RNA (Figure 3(c)). The real-time polymerase chain reaction (RT-PCR) showed that the PVT1 was expressed in both SW620 and SW480 EVs. The amplified products were corresponded to the expected size (Figure 3(d)). Sequences of amplification products (Figure 3(e)) were compared to GenBank sequences used to design primers with BLAST sequences software. All amplified sequences had 100% identities with GenBank sequences. The RT-PCR results showed that PVT1 expression in SW620 EVs was significantly higher than SW480 EVs (Figure 3(f)).

PVT1 was expressed in CRC cell extracellular vesicles. (a) Electron microscopy image of SW620 EVs and (b) SW480 EVs. (c) After EVs were exposed to RNase A, the RNA was then isolated. Bioanalyzer data showed the size distribution of total RNA of EVs of CRC cells. (d) RT-PCR of PVT1 in EVs of CRC cells (DL2000 Marker: 100 bp, 250 bp, 500 bp, 750 bp, 1 kb, 1.6 kb, and 2 kb). (e) Sequences of amplification products in EVs of CRC cells. (f) PVT1 expression detected by real-time PCR in SW620 EVs and SW480 EVs (p < 0.05).
Knockdown of PVT1 and c-Myc expression by siRNA
PVT1 siRNA was constructed and stably transfected into SW620 and SW480 cells. PVT1 expression was markedly decreased, which was detected by qPCR. Quantification analysis showed that PVT1 expression level in PVT1 siRNA group was knocked down by nearly 80% in SW620 and 70% in SW480, and c-Myc expression level was also downregulated by about 50% in SW620 and 35% in SW480 (Figure 4(a) and (b)).

Expression of PVT1 and c-MYC in negative control and PVT1 siRNA-treated CRC cells. c-MYC mRNA and PVT1 lncRNA knockdown levels were measured by qPCR in (a) SW620 and (b) SW480 cells transfected with PVT1 siRNA and negative control siRNA. Expressions of PVT1 were significantly reduced in PVT1 siRNA groups compared with negative control groups in both SW620 and SW480 (p < 0.05).
PVT1 knockdown via siRNA decreased CRC cell proliferation
To further identify the role of PVT1 in SW620 and SW480 cells, we performed functional assays with SW620 and SW480 cells by suppressing PVT1 expression (PVT1 siRNA) in comparison with SW620 and SW480 cells transfected with nonfunctional control siRNA. The results showed that the SW620 and SW480 cells in PVT1 siRNA transfected group grew significantly slower compared with the cells in the controls group (Figure 5(a) and (b)).

Cell growth retardation by PVT1 siRNA in CRC cells. Cell proliferation fold increase was tested using MTS with 1 day interval. PVT1 siRNA groups showed reduced growth rates compared with negative control groups in both (a) SW620 and (b) SW480 cells (p < 0.05).
PVT1 expression negatively correlates with SW620 and SW480 cell apoptosis
We compared the apoptosis of SW620 and SW480 cells with suppressed PVT1 expression group and control group; Figure 6 shows that PVT1 downregulation significantly promoted SW620 and SW480 cell apoptosis (p < 0.05). Results of these experiments demonstrated that SW620 and SW480 cells with PVT1 suppression led to enhanced apoptosis in comparison to control group.

Effects of PVT1 siRNA on apoptosis in CRC cells. PVT1 siRNA increased apoptosis in SW620 and SW480 cells. Cells were collected after 24 h treatment with negative control or PVT1 siRNA, stained with Annexin V/propidium iodide (PI), and evaluated by fluorescence-activated cell sorter (FACS) analysis.
Discussion
CRC is a complicated and multi-step disease with a variety of genetic disorders. Large quantities of protein molecules have been long discovered as cancer markers and used as important diagnostic and prognostic tools in CRC clinic. Recently, dysregulation of several lncRNAs has been found as new factors correlated with CRC malignancy, such as HOTAIR, MALAT1, and H19.27–29 As the lncRNA itself is the effector molecule, its expression levels may be a better indicator of the intrinsic characteristics of the tumor comparing with the protein-coding RNAs. 19
PVT1 is a large non-coding locus adjacent to c-Myc locus. Overexpression and rearrangement of the region at 8q24 encoding c-Myc and PVT1 are frequently involved in multiple malignant tumors.8–18 Nevertheless, little is known about the expression pattern and functional role of lncRNA PVT1 in CRC.
Barsotti et al. 9 have presented evidence for the relationship between p53 and miR-1204 in PVT1 locus in CRC cell line HCT116, but they believed that the functions of miR-1204 and non-coding transcripts of PVT1 are in contrast.
The PVT1 locus contains a variety of exons and produces numbers of different transcript variants comprising various exons. In this study, we chose three of these exons (exon 1, exon 4, and exon 8) as our detectors of PVT1 expression. Since the expression of exon 4 has been demonstrated to be consistent with all other exons, 9 we mainly evaluated the expression of PVT1 exon 4 in tumor tissue and adjacent normal tissue from 40 CRC cases.
To explore the possible connection between the location and expression relationship of PVT1 and c-Myc, we also detected the expression of exon 1 and exon 8, which possess the nearest and furthest location to the c-Myc locus among all the PVT1 exons, respectively. The results showed that the expression levels of PVT1 exon 1, exon 4, and exon 8 in tumor tissues were all remarkably higher than those in normal tissues. Furthermore, the expression of all the three exons was significantly related with c-Myc expression, with the highest correlation coefficients in exon 1 and the lowest in exon 8, corresponding to the distance to c-Myc.
Having clarified the relationship between PVT1 and c-Myc expression in CRC, further work was done in this research to investigate the possible connection between the expression of PVT1 and those c-Myc-related genes. Cancer driver genes FUBP1, EZH2, and NPM1 have been reported as the upper-stream regulator of c-Myc,22–26 and here, we showed that their expression in CRC was also positively related to that of PVT1. For instance, Li et al. 24 have reported that NPM1 can directly interact with c-Myc and regulate the expression of endogenous c-Myc target genes at the promoter, and here, we demonstrated that the expression of NPM1 was also correlated with PVT1 exons, especially exon 8, the furthest exon from c-Myc, and then the exon 4 and exon 1.
Furthermore, we detected that the positive association between PVT1 and c-Myc expression in CRC not only resulted from their adjacent location but also from c-Myc which functions as one of the transcript activators of PVT1. Therefore, to explore the possible connection between those other PVT1 transcript factors and PVT1 in their expression level in CRC, we also analyzed the correlation between the expression of PVT1 exons 1, 4, and 8 and their corresponded transcript factors. The results showed that the expression of transcript factor NF-κB was positively correlated with PVT1 exon 4, and expression of transcript factor MEF2A was negatively correlated with PVT1 exon 4.
Many cancers related to lncRNAs have been discovered in recent years, and lncRNAs have been currently regarded as a new diagnostic and therapeutic gold mine. 19 However, nearly all of these lncRNAs were detected in tissues or in cells, and no lncRNA has been found in the EVs yet. The cell-released small membranous vesicles contain numerous informational molecules, including mRNA and miRNA, while we considered that some lncRNAs, as other kinds of RNAs, can be involved in these membranous intercellular communicators. In this study, we proved that the lncRNA PVT1 can be detected in the EVs released from SW620 and SW480 cells. The two cell lines were established from the same CRC patients, SW480 was established from the original lesion, and SW620 was from the metastatic lesion, which is the more aggressive cell line. In addition, here we found that in the SW620 EVs, the PVT1 expression level is higher than that in the SW480 EVs. Recently, miRNAs in EVs of plasma and other body fluids have already been used as a new type of diagnostic markers of cancer. This finding may provide a novel method in the future for detection of lncRNA PVT1 in plasma or other body fluids which are rich of all sorts of EVs.
In addition, we used the siRNAs targeting the PVT1 exon 2 and exon 3, which has been proved to be the functional locus in ovarian cancer. 8 The results showed that by downregulating the PVT1 expression in CRC cells SW620 and SW480, the expression of c-Myc was suppressed, the cell proliferation was inhibited, and cell apoptosis was increased. The results implicated the functional role of PVT1 and the correlation between PVT1 and c-Myc in CRC.
In conclusion, PVT1 in EVs may act as a new diagnostic marker and therapeutic target of CRC, and further studies are warranted to validate our findings.
Footnotes
Acknowledgements
K.G., J.Y., and Q.Y. contributed equally to this work.
Declaration of conflicting interests
The author(s) declared no potential conflicts of interest with respect to the research, authorship, and/or publication of this article.
Funding
The author(s) received no financial support for the research, authorship, and/or publication of this article.