
Abstract
Glioblastoma multiforme is the most common and aggressive primary brain tumor in adults. A mesenchymal phenotype was associated with tumor aggressiveness and poor prognosis in glioblastoma multiforme patients. Recently, the transcription factor RUNX1 was suggested as a driver of the glioblastoma multiforme mesenchymal gene expression signature; however, its independent role in this process is yet to be described. Here, we assessed the role of RUNX1 in U87 glioblastoma multiforme cells in correspondence to its mediated transcriptome and genome-wide occupancy pattern. Overexpression of RUNX1 led to diminished tumor growth in nude and severe combined immunodeficiency mouse xenograft tumor model. At the molecular level, RUNX1 occupied thousands of genomic regions and regulated the expression of hundreds of target genes, both directly and indirectly. RUNX1 occupied genomic regions that corresponded to genes that were shown to play a role in brain tumor progression and angiogenesis and upon overexpression led to a substantial down-regulation of their expression level. When overexpressed in U87 glioblastoma multiforme cells, RUNX1 down-regulated key pathways in glioblastoma multiforme progression including epithelial to mesenchymal transition, MTORC1 signaling, hypoxia-induced signaling, and TNFa signaling via NFkB. Moreover, master regulators of the glioblastoma multiforme mesenchymal phenotype including CEBPb, ZNF238, and FOSL2 were directly regulated by RUNX1. The data suggest a central role for RUNX1 as master regulator of gene expression in the U87 glioblastoma multiforme cell line and mark RUNX1 as a potential target for novel future therapies for glioblastoma multiforme.
Introduction
Glioblastoma multiforme (GBM) is the most common primary brain tumor in adults and is practically incurable.1,2 Although all GBMs share common histological features, recent studies demonstrated that different molecular subclasses of these highly aggressive tumors resemble stages in neurogenesis and correlate with disease progression and patient prognosis.3–5 Patients whose tumor exhibited a ‘mesenchymal’ gene expression signature (MGES), enriched for neural stem cell markers, suffered from worse prognosis compared to patients with a pro-neural signature (PNGES), expressing neuronal lineage markers. 3 Moreover, upon tumor recurrence, PNGES tended to shift toward MGES. MGES underlies the conversion of neural cells into cells displaying a mesenchymal phenotype consisting of uncontrolled capacity to invade adjacent tissues and to induce angiogenesis.3,6
Recent studies demonstrated that the mesenchymal signature of GBM is largely driven by six transcription factors (TFs) including STAT3, CEBP, BHLHB2, FOSL2, ZNF238, and RUNX1.7,8 These factors control the expression of over 70% of genes comprising the MGES of high-grade gliomas. 7 STAT3 and CEBP were established as the initiators and master regulators of this process and when silenced led to elimination of the mesenchymal signature and decreased tumor aggressiveness. 7 Although the roles of STAT3 and CEBP in GBM have been increasingly studied,9–12 the autonomous roles and molecular mechanisms underlying the function of the remaining four TFs are poorly understood.
The TF RUNX1 is a key regulator of definitive hematopoiesis during embryonic development in the adult and is well known for its frequent translocations and mutations in hematological malignances.13–17 Recognized as a context-dependent transcription regulator, RUNX1 is involved in various biological functions including the development of the immune cells, epithelium and epithelial stem cells, hair follicles, and neuronal development.18–22 Consistent with its comprehensive roles, RUNX1 was associated with the development of malignancies originating from various tissues apart from the hematopoietic system including breast, ovary, pituitary, and the gastrointestinal system.23–27 Nevertheless, despite being heavily studied, little is known regarding the role of RUNX1 in malignancies of the central nervous system, specifically GBM.8,26,28–30
In this study, we utilized the U87 GBM cell line to evaluate the independent role of RUNX1 in GBM development and progression. Enhanced expression of RUNX1 in U87 cells led to diminished tumor growth in a mice xenograft model. This phenotypic manifestation was assessed in relation to RUNX1 global genome occupancy profile and mediated transcriptome. Integrative analysis identified a broad repertoire of RUNX1 target genes and shed new light on the molecular mechanisms underlying RUNX1 function in the U87 GBM cell line.
Materials and methods
Cells
U87 cells were maintained in minimum essential medium (MEM)-alpha medium supplemented with 10% fetal bovine serum (FBS) (Gibco, Carlsbad, CA, USA), 2 mM
Mice
Six- to eight-week-old severe combined immunodeficiency (SCID) and nude mice (Harlan, Israel) were used for the xenograft tumor model. U87 cells were subcutaneously injected into nude mice 48 h following pCSC-RUNX1-IRES-GFP or pCSC-IRES-GFP lentiviral infection. Tumor growth was assessed 2–4 weeks following inoculation. Mice were euthanized by cervical dislocation and tumors were extracted for further analysis. All animal procedures were performed in compliance with Tel Aviv Sourasky Medical center guidelines and protocols approved by the Institutional Animal Care and Use Committee (IACUC). Approval number 11–15 (1.6.2014). All efforts were made to reduce animal suffering.
Histological sections and immunohistochemistry
Immunohistochemistry (IHC) was performed with the Ventana Benchmark automated staining system (Ventana Medical Systems, Tucson, AZ, USA) on 4-µm paraffin sections. The slides were deparaffinized in xylene and rehydrated through a graded series of ethanol concentrations. Slides were labeled with the Ki67 antibody (Cell Marque, Rocklin, CA, USA) and loaded into a Benchmark XT (Ventana Medical Systems) automated staining instrument. Primary antibodies were detected with the Ventana iVIEW DAB detection kit. Images were captured using NIKON 550S with Q-imaging software.
Western blotting
Cells were collected, washed once in phosphate-buffered saline (PBS), and nuclear proteins were extracted and analyzed by western blotting as previously described using antibodies detecting RUNX1 c-terminus (affinity purified rabbit anti C-terminal RUNX1). 33 Anti-EMERIN antibody was used as an internal loading control.
RNA processing and sequencing
RNA was isolated by EZ-RNA (Biological Industries, Beit Haemek Israel), according to manufacturer’s instructions. RNA libraries were prepared for sequencing according to the manufacturer’s instructions (TruSeq; Illumina Inc., San Diego, CA, USA). For each sample, ~25 M single-end 51-base reads were obtained using Illumina HiSeq2500. CASAVA version 1.8.2 was used to generate the raw fastq files. Reads were mapped to hg19 genome assembly using TopHat v2.0.10 (http://tophat.cbcb.umd.edu/). Uniquely mapped reads were counted using the HTseq package (http://www-huber.embl.de/). The DESeq package was used to identify differentially expressed genes (http://bioconductor.org/).
Real-time reverse transcription quantitative PCR
RNA was purified as described above and reverse transcribed with the Omniscript™ RT kit (Qiagen, Frederick, MD, USA). Quantitative polymerase chain reaction (qPCR) was performed using the light cycler 480 (Roche, Indianapolis, IN, USA) with 480 SYBR Green I master (Roche) with Tm 61°C, using Actb as a calibrator. Fold changes were calculated using Excel-based REST software. The primers used are listed in online resource Table S1.
Chromatin immunoprecipitation-sequencing and data analysis
Chromatin immunoprecipitation (ChIP) was performed essentially as described. 34 Briefly, for each ChIP assay, chromatin from ~1 × 10⁷ U87 cells was fragmented to an average size of ~200 bp by 30 cycles of sonication (30 s each) in 15-mL tubes using the Bioruptor UCD-200 sonicator (Diagenode, Denville, NJ, USA). The fragmented chromatin was immunoprecipitated using 60 µL of in-house anti-Runx1 antibodies. 33 Rabbit non-immune serum (NIS) was used as ChIP control. DNA was purified using QIAquick MinElute columns (Qiagen) and sequenced using Illumina HiSeq according to manufacturer’s instructions. Two biological repeats were conducted for each ChIP experiment using an Illumina HiSeq2500 instrument. 29M reads (51 bases) were obtained for each of the anti-Runx1 samples and 44M (51 bases) reads were obtained for each of the pre-immune serum replicates. For chromatin immunoprecipitation-sequencing (ChIP-seq) analysis, Illumina sequencing short reads were aligned to the human genome, allowing 1 mismatch (hg19), using Bowtie (version 0.12.7) 35 (http://bowtie-bio.sourceforge.net/). In all, 81%–84% of the reads were uniquely aligned to hg19 genome. Runx1-bound regions were identified by analysis on joined uniquely aligned reads from both biological repeats of anti-Runx1 ChIP versus pre-immune serum using model-based analysis of ChIP-Seq (MACS2). 36 Enrichment for promoter peak regions and microRNAs (miRNAs) was calculated using CEAS (Cistrome). 37 For miRNAs, The BETA program (http://cistrome.org/BETA/) 38 was used in the minus mode in order to calculate regulatory potential of miRNAs. The regulatory potential was scored as the sum of the contribution of individual sites. All binding sites near the transcription start site of the miRNA are taken into account. In order to be strict, in the current analysis, only binding sites that had a distance which is shorter than 1500 bases were taken into account. The Genomic Regions Enrichment of Annotations Tool (GREAT) 39 algorithm was used to determine the genes corresponding to RUNX1-bound peaks, with the basal plus extension settings for association of genomic regions with genes (with the following parameters: proximal: 5 kb upstream, 1 kb downstream, plus distal up to 100 kb). Gene set enrichment analysis (GSEA), pre-ranked, was used in order to check enrichment of the differentially expressed genes with genes associated with Runx1 ChIP-seq peaks.40,41
Binding motif analysis
To find peaks with the consensus RUNX motif TGt/cGGt/c, we used CisGenome (http://www.biostat.jhsph.edu/~hji/cisgenome/). General overrepresentation of binding motifs and de novo motif finding was performed with Genomatix (www.genomatix.de/) and MEME-ChIP 42 (http://meme.ebi.edu.au/tools/meme-chip).
Results
Enhanced RUNX1 expression in U87 cells leads to diminished tumor growth
To evaluate the role of RUNX1 in the U87 GBM cell line, the effect following its overexpression as well as silencing was assessed (Figure 1(a)). U87 cells overexpressing RUNX1 (U87RUNX1-OE) were subcutaneously inoculated into nude mice and resultant tumor growth was assessed. Only 30% of mice inoculated with U87RUNX1-OE cells developed palpable tumors within 3 weeks from injection compared to 66% of mice inoculated with control cells (U87control) (Figure 1(b)). Moreover, the tumors that were developed following inoculation of U87RUNX1-OE cells were significantly smaller than those developed using U87control cells (Figure 1(c)–(e)). Of note, the tumors originating from U87RUNX1-OE cells expressed high levels of RUNX1 compared to controls even 3 weeks following cell inoculation (Figure 1(d)). Similar results were demonstrated upon cell inoculation to SCID mice (Figure 1(f)). IHC demonstrated decreased cellularity and Ki67 staining in tumors of U87RUNX1-OE cells compared to those of U87control cells (Figure 1(g) and (h)). Of note, knocking down the expression of RUNX1 to less than 20% compared to control (Figure 1(a)) did not lead to any identifiable phenotypic manifestation.
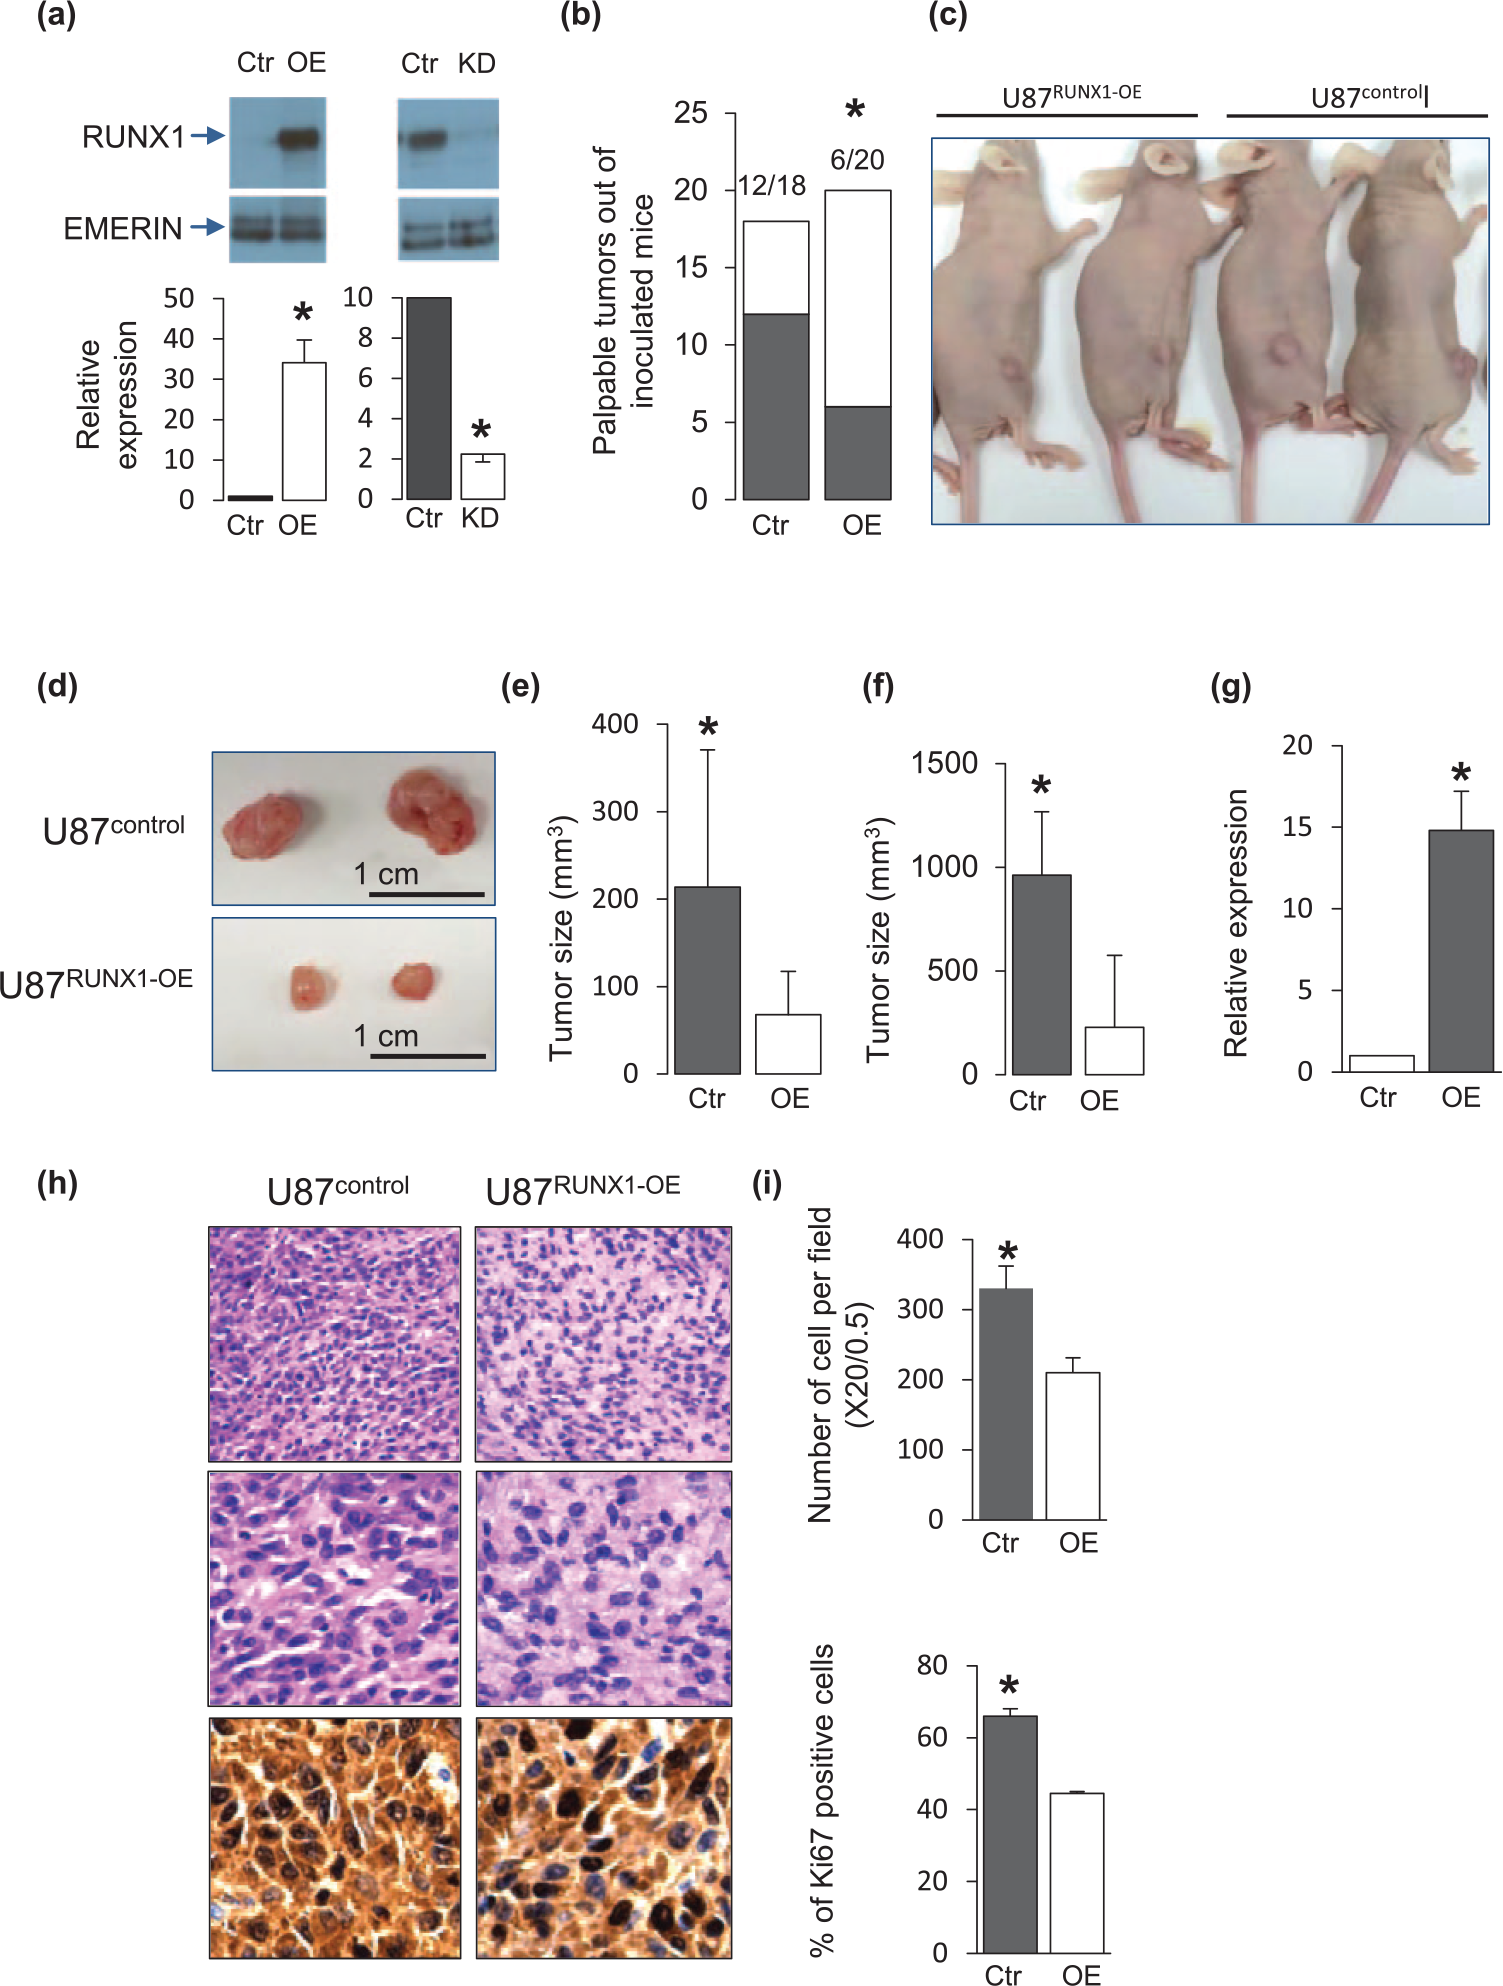
Enhanced RUNX1 expression in U87 cells leads to inhibited tumor growth. (a) Western blot (upper) and quantitative RT-PCR (lower) analysis of RUNX1 expression 72 h following OE (left) and KD (right) of RUNX1. Emerin was used as protein loading control. Quantitative RT-PCR demonstrating the level of RUNX1 expression in U87RUNX1-OE relative to the expression in U87control (left) as well as in U87RUNX1-KD compared to U87control (right). The data represent mean ± SD of three independent experiments performed in triplicates. *p < 0.01. (b) Histograms presenting the number of palpable lesions out of total number of mice inoculated with either U87control (Ctr) or U87RUNX1-OE (OE). Mice were examined 21 days following inoculation. *p < 0.05. (c) Representative images of mice inoculated with U87control (Ctr) and U87RUNX1-OE (OE) 21 days following injection. (d) Representative images of tumors originated from U87control and U87RUNX1-OE 21 days following injection to nude mice. (e) Histogram of average tumor sizes in nude mice (mm3). Data represent mean size ± SD of 12 and 6 tumors originating from Ctr- and OE-treated mice, respectively. *p < 0.05. (f) Histogram of tumor sizes, 21 days following inoculation of U87control and U87RUNX1-OE to SCID mice. Data represent mean size ± SD of three tumors originating from Ctr and OE. *p < 0.05. (g) Quantitative RT-PCR demonstrating the level of RUNX1 expression in tumors presented in (d). The data represent mean ± SD of three independent experiments performed in triplicates. *p < 0.05. (h) Representative images of hematoxylin and eosin (H&E) staining (upper and middle row images—using 20×/0.5 and 40×/0.75 magnifications, respectively) and Ki67 staining (lower images) of tumors of U87control and U87RUNX1-OE cells. (i) Histograms of average cell number per field (using 20×/0.5 magnification) (upper histogram) and average percentages of Ki67-stained nucleuses (lower histogram). Five fields were counted in two different sections of two biological repeats of tumors originating from both Ctr and OE. *p < 0.05.
RUNX1 genome-wide occupancy pattern in U87 cells
To shed light on the molecular mechanisms underlying the RUNX1 effect on tumor growth, we mapped the global genome occupancy of RUNX1 in U87 cells. Sequencing of RUNX1 ChIP products compared to control revealed that RUNX1 heavily interacts with the DNA and occupies 8252 genomic regions (Figure 2(a)). Distribution analysis of these RUNX1 occupied regions relative to the nearest transcription start sites (TSSs) of annotated genes revealed that ~36% of RUNX1-bound regions were located near TSSs (<10 kb), whereas ~50% were placed more than 10 kb away from any TSS, and ~17% were in “gene deserts” (above 100 kb from the nearest TSS) (Figure 2(b)). Specifically, ~20% of bound sites (1650 sites) were located within promoter regions (up to 3 kb upstream to TSS), ~40% (3284 sites) were located in intergenic regions, and ~40% (3325 sites) in introns (Figure 2(b)). The demonstrated propensity of RUNX1 binding to promoter regions reflect its interaction with TSSs as part of its mediated transcription regulation. To characterize the sequence specificity of RUNX1 occupancy sites in U87 cells, we searched for DNA binding motifs within RUNX1-bound regions in comparison to background sequences. De-novo search of enriched DNA sequences within all RUNX1-bound regions demonstrated that sequences corresponding to RUNX and FOSL2 (AP-1 motif family) binding motifs were highly overrepresented (Figure 2(c)). Genomatix software was utilized to identify known binding motifs within RUNX1-bound regions genome-wide. Analysis of all RUNX1-bound regions, combining promoter and enhancer regions, revealed that the NRF and ZF5F binding motifs were most enriched, followed by AP1F and EGRF (Figure 2(d)). We further evaluated the enrichment of known DNA binding motifs separately within RUNX1-bound regions that are located within 3 kb from TSSs compared to those that are located in remote regions (3–100 kb from TSSs). In distant regions, AP1 (including the binding motif of FOSL2) and RUNX motifs were most enriched, followed by CEBP and TEAF binding motifs (Figure 2(e)). However, this was not demonstrated in peaks that were located adjacent to TSSs. In these regions, the binding motifs of NRF, ZF5F, SP1, E2FF, and EGRF were most enriched while the binding motifs of AP1 and RUNX were not significantly overrepresented (Figure 2(e)). Overall, this pattern suggests that RUNX1 and its cooperative partners regulate the transcription of target genes from remote genomic regions, as was previously shown in other biological processes.43,44 Data analysis using the GREAT 39 revealed an enrichment of RUNX1 occupancy in genomic regions surrounding genes that are involved in malignant neoplasms of the brain in general, and specifically GBM. Notably, an enriched proportion of RUNX1-bound genomic regions corresponded to genes that play a role in mesenchymal traits such as vasculature development and angiogenesis (Table 1). In order to identify potential RUNX1-regulated miRNAs, the genome-wide binding of RUNX1 in relation to miRNAs was analyzed. A total of 50 miRNAs bound by RUNX1 (within 1.5 kb) were identified (Table S4), including miRNAs that were previously shown to play major roles in GBM development and progression such as miRNA-1908, miRNA-155, and so on.45,46

RUNX1 genome occupancy in U87 cells. (a) Genomic distribution of RUNX1-bound regions (upper pie chart) relative to the normal genome distribution (lower pie chart) demonstrating enrichment of peaks located within promoter regions. (b) RUNX1 binding frequencies relative to the distance from the nearest annotated TSS. Pie charts represent groups of distances from TSSs. (c) De novo motif search within RUNX1-bound regions. RUNX1 and FOSL2 are the most highly overrepresented TF binding motifs, presented according to their Z-score of overrepresentation using MEME-ChIP software. (d) Genomatix overrepresentation of TF binding motifs within RUNX1-bound regions. Motifs are presented according to their Z-score of overrepresentation. Note that RUNX1 binding motif (HAML) is ranked in fifth position. (e) Genomatix overrepresentation of TF binding motifs within RUNX1-bound regions located within 3 kb from TSSs (near TSS, left), and bound regions located between 3 and 100 kb from TSSs (far from TSS, right). The Z-score of overrepresentation of the most highly enriched motifs each group is presented for both groups of bound regions (E: enhancer peaks, far from TSSs; P: promoter peaks, near TSSs). Note that RUNX1 binding motif is highly enriched within peaks located far from TSSs but not in peaks located near TSSs.
GREAT Analysis of RUNX1-bound genomic regions demonstrates highly significant overrepresentation of genes related to brain malignancies and blood vasculature development.
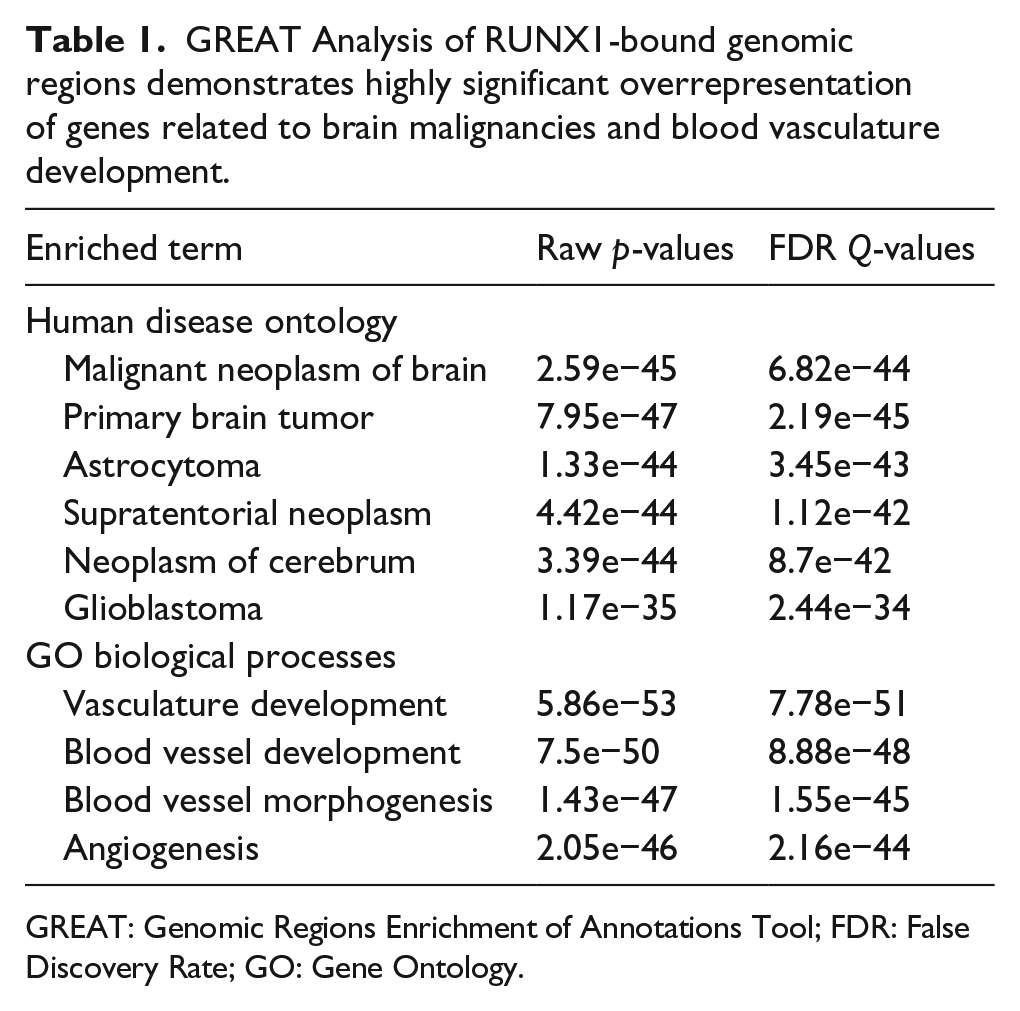
GREAT: Genomic Regions Enrichment of Annotations Tool; FDR: False Discovery Rate; GO: Gene Ontology.
RUNX1 OE facilitates a vast transcriptional response in U87 cells
The U87 transcriptome following RUNX1 manipulation was profiled. RUNX1 OE led to a massive transcriptional response 48 h following induction. The expression level of 1156 genes was significantly altered, of which 413 and 743 genes were up- and down-regulated, respectively (over twofold change in expression level, adjusted p-value < 0.05) (Figure 3(a)). On the other hand, RUNX1 KD led to a relatively minute transcriptional response consisting of 137 and 46 genes that were up- and down-regulated, respectively (over twofold change in expression level, adjusted p-value < 0.05) (Figure 3(a)). Analysis of the relation between RUNX1 genome occupancy and mediated gene expression revealed a strong relationship between RUNX1 binding and down-regulation of the corresponding target gene of OE. No significant correlation between RUNX1 genomic occupancy and up-regulation of target genes following RUNX1 OE was demonstrated (Figure 3(b)). Alternatively, significant correlations between RUNX1 binding and both up- and down-regulation of target genes were demonstrated upon RUNX1 KD (Figure 3(b)). This concurs with the fact that a larger proportion of genes that were down-regulated upon RUNX1 OE were bound by RUNX1, compared to genes that were up-regulated. This phenomenon was not demonstrated in the case of RUNX1 KD (Figure 3(c)). GSEA of RUNX1 OE mediated gene expression revealed that RUNX1 down-regulates key processes, previously demonstrated to be crucial for GBM development and progression. These include epithelial to mesenchymal transition, hypoxia-induced gene expression, MTORC1 signaling pathway, and tumour necrosis factor alpha (TNF-α) pathway via nuclear factor kappa B (NFkB) (Figure 3(d) and online resource Table S2). The majority of genes within these pathways was also bound by RUNX1, that is, directly regulated (Figure 3(e)). Down-regulation of key genes within these processes, including MMP3, GREM1, PRRX1, IGFBP3, STC2, as well as genes that were specifically related to tumor growth such as Sphk1, Cyr61, and Serpine1/2,47–49 was independently validated by RT-qPCR in the U87 cell line (Figure 3(f)). Genes that play various roles in GBM development and that were up-regulated following RUNX1 OE, including Dlx2, Jag1, Cryab, S1pr1, and Hes1, were also independently validated (Figure 3(f)). GSEA of RUNX1 KD mediated gene expression yielded no significant enrichment of any known pathways.

Transcriptional response following RUNX1 overexpression. (a) Transcriptional response as measured by RNA-Seq following RUNX1 OE (upper part) and KD (lower part) in U87 cells. Genes are plotted based on their expression level (mean log counts) in U87RUNX1-OE and U87RUNX1-KD cells versus their basal levels observed in the corresponding U87control (CONT). Genes showing at least twofold increase or decrease in expression levels compared to control (FDR < 0.05) are indicated in light and dark blue, respectively. (b) GSEA of the relationship between differentially expressed genes U87RUNX1-OE (upper part) and U87RUNX1-KD (lower part) and genes bound by RUNX1 in U87 cells (within 100 kb from the TSS). Note that enrichment in RUNX1 OE is demonstrated mainly in down-regulated genes as opposed to RUNX1 KD in which enrichment is demonstrated for both up- and down-regulated genes. NES: normalized enrichment score. Genes corresponding to RUNX1-bound regions were assessed by utilizing GREAT. (c) Overlap between RUNX1-bound genes and genes differentially expressed upon RUNX1 OE and RUNX1 KD. (d) GSEA of genes down-regulated following RUNX1 OE demonstrates highly significant enrichment in key GBM pathways. (e) Proportions of RUNX1-bound genes within genes differentially expressed following RUNX1 OE respective to the pathways described in (d). (f) Quantitative RT-PCR analysis of the expression of the indicated genes in U87RUNX1-OE 48 h following infection, relative to the expression in U87control cells. Data represent mean ± SD of three independent experiments performed in triplicates. *p < 0.05.
RUNX1 directly regulates the expression of key factors in mesenchymal transformation of GBM
We further evaluated the effect of RUNX1 OE on genes of the MGES. Comparative analysis of RUNX1 occupancy revealed significant enrichment of RUNX1 binding within 100 kb from genes that were up-regulated in mesenchymal GBM compared to genes that were up-regulated in the pro-neural and proliferative subtypes 7 (Figure 4(a)). Additionally, 20% of genes comprising the MGES were differentially regulated upon RUNX1 OE in the U87 cell line (Figure 4(b)). Of note, the majority of these RUNX1 regulated genes were directly silenced upon RUNX1 OE (Figure 4(b) and online resource Table S3). RUNX1 occupied the genomic regions of 28 out of 52 key TFs previously associated with the MGES. 7 Of these, seven were differentially regulated upon ectopic RUNX1 expression. Four TFs, CEBPB, ELK3, TBX2, and MAFF, were indirectly regulated by RUNX1 (Figure 4(c)). The key drivers of the MGES; ZNF238, CEBPB, STAT3, BHLHB2, and FOSL2 were all bound by RUNX1 (Figure 4(d)). Moreover, the expression of ZNF238, CEBPB, and FOSL2 was significantly influenced by RUNX1 manipulation (Figure 4(e)).

RUNX1-mediated gene regulation of the MGES in U87 GBM cell line. (a) Left—percentages of RUNX1 binding within 100 kb from genes of the pro-neural (PN), proliferative (PROL), and mesenchymal (MES) gene expression signatures. Right—percentages of genes of the PN, PROL, and MES that were differentially expressed following RUNX1 OE. Increased proportion (enrichment) of the RUNX1-bound and responsive genes among the MES group, compared to the other two groups. *p < 0.05. (b) Overlap between MGES genes bound and responsive following RUNX1 OE. (c) Key TF-coding genes associated with the MGES stratified both by their RUNX1 binding and by their responsiveness to RUNX1 OE; unbound by RUNX1 non-responsive upon RUNX1 OE (not regulated), bound but not responsive to RUNX1 OE (Bound), not bound but responsive to RUNX1 OE (indirectly regulated), and bound and differentially expressed (directly regulated). (d) RUNX1 ChIP-seq tracks surrounding ZNF238, CEBPb, FOSL2, BHLHB2, and STAT3 genes. *Statistically significant peaks corresponding to RUNX1 binding. (e) Quantitative RT-PCR analysis of the expression of the indicated genes 48 h following RUNX1 overexpression. Data represent mean ± SD of three independent experiments performed in triplicates. *p < 0.05.
Discussion
Deciphering the transcriptional networks that govern transition into pathological cellular state remains a challenge. Being among the most aggressive tumors in humans, the search for master regulators of GBM is of crucial importance. The recently established correlation between unique transcriptional signatures and tumor aggressiveness shed light on new players in GBM progression.7,8 RUNX1, previously unrecognized as a substantial participant in GBM, emerged as a novel key regulator of the aggressive mesenchymal subtype. 7 Here, we investigated the role of RUNX1 in U87 GBM cells and assessed the phenotypic manifestation following its overexpression in light of both its impact on the transcriptome and its global genome occupancy. RUNX1 was previously described as an activator of gene expression, a positive driver of the GBM mesenchymal aggressive phenotype. 7 The data presented here suggest that substantial OE of RUNX1 in U87 GBM cells inhibits tumor growth by extensive down-regulation of target genes, deregulation of key developmental pathways, and disruption of the MGES.
Genome-wide occupancy patterns of RUNX1 were previously described in various cell types and biological contexts.43,44,50–52 Nevertheless, to our knowledge, RUNX1 genome occupancy was never related to genes that were associated with GBM or brain tumors in general. The enrichment of RUNX1 occupancy surrounding genes previously related to GBM development, as well as genes involved in angiogenesis, a hallmark of the mesenchymal subtype of GBM, is consistent with the phenotype observed and with the previously proposed role of RUNX1 as a co-driver of the MGES. Although a large proportion of RUNX1 ChIP-seq peaks were located in promoter regions, RUNX1 binds preferentially to regions distant from its target genes. This was demonstrated by the superior correspondence between RUNX1 binding and RUNX motifs within remote enhancers compared with promoters. Additionally, co-occupancy of RUNX1 and AP-1 factors including FOSL2 previously demonstrated in other biological processes,14,43,44,50 as well as CEBP, another MGES driver, was enriched only within distant regions. These data support the notion that some of the reported RUNX1 promoter occupancy resulted from chromatin looping.
Augmented expression of RUNX1 led to a massive transcriptional response. Although previously assigned as a gene activator in GBM, we show that when markedly overexpressed in the U87 GBM cell line, RUNX1 predominantly acts as a repressor. This was demonstrated by the increased proportion of RUNX1-mediated gene silencing, accompanied by a corresponding enrichment of genome occupancy surrounding down-regulated genes, compared to activated genes. RUNX1 OE led to direct down-regulation of the expression of numerous genes in key pathways in GBM development such as EMT, MTORC1, hypoxia, and TNFa.53–56 Of note, genes that were up-regulated upon RUNX1 OE did not significantly correspond to any known transcriptional pathways or expression signatures. Moreover, the specificity of the RUNX1 effect when overexpressed was further corroborated by the minute transcriptional response following RUNX1 silencing. It was previously shown that the key drivers of the MGES both co-regulate the expression of target genes and also directly affect each other’s expression. 7 Here, we demonstrated that RUNX1 influenced the MGES both directly and indirectly, with increased propensity for down-regulation of MGES-associated factors. RUNX1 affected MGES signature and directly de-regulated the expression of other MGES master regulators in the U87 GBM cell line.
Overall, the data presented here emphasize the role of RUNX1 as a major gene regulator in GBM and raise the possibility that OE of RUNX1 may lead to a substantial transcriptional response culminating in deregulation of major signaling pathways and the MGES, leading to inhibited tumor growth. This turns a spotlight on RUNX1 as a potential target for future novel therapies aiming to reduce the aggressiveness of GBM. Validation of these data in other cell types and experimental systems is warranted.
Footnotes
Declaration of conflicting interests
The author(s) declared no potential conflicts of interest with respect to the research, authorship, and/or publication of this article.
Funding
The author(s) received no financial support for the research, authorship, and/or publication of this article.
References
Supplementary Material
Please find the following supplemental material available below.
For Open Access articles published under a Creative Commons License, all supplemental material carries the same license as the article it is associated with.
For non-Open Access articles published, all supplemental material carries a non-exclusive license, and permission requests for re-use of supplemental material or any part of supplemental material shall be sent directly to the copyright owner as specified in the copyright notice associated with the article.