
Abstract
In this study, we investigated whether miR-125a participated in the resistance of the leukemia cell lines to the chemotherapeutic agent daunorubicin. Higher expression of miR-125a is correlated with lower treatment response and shorter overall survival in acute leukemia patients. Overexpression of miR-125a induced drug resistance in HL-60, K562, and THP-1cell lines through reducing apoptosis. We also showed that miR-125a mediated daunorubicin resistance in leukemia cell lines through the decrease of GRK2 and Puma which were proved to be direct targets of miR-125a. This study may provide novel therapeutic targets for therapy and improve predictions of therapeutic responses in leukemia to daunorubicin.
Introduction
Acute leukemia is a hematopoietic malignancy that develops from a single clone of a hematopoietic stem/progenitor cell. Modern chemotherapeutic regimens use 10 or more different drugs over a 2- to 3-year period to treat acute leukemia. The complete remission rate of acute leukemia was significantly improved; however, there are still many patients who have not achieved complete remission. The 5-year overall survival (OS) rate is only 40%–50%. 1 The complex chemotherapy schedules and the underlying genetic heterogeneity of the disease have made it difficult to understand the biological mechanisms for the variations in response to therapy, and relapses occur in all cytogenetic subtypes.
MicroRNAs (miRNAs) regulate many cellular functions, including cell proliferation, differentiation, and apoptosis, by specific target genes through translational repression or direct messenger RNA (mRNA) degradation.2–4 In recent years, an increasing number of miRNAs in acute leukemia have been identified and linked to differences in biology and prognosis. The family of miR-125 contains three members: hsa-miR-125a, hsa-miR-125b-1, and hsa-miR-125b-2, transcribed from three loci located on chromosomes 19q13, chromosomes 11q23, and chromosomes 21q21, respectively. It is proved that miR-125b is involved in myelodysplastic syndrome, acute myeloid leukemia, B-cell acute lymphoid leukemia (B-ALL), megakaryoblastic leukemia, and chronic lymphoid leukemia.5–9 Moreover, it contributes to leukemogenesis, 10 increases drug resistance,10,11 and predicts the progression and prognosis of leukemia. In our previous research, we showed that miR-125b is involved in resistance to daunorubicin (DNR) by depression of GRK2 and Puma. Recent research shows that miRNA-125 family members exert a similar role in the regulation of murine hematopoiesis. So, we wanted to know whether miR-125a has the same role in human leukemia as miR-125b as shown in our previous studies.
In this study, we aimed to verify that miR-125a promotes the occurrence of acute leukemia and that miR-125a confers drug resistance in leukemia cell lines by inhibiting apoptosis.
Materials and methods
Cell culture
The HL-60, K562, THP-1, and HEK293T cell lines were purchased from Type Culture Collection of the Chinese Academy of Sciences, Shanghai, China. The HL-60, K562, THP-1, and HEK293T cell lines were cultured in Roswell Park Memorial Institute (RPMI) 1640 medium (HyClone) and supplemented with 10% fetal bovine serum (Gibco). The HEK293T cells were grown in Dulbecco’s Modified Eagles Medium (DMEM; HyClone) with 10% fetal bovine serum.
Overexpression of miR-125a and knock down of miR-125a
For obtaining retroviral overexpression of miR-125a, 10 µg expression vector or empty vector with 10 µg packaging plasmid (gag/pol and VSVG) was incubated with FuGENE 6 (Roche) for 15 min at room temperature and subsequently added to the HEK293T cells. After 48 h, the retroviral supernatant was harvested. Then, 1 × 10⁶ HL-60, K562, and THP-1 cells were seeded in 6-well plates that were pre-coated with RetroNectin (Takara). Transient transfections of cells were treated by a spin infection with 1 mL retroviral supernatant. The green fluorescent protein (GFP)-positive cells were approximately 70%–90%.
Using the work of Starczynowski et al. 12 as reference, an imperfect base pairing between the miRNA and miR-125a “sponge” was designed to impair endonucleolytic cleavage by Argonaute-2. The miR-125a “sponge” sequence was 5′-TCACAGGTTACTCAGGGA-3′. It was cloned into the pRetroQ-mCherry-C1 retroviral vector (Clontech). As mentioned above, HL-60 cell line was infected with miR-125a “sponge” vector to generate HL-60 cells that knock down the expression of miR-125a. After virus infection, HL-60 cells were screened by puromycin (Sigma) at a final concentration of 2 µg/mL. The red fluorescent protein (RFP)-positive cells were almost 100%.
Luciferase reporter assay
The 3′ untranslated region (3′UTR) for GRK2 and Puma was cloned into the psiCHECK-2 vector (Promega) at the XhoI and NotI sites. The GRK2 3′UTR was polymerase chain reaction (PCR) amplified from Human Genomic DNA (Roche) with the following primers: forward, 5′-TCGCTCGAGCCCGCCCACCCGCCTTTTA-3′ and reverse, 5′-TCGGCGGCC GCAATCAGGCACCATTTT-3′. The Puma 3′UTR was PCR amplified with the following primers: forward, 5′-TCGCTCGAGGACTTTCTCTGCACCAT-3′ and reverse, 5′-TAAGCGGCCGCGGC AAGCAGA AAGAGT-3′. The length of 3′UTR of GRK2 and PUMA was 1253 and 977 bp, respectively. The amplicon was cloned into a modified MSCV-PGK-GFP vector (Clotech). The sequences and cloning direction of these PCR products were validated by DNA sequencing.
The K562 cells were plated in 96-well plates at 5000 cells per well the day before transfection. Transfection was performed in triplicate with FuGENE 6 (Roche) and 150 ng of the plasmid mixture (135 ng of the miR-125a expression vector and 15 ng of the reporter vector). Cells were then used for determination of luciferase activity at 48 h. The Dual-Glo Luciferase Assay kit (Promega) was used for detection of both firefly and Renilla luciferase activity by use of the BMG NOVOstar machine. The Renilla luciferase readings were normalized to the firefly luciferase activity in the corresponding well.
Cell viability assay
In order to determine the viability of cells, they were trypsinized, counted, and seeded into 96-well plates and were treated with serial dilutions of DNR (Pfizer). Cell viability was determined 48 h after DNR treatment using the luminescent cell viability assay (Promega) through luminescence testing by BMG NOVOstar machine.
SiRNA transfection
The K562 cells were seeded in 6-well plates. Transient transfections of GRK2 or Puma siRNA (Santa Cruz Biotechnology) were accomplished with FuGENE 6 (Roche), following the manufacturer’s protocol. The transfection efficiency was calculated by the percentage of fluorescein-labeled cells and was approximately 80%. Forty-eight hours after the transfection, the cells were harvested for further analysis.
Protein extraction and western blotting
For western blot analysis, cells were lysed in 1× cell lysis buffer (Beyotime). Lysis buffer was supplemented with a protease inhibitor cocktail (Roche). Protein extracts from cells were resolved on 10% sulfate sodium salt polyacrylamide gel, transferred to a polyvinylidene difluoride membrane (PVDF; Millipore), blocked, and then incubated with rabbit polyclonal anti-GRK2, anti-Puma antibody (Santa Cruz Biotechnology), anti–caspase 3 antibody (Epitomics), and anti–cleaved caspase 3 antibody (Cell Signaling Technology). Protein expression was visualized by enhanced chemiluminescence (ECL; Millipore) and normalized to anti-β-actin antibody (Cell Signaling Technology).
Patients and sample collection
Patients’ samples were collected from acute leukemia patients who underwent routine diagnostic bone marrow aspiration or at follow-up after therapy, after informed consent was obtained. All were diagnosed with acute leukemia according to World Health Organization (WHO) criteria. Mononuclear cells were separated by Ficoll-Hypaque density-gradient centrifugation. A total of 44 acute leukemia patients from Shanghai Jiao Tong University Affiliated First People’s Hospital were enrolled in this study between May 2011 and November 2012. Twenty-seven of the patients were primary patients, and 17 of the patients were recurrence patients or no remission patients. In our study, exclusion criteria were concomitant or previous cancer. Patients’ characteristics are listed in Table 1. For acute myelogenous leukemia (AML) patients, 12 of 25 patients were treated with idarubicin and cytarabine; 7 of 25 patients were treated with mitoxantrone and cytarabine; 3 patients were treated with decitabine; 1 patients were treated with daunorubicin and cytarabine and 3 have no treatment. For chromic myelogenous leukemia blast crisis patients, 3 were treated with imatinib, and 2 underwent no treatment. For acute lymphoma leukemia patients, 4 of 11 patients were treated with chemotherapy containing mitoxantrone, 3 were treated with chemotherapy containing DNR, 2 underwent no treatment. All of the primary patients or no remission patients were followed up for at least 12 months or until recurrence. Part of patients (n = 27) who were on long follow-up were analyzed for OS. The principal end points in the analysis of treatment results were event-free survival (EFS) and OS. Data were excluded if patients had no event at last follow-up. Healthy sample was collect from three healthy adults. All experiments were approved by the Ethics Committee of Shanghai Jiao Tong University Affiliated First People’s Hospital and carried out in accordance with the approved guidelines.
Acute leukemia patients’ characteristics.

ALL: acute lymphoma leukemia; AML: acute myelogenous leukemia; WBC: white blood cell; FAB: French–American–British classification; M2: undifferentiated type of acute myeloid leukemia; M4: acute myelomonocytic leukemia; M5: acute monocytic leukemia; CML-BC: chronic myelogenous leukemia blast crisis.
RNA extraction and quantitative real-time polymerase chain reaction
Mature miRNA expression was evaluated by TaqMan MicroRNA assays (Applied Biosystems, Life Technologies) specific for miR-125a. Total RNA was extracted from the cells using TRIzol Reagent (Invitrogen) according to the manufacturer’s instructions. Briefly, 10 ng of total RNA was retrotranscribed with miRNA-specific primers using a TaqMan MicroRNA reverse transcription kit (Applied Biosystems). Quantitative real-time polymerase chain reaction (qRT-PCR) was then performed using TaqMan MicroRNA assays (Applied Biosystems), according to the manufacturer’s protocol on a Applied Biosystems StepOnePlus Real-Time PCR system. U6 was used as a reference for normalization of ΔCT values. The analyses were based on the comparative Ct method (2-ΔΔCt) with miR-125a and U6 as the reference genes for miRNA. 13 Significance in qRT-PCR results was determined by t-test. Each sample was analyzed in triplicate.
Statistical analysis
Results are shown as the mean ± SE of at least 3 experiments each. EFS 14 was measured from the date of entry into our study to the date of induction failure, or relapse from complete remission (CR), or death from any cause. OS was calculated from the date of entry into our study to the date of death from any cause. EFS was calculated as the interval between diagnosis and the recurrence of disease or the death due to any reason. Survival curves were compared by using Kaplan–Meier analysis. Student’s t-test was performed for comparisons between two groups. The statistical analyses were performed with SPSS 13.0 software. A value of p < 0.05 was considered statistically significant.
Results
MiR-125a is highly expressed in acute leukemia
To clarify the differential expression pattern of miR-125a, we performed TaqMan RT-PCR assays to bone marrow samples of acute leukemia (n = 44), including patients with AML and ALL. MiR-125a expression was observed to be markedly higher in patients with acute leukemia than that in the healthy controls (Figure 1(a)). MiR-125a showed high expression in acute myeloid leukemia patients (average 462,521-fold higher) compared with ALL patients (average 114,773-fold higher; p = 0.405). MiR-125a showed higher expression in recurrence patients or no remission patients than primary patients (p = 0.335).

The correlation between miR-125a and prognosis in acute leukemia patients. (a) The expression of miR-125a was higher in AML and ALL patients than that in the healthy controls. (b) EFS was significantly different between high group and low group (p < 0.01). (c) OS was significantly different between high group and low group (p = 0.032).
The expression of miR-125a was divided into two risk groups by the median. The median was 1247.56-fold higher than normal sample individually. For lower median group patients, 16 patients relapsed or had no remission, with an EFS of 27.3%, and average EFS was 16.74 months (95% confidence interval [CI], 8.49–24.98); for upper median group patients, all of the patients relapsed or had no remission, and average EFS was 3.0 months (95% CI, 0.76–5.24). The EFS was observed significantly different between the two groups of patients (p < 0.01) (Figure 1(b)). Twenty-seven patients were on long follow-up and were analyzed for OS. For lower median group patients, 9 of 14 patients died, with average OS of 22.84 months (95% CI,12.4–33.29); for upper median group patients, 12 of 13 patients died, and average OS was 15.37 months (95% CI, 8.52–22.22). The OS was observed significantly different between the two groups (p = 0.032) (Figure 1(c)).
Expression of miR-125a affects leukemia cell sensitivity to DNR
To directly test the relationship between miR-125a and chemoresistance in leukemia cells with treatment using DNR, we overexpressed miR-125a in HL-60, K562, and THP-1 cell lines and depressed miR-125 in HL-60 cell line. The HL-60, K562, and THP-1 cells were stably transduced with a MSCV-miR-125a vector to overexpress miR-125a in HL-60, K562, and THP-1 cells. Real-time PCR was used to test the expression of miR-125a. The results showed miR-125a was 3.2 times higher in cells transduced with a MSCV-miR-125a vector than cells transduced with an empty vector in HL-60 cells, and 4.9 times and 4 times in K562 and THP-1 cells (Figure 2(b)). The HL-60, K562, and THP-1 cell lines with overexpression of miR-125a were treated with various doses of DNR. Overexpression of miR-125a was associated with significantly increased survival of HL-60, K562, and THP-1cells (Figure 2(a)). At DNR concentrations higher than 0.1 µM, the HL-60 cells and THP-1 cells had significantly higher survival in overexpression group than control group (p < 0.05). At DNR concentrations higher than 0.01 µM, the K562 cells had a significantly higher survival in overexpression group than control group (p < 0.05).

Overexpression of miR-125a in HL-60, K562, and THP-1 cells sensitizes the cells to DNR. (a) HL-60, K562, and THP-1 cells were transduced with MSCV-miR-125a or an empty vector and were treated with various doses of DNR. The cell viability was detected by luminescent cell viability assay. (b) MiR-125a expression was examined by real-time PCR in HL-60, K562, and THP-1 for control cells and cells that overexpressed miR-125a, respectively. (c). Representative western blots showing caspase 3 pro and cleaved caspase 3 protein levels in HL-60 and K562 cells transduced with an empty vector or the miR-125a vector when cells were exposed to DNR at concentration higher than 0.1 µM at 48 h. Representative western blots showing caspase 3 pro and cleaved caspase 3 protein levels in THP-1 cells when cells were exposed to DNR at concentration higher than 1 µM at 48 h. Activity of caspase 3 was decreased in cells that overexpressed miR-125a than control cells. The results are expressed as mean ± SE from three independent experiments.
We further investigated the effects of knockdown miR-125a on HL-60 cells by transduction with an miR-125a “sponge” vector. The miR-125a “sponge” vector effectively reduced the expression of miR-125a in HL-60 cells verified by TaqMan RT-PCR method. The expression of miR-125a in knockdown cells reduced 75%, compared with control cells (p < 0.001). The expression of miR-125a was significantly lower in knockdown cells than control cells (Figure 3(a)). Knock down of miR-125a was associated with significantly decreased survival of the HL-60 cells (Figure 3(b)). At DNR concentrations higher than 0.1 µM, HL-60 cells that knocked down miR-125a had a significantly lower survival than control cells (p < 0.05). This suggests that overexpression of miR-125a may contribute to DNR resistance to the HL-60, K562, and THP-1 cell lines, respectively; depression of miR-125a contributes to DNR sensitivity to the HL-60 cells. There is a relation between the expression level of miR-125a in leukemia cells and sensibility to DNR.

Knock down of miR-125a in HL-60 cells. (a) MiR-125a expression was examined by real-time PCR. (b) HL-60 and HL-60 knockdown cells were transduced with miR-125a “sponge” vector or an empty vector. The results are expressed as mean ± SE from three independent experiments. *p < 0.05. (c) Cell lysates were immunoblotted with anti-GRK2 and Puma antibody. β-Actin was used as loading control. Blots were representative of three independent experiments. (d). Representative western blots showing caspase 3 pro and cleaved caspase 3 protein levels in HL-60 cells and HL-60 knockdown cells when cells were exposed to DNR. The results are expressed as mean ± SE from three independent experiments. *p < 0.05.
High expression of miR-125a inhibits apoptosis
To provide biochemical evidence for the occurrence of apoptosis, we determined whether overexpression of miR-125a decreases the release of activated caspase 3. Caspase 3 pro and cleaved caspase 3 were tested by western blot. As expected, when the concentration of DNR was 0.1 µM, HL-60 and K562 cells with overexpression of miR-125a had lower expression of activity caspase 3 than control group at 48 h. Overexpression of miR-125a was associated with significantly increased survival of THP-1 cells at DNR concentration higher than 1 µM at 48 h (Figure 2(c)). When the expression of miR-125a was inhibited, caspase 3 pro was lower in HL-60 knockdown cells than control cells while cleaved caspase 3 was higher at DNR concentration higher than 0.1 µM at 48 h (Figure 3(d)). These results show that overexpression of miR-125a induced DNR resistance through blocking apoptosis, and inhibition of miR-125a induced sensitivity to DNR in HL-60 cells through increasing apoptosis. MiR-125a induces leukemia cells’ resistance to DNR through apoptosis.
MiR-125a downregulates GRK2 and Puma expression
To investigate postulated effects of miRNA on mRNA expression, the target mRNAs of miR-125a were obtained from the miRBase (http://www.mirbase.org) and the TargetScan database (http://www.targetscan.org) (Figure 4(a)). Correlations between miR-125a and the expression of its predicted targets, including the number of binding sites in the respective mRNAs and the variation of the correlation coefficients, were statistically analyzed. Among these potential targets, we paid more attention to GRK2 and Puma which might have effects on cell apoptosis. So, we hypothesized that GRK2 and Puma are direct targets of miR-125a.
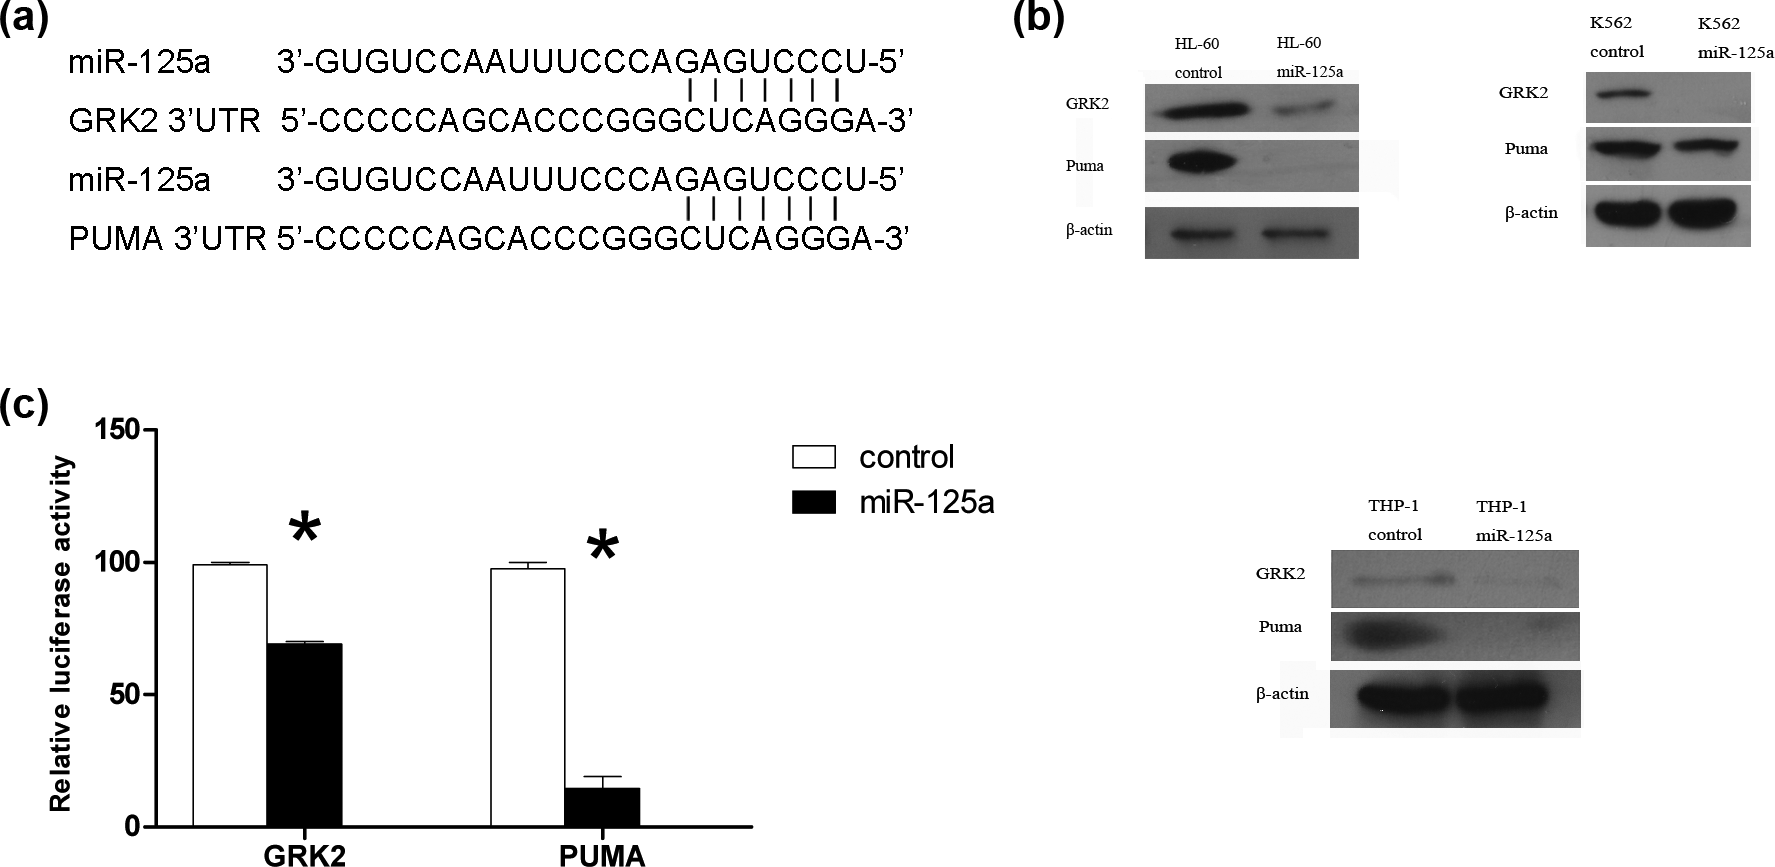
GRK2 and Puma were direct targets of miR-125a. (a) A nucleotide comparison between the miR-125a seed sequence and the GRK2 3′UTR and Puma 3′UTR sequence. (b) Cell lysates were immunoblotted with anti-GRK2 and Puma antibody. β-Actin was used as loading control. Relative expression level of GRK2 and Puma protein in HL-60, K562, and THP-1 cells. Blots were representative of three independent experiments. (c) The effect of miR-125a on GRK2 and Puma was assessed with the luciferase reporter system. The miR-125a expression vector, together with the luciferase reporter vector or control vector, was cotransfected into the 293T cells. The data showed that miR-125a binds to the GRK2 3′UTR and Puma 3′UTR, resulting in reduced luciferase expression. Data are mean ± SE from three independent experiments.
To confirm this, the HEK293T cells were separately cotransfected with miR-125a and GRK2 or Puma 3′UTR luciferase reporter. Transfections with control vector were performed in parallel. As shown in Figure 3(a), cotransfection resulted in a 26% and 86% reduction of the reporter activity for GRK2 and Puma, respectively (p < 0.01). Taken together, these results provide experimental validation that GRK2 and Puma 3′UTR are targets of miR-125a. We then assessed whether miR-125a regulated GRK2 and Puma expression in HL-60, K562, and THP-1 cells. We hypothesized that overexpression of miR-125a may reduce the GRK2 and Puma protein level. As is shown in Figure 4(b), GRK2 and Puma protein levels were lower in HL-60, K562, and THP-1 cells that overexpressed miR-125a, compared with corresponding control cells at DNR concentration higher than 0.1 µM at 48 h. The obvious decrease in GRK2 and Puma in THP-1 cells that overexpressed miR-125a at DNR concentration higher than 1 µM at 48 h. As for HL-60 cells that knock down miR-125, GRK2 and Puma protein level increased significantly at DNR concentration higher than 0.1 µM (Figure 3(c)). These results show that GRK2 and Puma are targets of miR-125a in these cells.
GRK2 and Puma play a key role in DNR resistance
We used GRK2 or Puma siRNA to silence the expression of GRK2 or Puma in HL-60 cells. Interestingly, we found that HL-60 cells transfecting GRK2 and Puma siRNA had similar survival pattern as miR-125a overexpression (Figure 5(a)). As shown in Figure 5(c), the expression of GRK2 and Puma was significantly decreased after transfection of GRK2 siRNA at DNR concentration higher than 1 µM. Furthermore, we measured the changes in caspase 3 to determine the role of miR-125a in the apoptosis pathway. We found that caspase 3 was decreased after GRK2 siRNA treatment (Figure 5(b)). Similarly, the expression of Puma was significantly decreased with transfection of Puma siRNA (Figure 5(b)). And we found that cells transfecting Puma siRNA had similar survival pattern as miR-125a overexpression, and cleaved caspase 3 protein was also decreased on DNR treatment in Puma siRNA–transfected cells (Figure 5(b)). These results show that GRK2 and Puma play a key role in DNR resistance. These results indicate that miR-125a contributes to DNR resistance through reducing the expression of GRK2 and Puma in leukemia cells.
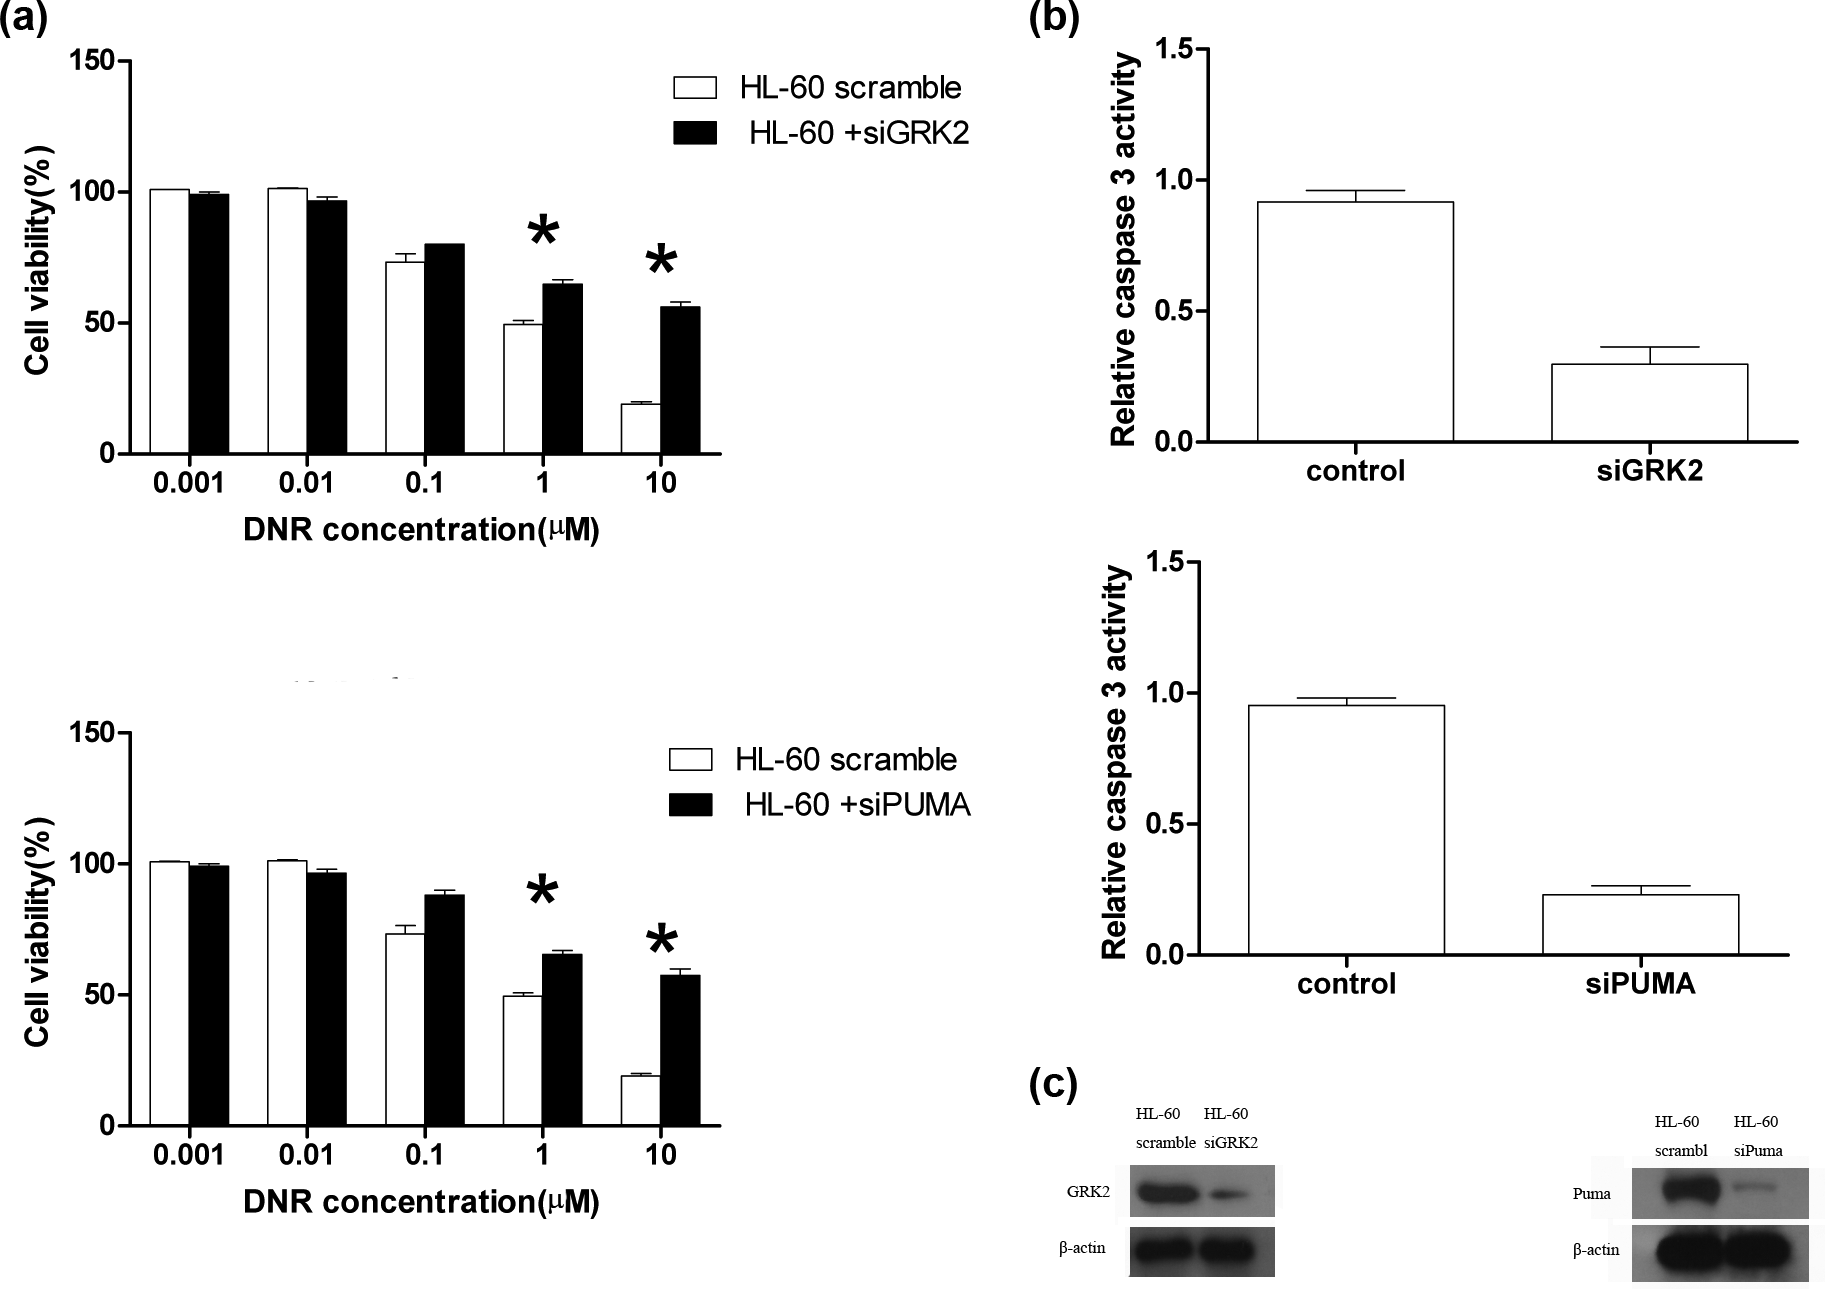
Silencing the expression of GRK2 and Puma could induce leukemia cells resistant to daunorubicin. (a) HL-60 cells silenced the expression of GRK2, and Puma were treated with various doses of DNR. (b) Relative caspase 3 activity in HL-60 cells silenced the expression of GRK2 and Puma when cells were exposed to DNR at concentration higher than 0.1 µM at 48 h. (c) Representative western blots showing GRK2 and Puma protein levels in HL-60 cells silenced the expression of GRK2 and Puma when cells were exposed to DNR. The results are expressed as mean ± SE from three independent experiments.
Discussion
In this article, we showed that the expression of miR-125a significantly increases in acute leukemia patients (p < 0.05), with the exception of those classified as M3. The EFS and OS were observed to be significantly different between the low and high groups of patients. Remission patients may have longer EFS than patients in whom event occurred. High expression of miR-125a is correlated with lower treatment response. MiR-125a may predict poor prognosis. The research was the same with that in non–small cell lung cancer (NSCLC). The miRNA expressions should be further evaluated as biomarkers for the early detection and prognosis of NSCLC patients. 15 The lost expression of miR-125a-5p was associated with shorter OS. It is also proved that differential expression of miR-125a-5p predicts the progression and prognosis of multiple myeloma (MM). 16
Chemotherapy has long been the method of choice for the treatment of leukemia; however, cancer cells frequently develop an almost uncanny ability to resist the effects of cancer chemotherapeutic agents. MiRNAs are small non-coding RNAs that are evolutionarily conserved and also involved as regulators of gene expression through the silencing of mRNA targets. There is an emerging role of miRNAs in resistance to cancer treatments. They are involved in many different cancer types, and a plethora of mechanisms have been postulated for the roles that miRNAs play in the development of drug resistance. In our research, DNR-induced drug resistance is associated with upregulation of miR-125a in HL-60, K562, and THP-1 cell lines. MiR-125a may regulate the survival of leukemia cells by targeting GRK2 and Puma protein and causing subsequent changes of apoptosis in HL-60, K562, and THP-1 cells. In AML, miR-125a increased in response to a de-methylating agent, decitabine. 17 Profiling revealed that the ErbB pathway significantly decreased ectopic miR-125a and resulted in inhibition of cell cycle proliferation and progression with enhanced apoptosis. In MM cells, miR-125a downregulated the expression of p53 pathway-related genes. 16 MiR-125a improved anti-proliferative and proapoptotic effects of gefitinib on the neural progenitor cells (NPCs). 18 Jiang et al. 19 reported that miR-125a could induce apoptosis in A549 cells in a p53-dependent manner by increasing p53. In addition, other lines of evidence have shown that miR-125a could inhibit Her2 protein levels in the breast cancer cell line 20 and can induce apoptosis in the gastric cancer cell line NUGC4 by suppressing Her2 protein levels. 21 In cervical carcinoma cell lines Ca-Ski and HeLa, lentivirus-mediated miR-125a-5p upregulation inhibited cancer proliferation and migration in vitro and cervical carcinoma transplantation in vivo. But miRNA may play different roles in different tissues. Tiwari et al. 22 showed that miRNA-125a reduces proliferation and invasion of oral squamous cell carcinoma cells by targeting estrogen-related receptor α.
The relationship of miR-125a and drug resistance has not been investigated in leukemia. In our research, upregulation of miR-125a increased cell survival than control cells, and downregulation decreased cell survival, indicating that high expression of miR-125a inducted drug resistance in the treatment of DNR. Yao et al. 23 showed that miR-125a was upregulated in chemoresistant SW1990GZ cells when compared with SW1990 cells. Overexpression of miR-125a increased the chemoresistance to gemcitabine in SW1990 cells, while downregulation of miR-125a in SW1990GZ cells increased chemosensitivity to gemcitabine. MiR-125a promotes chemoresistance to gemcitabine in pancreatic cells through targeting A20.
In conclusion, this report has shown that the resistance of DNR relates to the upregulation of miR-125a and in turn downregulation of its target gene GRK2 and Puma. The higher expression of miR-125a is assumed to inactivate caspase pathway and block apoptosis. Therefore, dysregulation of miR-125a might lead to the acquisition of DNR resistance in AML. These results thus suggest a potential that may represent a suitable biomarker for predicting the effect of chemotherapy. Hence, miR-125a-based gene therapy may provide a novel approach for the future of cancer therapy, which may provide novel therapeutic targets or molecular biomarkers for therapy and improve predictions of therapeutic responses in leukemia.
Footnotes
Acknowledgements
The author would like to thank the staff of the Department of Hematology of Shanghai Jiao Tong University Affiliated First People’s Hospital.
Declaration of conflicting interests
The author(s) declared no potential conflicts of interest with respect to the research, authorship, and/or publication of this article.
Funding
This study was supported by Tongji University (no. 1508219068), the Shanghai Municipal Natural Science Foundation (no. 14ZR1433500), Shanghai Municipal Health Bureau Foundation (no. 20124250) and the Key Scientific Research Project grant provided from the Cancer Center of the Shanghai General Hospital (no. 040517).