
Abstract
The prediction of who develops metastasis has been the most difficult aspect in the management of breast cancer patients. The lymph node metastasis has been the most useful predictor of prognosis and patient management. However, a good proportion of patients with lymph node positivity remain disease free for 5 years or more, while about a third of those who were lymph node negative develop distant metastasis within the same period. This warrants a robust biomarker(s), preferably gene expression based. In order to elucidate gene-based biomarkers for prognosis of breast cancers, gene expression profiling of primary tumors and follow-up for over 5 years has been performed. The analysis revealed a network of genes centered around the tripartite motif-containing protein 28 as an important indicator of disease progression. Short hairpin RNA–mediated knockdown of tripartite motif-containing protein 28 in breast cancer cells revealed a decreased expression of epithelial-to-mesenchymal transition markers and increased expression of epithelial markers, decreased migration and invasion, and increased chemosensitivity to doxorubicin, 5-fluorouracil, and methotrexate. Furthermore, knockdown of tripartite motif-containing protein 28 resulted in the decrease of stemness as revealed by sphere formation assay as well as decreased expression of CD44 and Bmi1. Moreover, tripartite motif-containing protein 28 knockdown significantly reduced the tumor size and lung metastasis in orthotopic tumor xenograft assay in immunocompromised mice. The tumor size was further reduced when these mice were treated with doxorubicin. These data provide evidence for tripartite motif-containing protein 28 as a biomarker and a potential therapeutic target for breast cancer.
Keywords
Introduction
Epithelial-to-mesenchymal transition (EMT), stemness, and drug resistance are known to play key roles in cancer progression, metastasis, and treatment management. 1 Loss of epithelial marker expression and gaining of mesenchymal marker expression increases the possibility of migration and invasion of cancer cells and ultimately becomes a stepping stone for the metastasis. 2 Distant metastasis is the predominant cause of death due to cancer and accounts for approximately 90% of breast cancer–related deaths. Hence, it is of utmost importance in cancer treatment to identify which primary tumor will potentially metastasize to distant organs. Toward this, various studies have identified gene signatures that can predict metastasis.3,4 Earlier studies proposed distinct gene signatures in primary tumors that metastasized and those that were restricted to local tissue.5,6 These studies along with an inconclusive correlation between tumor size and metastasis outcome have suggested an “early event” whereby primary tumor cells that eventually metastasize have an inherent trigger for a molecular program for invasion. 7 Tumor biomarkers play a major role in detection of early event and cancer progression. Recent reports suggested that tripartite motif-containing protein 28 (TRIM28) acts as a biomarker in various cancers like lung cancer, colon cancer, and glioblastoma including breast cancer.8–11 TRIM28 is a transcription co-factor that plays a pivotal role in cell proliferation, DNA repair, and differentiation of cells. 12 Over-expression of TRIM28 resulted in the increased expression of EMT genes, migration, invasion, and metastasis in pancreatic cancer cells 13 ; on the contrary, knockdown of TRIM28 in lung cancer cells showed reduced migration and invasion. 14
Another interesting mechanism that has been recently described with relation to metastasis is the existence of a subpopulation of cancer stem cells driving metastasis and chemoresistance. Recent studies described that chemoresistance was associated with self-renewal and anchorage-independent properties of cancer cells along with up-regulation of EMT markers and down-regulation of EMT markers.15,16 In this report, we present evidence for differential expression of genes in a novel network centered on TRIM28 (a member of E3 ubiquitin ligase family) in cohorts of breast cancer patients belonging to groups who proceeded to metastasis or remained disease free for a 5-year period. Furthermore, we show functional significance of TRIM28 by short hairpin RNA (shRNA) knockdown experiments in two breast cancer cell lines. The data suggest significant reduction in stem-like cells, increased chemosensitivity, and reduced invasion and migration of breast cancer cells. Finally, xenograft tumors in nude mice of shTRIM28 cells had reduced size and increased chemosensitivity compared to control tumors.
Materials and methods
Patients and tumor samples
Breast cancer tumor samples were obtained from newly diagnosed patients who presented at the Kidwai Memorial Institute of Oncology (KMIO) in Bangalore between 2006 and 2010. A total of 201 case records were available for patients registered in this period. Among them, 80 cases were selected for microarray analysis. Information regarding age, menopausal status, clinical history, pathology details (estrogen receptor (ER)/progesterone receptor (PR)/human epidermal growth factor receptor (HER)), lymph node (LN) status, and treatment were noted from the patient records. Follow-up information was obtained for 62 of the 80 cases, whose samples were subjected to microarray hybridization. Patient details and samples chosen for distant metastasis analysis and their follow-up data are provided in Table S1.
Microarray
Human tumor tissue samples were obtained from fresh-frozen invasive breast carcinomas and were collected using approved protocols and after obtaining informed consent from the patients. RNA isolation, quality control (QC), and quantification were done as described. 17 Labeling and hybridization on Agilent whole genome human 4X44K arrays (Agilent Technologies, California, CA, USA) were performed on the 80 samples, according to the manufacturer’s protocols.
Data analysis
Data analysis was performed using GeneSpring GX (Agilent Technologies). QC was performed on all microarray results. The raw data were normalized by using Lowess normalization, without baseline transformation and median centering for all the samples. A t-test was performed in GeneSpring GX, and differentially expressed genes were described as those with expression changed by ±1.5-fold and p < 0.05 (not corrected for false discovery rate (FDR)). To compare expression trends, we described differential expression as ±1.2 and p value <0.1 (not corrected for FDR), for a given analysis. To identify true up- and down-regulated genes, a second filter was applied in that at least 50% of the samples are expected to show greater or less than 1.5-fold regulation with respect to normal breast tissue, for the given gene. Additional data were mined from the GSE18229 dataset, a predominantly Caucasian breast cancer dataset that profiles primary tumors of 199 breast cancer patients and also reports their clinical outcomes. All differential expression analysis was performed using the same criteria as described above.
Cross-comparison of microarray platforms
Comparison between our Indian cohort and the study described in the GSE12889 dataset revealed an overlap of 75% of the probes in between the two studies. All the common probes in both datasets were classified into four sub-groups based on their up- or down-regulation, irrespective of the absolute fold change and p value. Those probes that are positively or negatively regulated in metastatic primary tumors compared to disease-free tumors in both studies were considered “matched.” Those that were up-regulated in one data and down-regulated in the other were considered “unmatched.” In all, 66% of the common probes were “matched” in both cohorts. These are genes that are differentially regulated in the Indian patient tumors that show a similar trend of up- or down-regulation in the second dataset. Since differentially expressed gene lists with high fold change and p-value cut-offs, from two separate experiments, do not show good overlap, a less stringent statistical criterion for cut-offs in fold change and p values were considered for analysis. To build the network, we selected those genes that were significantly expressed in the Indian dataset (>1.5-fold) and in the GSE18229 list, with lower threshold (fold change to >1.2) for differential expression.
Gene set generation and comparison
Overlaps between any two distinct sets of genes are assessed in terms of their actual overlap, compared to the overlap with any random gene set. A total of 100 random gene sets, of genes that are not biologically connected, are generated of the same size as the gene set of interest. Overlap of the query set is estimated with each of these random sets and the minimum and maximum overlaps noted. If the actual test set overlap falls outside the range of the random overlap, then the overlap is considered significant.
Clustering analysis was run on GeneSpring GX for the provided list of genes and samples. Hierarchical clustering was performed using “Pearson Uncentered” similarity measure and “complete” for the linkage rule.
Validation of microarray data by quantitative real-time polymerase chain reaction
For quantitative real-time polymerase chain reaction (qRT-PCR) analysis, total RNA was reverse transcribed using a complementary DNA (cDNA) synthesis kit (Applied Biosystems, Foster City, CA, USA). qRT-PCR was performed in triplicates using DyNAmo™ SYBER Green 2× mix (Finnzymes, Keilaranta, Finland) in an ABI Prism 7900HT sequence detection system and analyzed with SDS2.1 software (Applied Biosystems). The expression of TATA box binding protein (TBP), whose expression was consistent across normal and breast cancer tissues in the microarray experiments, was used for normalization. The sequences of the primers used in this study are given in Table S3.
Cell lines and cell culture
Breast cancer cell lines MDA-MB-231 and BT-474 (obtained from American Type Culture Collection (ATCC, Manassas, Virginia, USA)) were cultured in Dulbecco’s Modified Eagle Medium (DMEM; high glucose; Sigma-Aldrich, USA) supplemented with 10% fetal bovine serum (FBS; Invitrogen, Waltham, MA USA); media also included penicillin (1 kU/mL) and streptomycin (0.1 mg/mL). 18 Cell lines were maintained under standard cell culture conditions of 37°C, 5% CO2 in a humidified incubator (Thermo, Waltham, MA, USA).
Transfections and generation of stable clone
TRIM28 knockdown stable cells were generated by transfecting MDA-MB-231 cells and BT-474 cells with shRNA construct targeting TRIM28 (shTRIM28) or non-targeting shRNA retro-viral vectors (control shRNA; OriGene, Rockville, MD, USA) using Lipofectamine-2000. Stable cells were generated by selection with puromycin (0.5 µg/mL) followed by a flow cytometer–based sorting procedure (MoFlo XDP; Beckman Coulter, Brea, California, USA) for green fluorescent protein (GFP) expression encoded (tagged with vector) by the vector and were expanded and frozen for future use. Knockdown was confirmed by western blot analysis and quantitative PCR analysis.
Immunoblot analysis
Cell lysates were prepared using lysis buffer with 1% NP40 detergent, 0.5% sodium deoxycholate, 0.1% sodium dodecyl sulfate (SDS), 50 mM sodium fluoride, 1 mM sodium orthovanadate, 10 mM sodium pyrophosphate (Sigma-Aldrich), and protease inhibitors (Roche, Risch-Rotkreuz, Switzerland). Protein concentrations were quantified with Bradford reagent, and an equal amount of protein was resolved by sodium dodecyl sulfate polyacrylamide gel electrophoresis (SDS-PAGE) using a Bio-Rad apparatus, transferred to polyvinylidene fluoride (PVDF) membrane (Millipore, Billerica, MA, USA), and probed with appropriate antibodies. Horseradish peroxidase (HRP)–coupled secondary antibodies were obtained from Jackson ImmunoResearch (West Grove, PA, USA), and immunoblots were visualized using PICO reagent (Pierce, IL, USA). The following primary antibodies were used: Bmi1, CD44, Slug (Cell Signaling Technology, Beverly, MA, USA), TRIM28 (Abcam, Cambridge, MA, USA), E-cad, N-cad, fibronectin (BD Biosciences, San Jose, CA, USA), and vimentin (Sigma-Aldrich). Anti-α-tubulin antibody (Calbiochem, Darmstadt, Germany) was used as the loading control in all western blots.
Wound healing assay
MDA-MB-231 cells expressing shTRIM28 cells and control shRNA cells were seeded in 60 mm dishes. After 12 h of seeding, the cells were treated with 10 µg/mL of mitomycin C in serum-free media (Calbiochem) for 2 h to arrest proliferation following which two wounds were made using a P-200 pipette tip. Thereafter, cells were cultured for 48 h with and without 10% FBS media. Photomicrographs were taken at 0 and 48 h of wound generation. The distance migrated was quantified using ImageJ capture software and plotted as a difference of wound width between 0 and 48 h.
Matrigel invasion assay
MDA-MB-231 cells expressing shTRIM28 cells and control shRNA cells (20 × 103) were seeded in BD BioCoat™ Matrigel™ (Corning Life Sciences, Corning, New York, USA) invasion chambers. After 20 h, the non-invaded cells were removed, and the invaded cells were fixed with 4% paraformaldehyde and stained with crystal violet blue. Photomicrographs of the invasion chambers were taken at 10×. The number of invaded cells was counted from these images using Adobe Photoshop 7.0 software and plotted as a graph.
CD44/CD24 analysis
The cells were trypsinized and were incubated in a 37°C incubator for 60 min for surface antigen recovery and stained with CD24-PE and CD44-PE-Cy7 (BD Biosciences) for 45 min at 4°C in dark. Stained cells were washed twice with phosphate-buffered saline (PBS) and were analyzed in BD FACSCanto II (BD Biosciences). Unstained cells, CD44-alone stained cells, and CD24-alone stained cells served as controls.
Sphere formation assay
For assessing the sphere-forming efficiency, breast cancer cells (MDA-MB-231 or BT-474) stably expressing shTRIM28 or control shRNA were trypsinized, counted (1 × 10⁵), re-suspended in 1.5% methyl cellulose (in DMEM with 20% FBS), seeded on noble agar (1%) coated culture dishes, and allowed to grow for 10 days. Total number of spheres per 15 fields was counted under a 10× fluorescent microscope. Quantification graphs were made using GraphPad Prism 5 software.
Cytotoxicity assay
MTT (3-(4,5-dimethylthiazol-2-yl)-2,5-diphenyltetrazolium bromide) assay was performed in triplicates in 96-well plates (Greiner Bio-One, Frickenhausen, Germany) using shTRIM28 stable cells (MDA-MB-231 and BT-474 cell lines). After 12 h of seeding, various concentrations of doxorubicin (DOX; Sigma-Aldrich), 5-fluorouracil (5-FU; Sigma-Aldrich), and methotrexate (MTX; Sigma-Aldrich) were added and the cells were incubated for another 48 h. MTT (5 mg/mL) reagent (Sigma-Aldrich) was added to each well, and the plate was incubated for 4 h until the formazan crystals were formed. Crystals were dissolved in dimethyl sulfoxide (DMSO), and the plate was read in an enzyme-linked immunosorbent assay (ELISA) reader at 575 nm. Cell viability was expressed as the percentage of the absorbance of drug-treated cells, relative to that of the untreated controls.
Proliferation assay
Proliferation assay was performed in triplicates in 96-well plates (Greiner Bio-One) using shTRIM28 stable cells. Stable cells (6 × 10³) were seeded and harvested for every 24 h for MTT assay till 96 h. MTT (5 mg/mL) reagent (Sigma-Aldrich) was added to each well, and the plate was incubated for 4 h until the formazan crystals were formed. Crystals were dissolved in DMSO, and the plate was read in an ELISA reader at 575 nm.
Cell cycle assay
For cell cycle analysis, MDA-MB-231- or BT-474-expressing control shRNA or shTRIM28 cells (5 × 10⁵) were seeded into 60 mm dishes. After 24 h of culturing, cells were trypsinized and 5 × 10⁵ cells were fixed by adding 70% ethanol for 10 h at −20°C. Cells were then washed twice with PBS, treated with RNAse A (100 µg/mL, Sigma-Aldrich), and incubated at 37°C for 4 h. Thereafter, cells were washed twice with PBS, re-suspended in 300 µL of propidium iodide (20 µg/mL; Sigma-Aldrich), and analyzed in BD FACSCanto.
Caspase 3 assay
For apoptosis analysis, MDA-MB-231-expressing control shRNA or shTRIM28 cells (2 × 10⁵) were seeded into 35 mm dishes for 12 h followed by treatment with 5-FU for 20 h. After treatment, cells were trypsinized and 2 × 10⁵ cells were fixed by adding 4% formalin for 10 min at room temperature. Cells were then washed twice with PBS and permeabilized with methanol (100%) in ice for 30 min. Thereafter, cells were washed twice with PBS followed by blocking with 1% bovine serum albumin (BSA) for 15 min. Caspase-3-PE antibody (1:100 dilutions) was added to the cells and incubated for 1 h at room temperature. The cells were finally washed with PBS, re-suspended in 300 µL of PBS, and analyzed in BD FACSCanto.
In vivo tumor formation assay
Animal experiments were performed with approval from Institutional Animal Ethics Committee, Indian Institute of Science (IISc). Female athymic nude mice aged 4–5 weeks were used for in vivo animal experiments. The animals were housed under specific pathogen-free conditions. Non-targeting shRNA (control shRNA) cells were injected subcutaneously into the left flank and shTRIM28 cells were injected into the right flank of each mouse. When the tumors attained a volume of 100 mm3, the mice were randomized into two groups: One group was treated (tail vein) with vehicle control and another group with DOX (4 mg/kg body weight) for every 7 days until 6 weeks. Tumor size was measured regularly with digital Vernier calipers. The animals were sacrificed and tumors were isolated for size analysis, tumor inhibition rate analysis, and CD44high/CD24low analysis. Tumor inhibition rate was calculated by the tumor inhibition rate (IR) formula: IR (%) = ((Wc − Wt) / Wc) × 100, where Wc and Wt represent the mean tumor weight of the control group and the treatment group, respectively.
In vivo metastasis assay
Non-targeting shRNA (control shRNA) cells were injected orthotopically into the fifth mammary gland of mice on each side for five mice, and shTRIM28 cells were injected orthotopically in another six mice. Tumor growth was monitored till 90 days; after 90 days, mice were sacrificed. Primary tumors and lungs were collected at the end point of study and analyzed as described.19,20
Histopathology
Lung tissues from mice (both control shRNA or shTRIM28) were dissected, fixed in 10% buffered formalin (Sigma-Aldrich), and embedded in paraffin. Sections (4–6 µm thick) were stained with hematoxylin and eosin (H&E). Stained sections were observed under an Olympus microscope (10× magnifications; Shinjuku, Tokyo, Japan), and images were acquired.
Statistical analysis
Statistical analysis was performed using Student’s t-test, analysis of variance (ANOVA), and two-way ANOVA. Curve-fit method was used to analyze IC50 value. GraphPad Prism software version 5 was used for all statistical tests and plotting the graphs. Results were shown as mean ± standard error of the mean (SEM).
Results
Identification of gene signatures in the primary tumors that develop distant metastasis
We performed microarray analysis on 80 Indian breast cancer patients comprising of 27 ER-positive and 53 ER-negative samples who presented themselves at the KMIO, Bangalore, India, during the period 2006–2010. Records of 62 patients were obtained containing all the treatment and follow-up information; 37 of these patients showed LN invasion of the tumor at presentation, while the rest were local tumors. These patients completed at least 5 years of follow-up since presentation. In addition, 14 patients recurred with the disease within the period, while nine patients developed distant metastasis to the bones, brain, and liver. There was no significant correlation (p > 0.05) between LN invasion at the time of presentation and subsequent progression to metastasis or relapse (Table 1).
Expression of TRIM28 network genes in metastatic versus non-metastatic breast cancers.

TRIM28: tripartite motif-containing protein 28; qRT-PCR: quantitative real-time polymerase chain reaction; LN: lymph node; LP: lymph node positive; VM: visceral metastasis; LP free: lymph node positive free of metastasis; mRNA: messenger RNA.
Differential expression of TRIM28 network genes in distant metastatic tumors and LN-positive tumors, compared to LN-negative tumors which remain disease free.
* = p < 0.05, level of significance.
Differential gene expression analysis was performed to identify putative up- and down-regulated genes in the primary tumors of nine patients who developed distant metastasis and compared it to a similar size group of eight disease-free patients. A total of 241 genes showed differential expression, in which 52 genes were up-regulated and 189 genes showed lower expression (>1.5-fold; p < 0.05) in the distant metastasis samples, compared with the disease-free counterparts. In addition, these 241 genes also showed 1.5-fold differential expression with respect to normal breast samples (p < 0.05). We identified several known oncogenes, tumor suppressors, metastasis suppressors, EMT markers, and invasion-related known candidate genes in the list (Table 2).
Known oncogenes, tumor suppressors, and invasion markers in distant metastasis data.
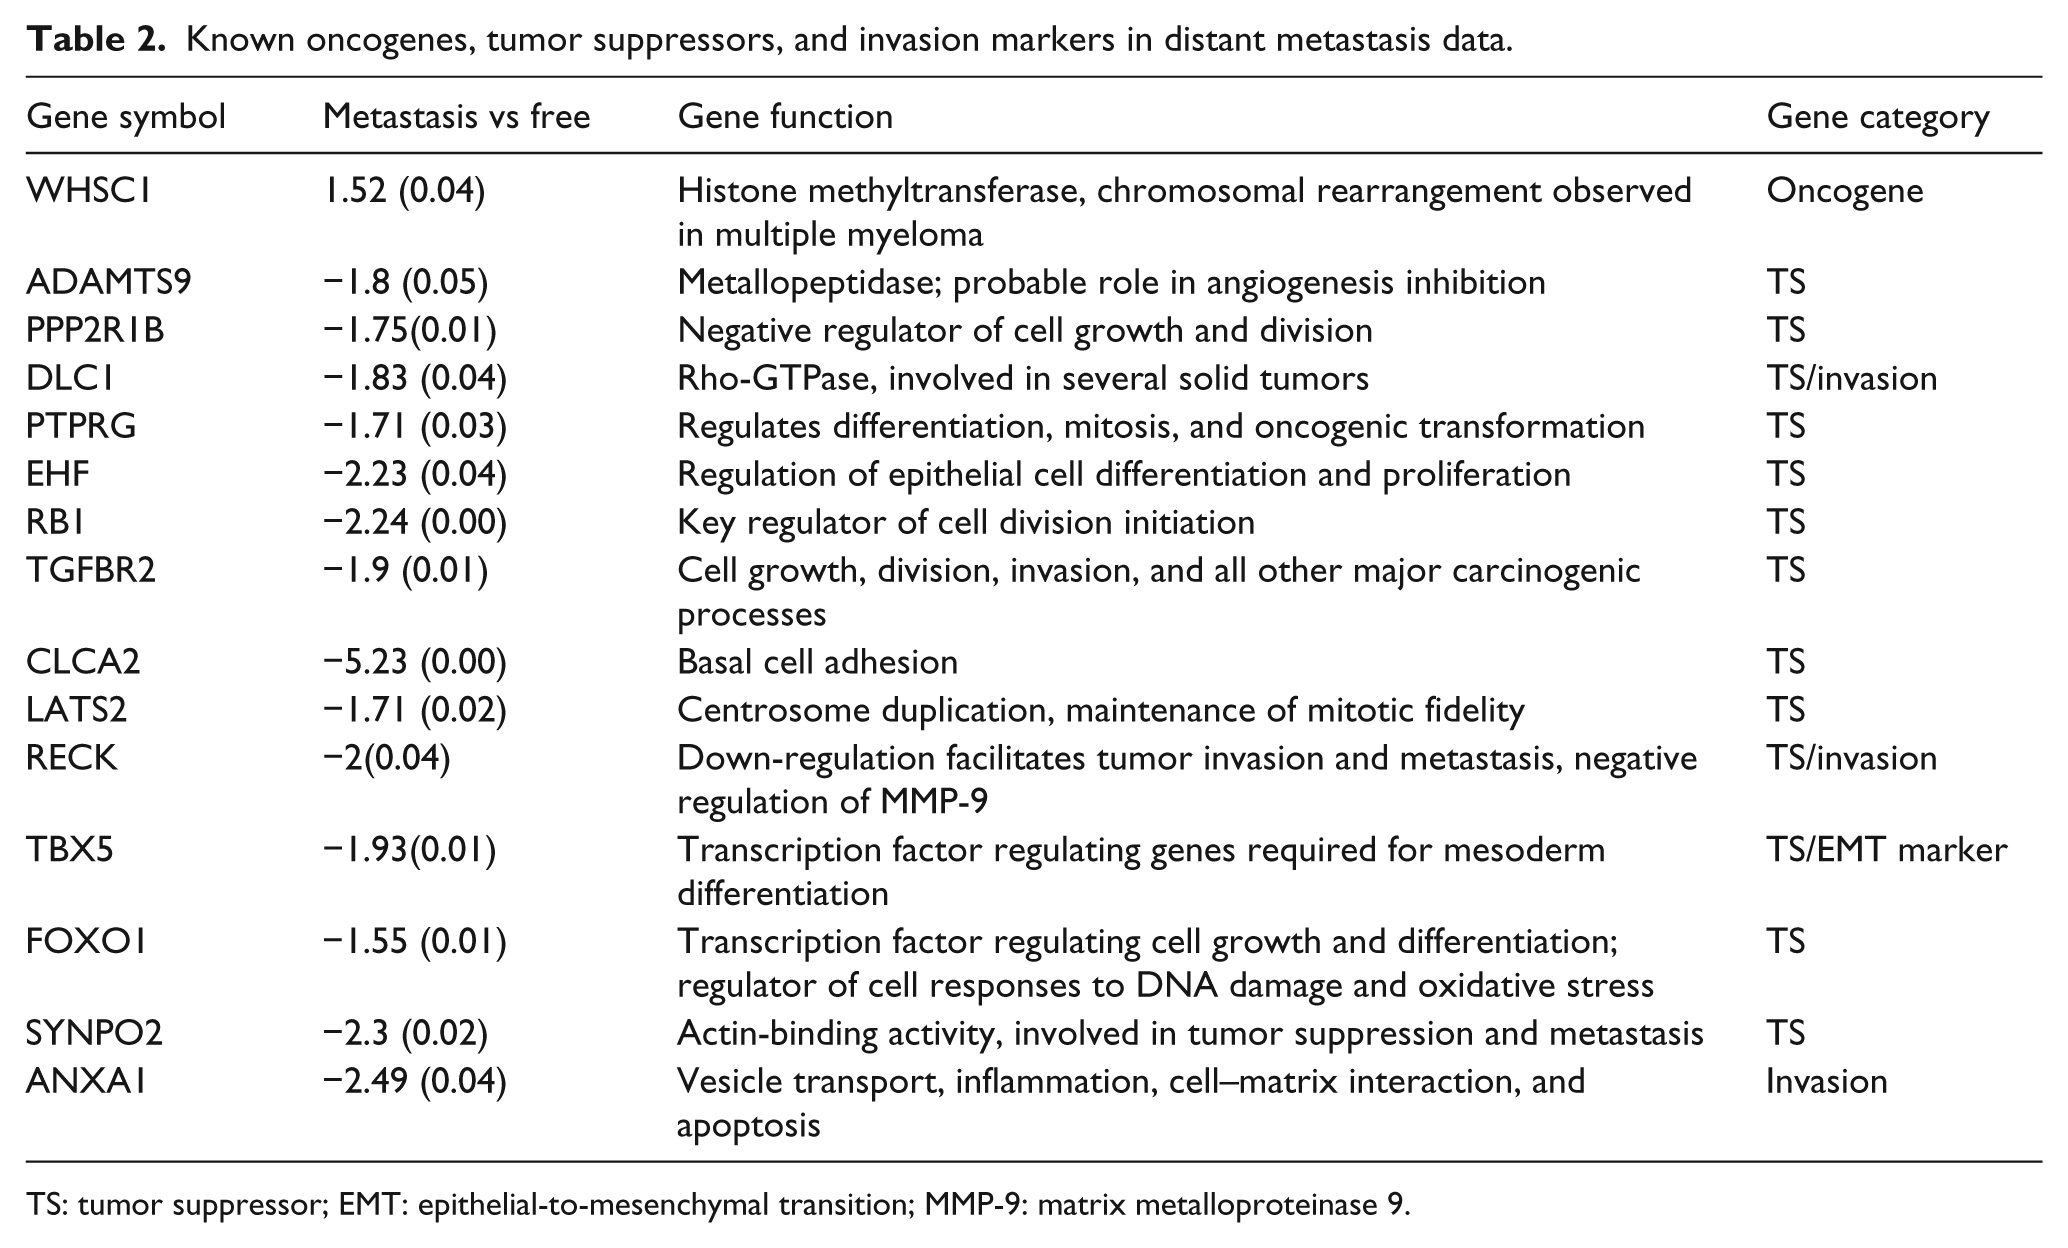
TS: tumor suppressor; EMT: epithelial-to-mesenchymal transition; MMP-9: matrix metalloproteinase 9.
The above 241 genes while differentially expressed in samples with metastasis outcome in our cohort do not stand statistical significance with respect to p value, post FDR correction. Hence, to ensure robustness of the downstream biological inferences on distant metastasis, we focused our study on genes that are among the top differentially expressed gene list in metastatic tumors in other available datasets as well. We found GSE18229 21 an appropriate dataset that profiles primary tumors of 199 Caucasian breast cancer patients and also reports their clinical outcomes. Of these patients, 10 reported relapse and six showed distant metastasis. We compared the platforms and found 66% of the common probes up- or down-regulated in both platforms. Details of platform comparison are described in the “Materials and methods” section. Out of the 241 genes that showed differential expression in the Indian cohort between metastatic and disease-free primary tumors, a total of 116 genes (46 up-regulated and 70 down-regulated) were identified as differentially expressed in both the cohorts (Table S3A). None of them were in common with the gene signatures published as MammaPrint and Oncotype Dx. These genes were further analyzed for their role in various known pathways and used to build the protein–protein interactions map depicting the molecular basis of distant metastasis. Using these 116 genes, we clustered both the samples and the genes from our Indian patient cohort using hierarchical clustering. We observed two and three clusters for samples and genes, respectively (Figure 1(a)). Interestingly, one of the two sample clusters comprises of metastatic samples alone, while that of the other cluster is predominantly of the disease-free samples, with three metastatic samples showing misclustering with the disease-free group. The GSE18229 samples showed accurate clustering results for all but one sample, using these 116 common genes. Interestingly, Cluster 3, a subset of the 116 genes, obtained from clustering genes on the Indian dataset gave greater than 90% accuracy in clustering the metastatic samples separate from the disease-free samples in both the Indian and the GSE18229 data (Figure 1(b)). A gene ontology (GO) classification of the genes in this subset reveals predominance of DNA replication, DNA damage checkpoint, regulation of cell cycle, and amino acid and vitamin metabolic processes (Table S3B).

Clustering of network genes and tumor samples. (a) Clustering was performed for 116 differentially regulated genes common to the Indian and the GSE18229 samples. Both genes and samples were clustered as indicated and heat map provided for the clustering of the genes in the Indian data only. Sample clusters are shown for both cohorts, with the metastatic samples in blue and disease-free samples in red. Gene clusters are labeled. (b) Entities in Cluster 3 obtained from gene clustering on the Indian samples were used to re-cluster samples in both datasets. The heat map is shown for the results obtained from the Indian patients. Genes in Cluster 3 that overlap with the mitotic spindle proteome genes are highlighted in the figure.
Genes in the TRIM28 protein–protein network are enriched in primary tumors of distant metastasis
To understand the interconnectivity of genes differentially expressed in the distant metastasis samples, we constructed an interactome network of these genes. The physical interaction data were available from the IntAct database (mentioned in the “Materials and methods” section). To connect the genes into a network, one may need to include common neighbors (regulators or target proteins) whose expression changes may be beyond the sensitivity of a microarray experiment, but which may play a connecting role for the differentially expressed genes. To include such probable candidate genes, we performed a one-step expansion of the differentially regulated genes and found common genes that connect two or more genes from the original list. This step enables us to include additional genes that are “first-degree neighbors.” These additional genes encode proteins that form a physical interactions network to connect several differentially expressed genes (Figure 2(a)). Interestingly, the single largest connected network is centered on TRIM28. Despite conflicting reports, a recent publication reported an increased expression of this gene correlating with poor clinical outcome and metastasis in non–small cell lung carcinoma. 22 The network reveals a differential expression of several other genes like SHMT2, VARS, SAFB, and SEC23A that are functionally associated with TRIM28. While a GO analysis (Table S3B) did not produce any overwhelming overlap with pre-defined biological processes, we found that several genes in the network encode proteins that were detected in the mitotic spindle proteome.23,24 Nine candidates of the 30 proteins in the TRIM network (six differentially expressed genes and three first-degree neighbors) overlap with the mitotic spindle proteome (data not shown). Interestingly, a majority of the differentially regulated genes from this TRIM28 network are observed in the subset of genes (Cluster 3) that clustered the metastatic primary tumors separately from the disease-free group in both Indian and GSE18229 data, with 90% accuracy (Figure 1(b)). Indeed, GO analysis of the genes in Cluster 3 revealed DNA damage checkpoint, replication, and cell cycle regulation terms as over-represented in the Cluster 3 list (Table S3C). Since the disease-free group of individuals far outnumbers the group that proceeded to metastasis, we randomly generated 10 groups of disease-free individuals from our pool of patients in this category, and performed the same analysis and reached the same conclusions (Figure S1 and Table S4).
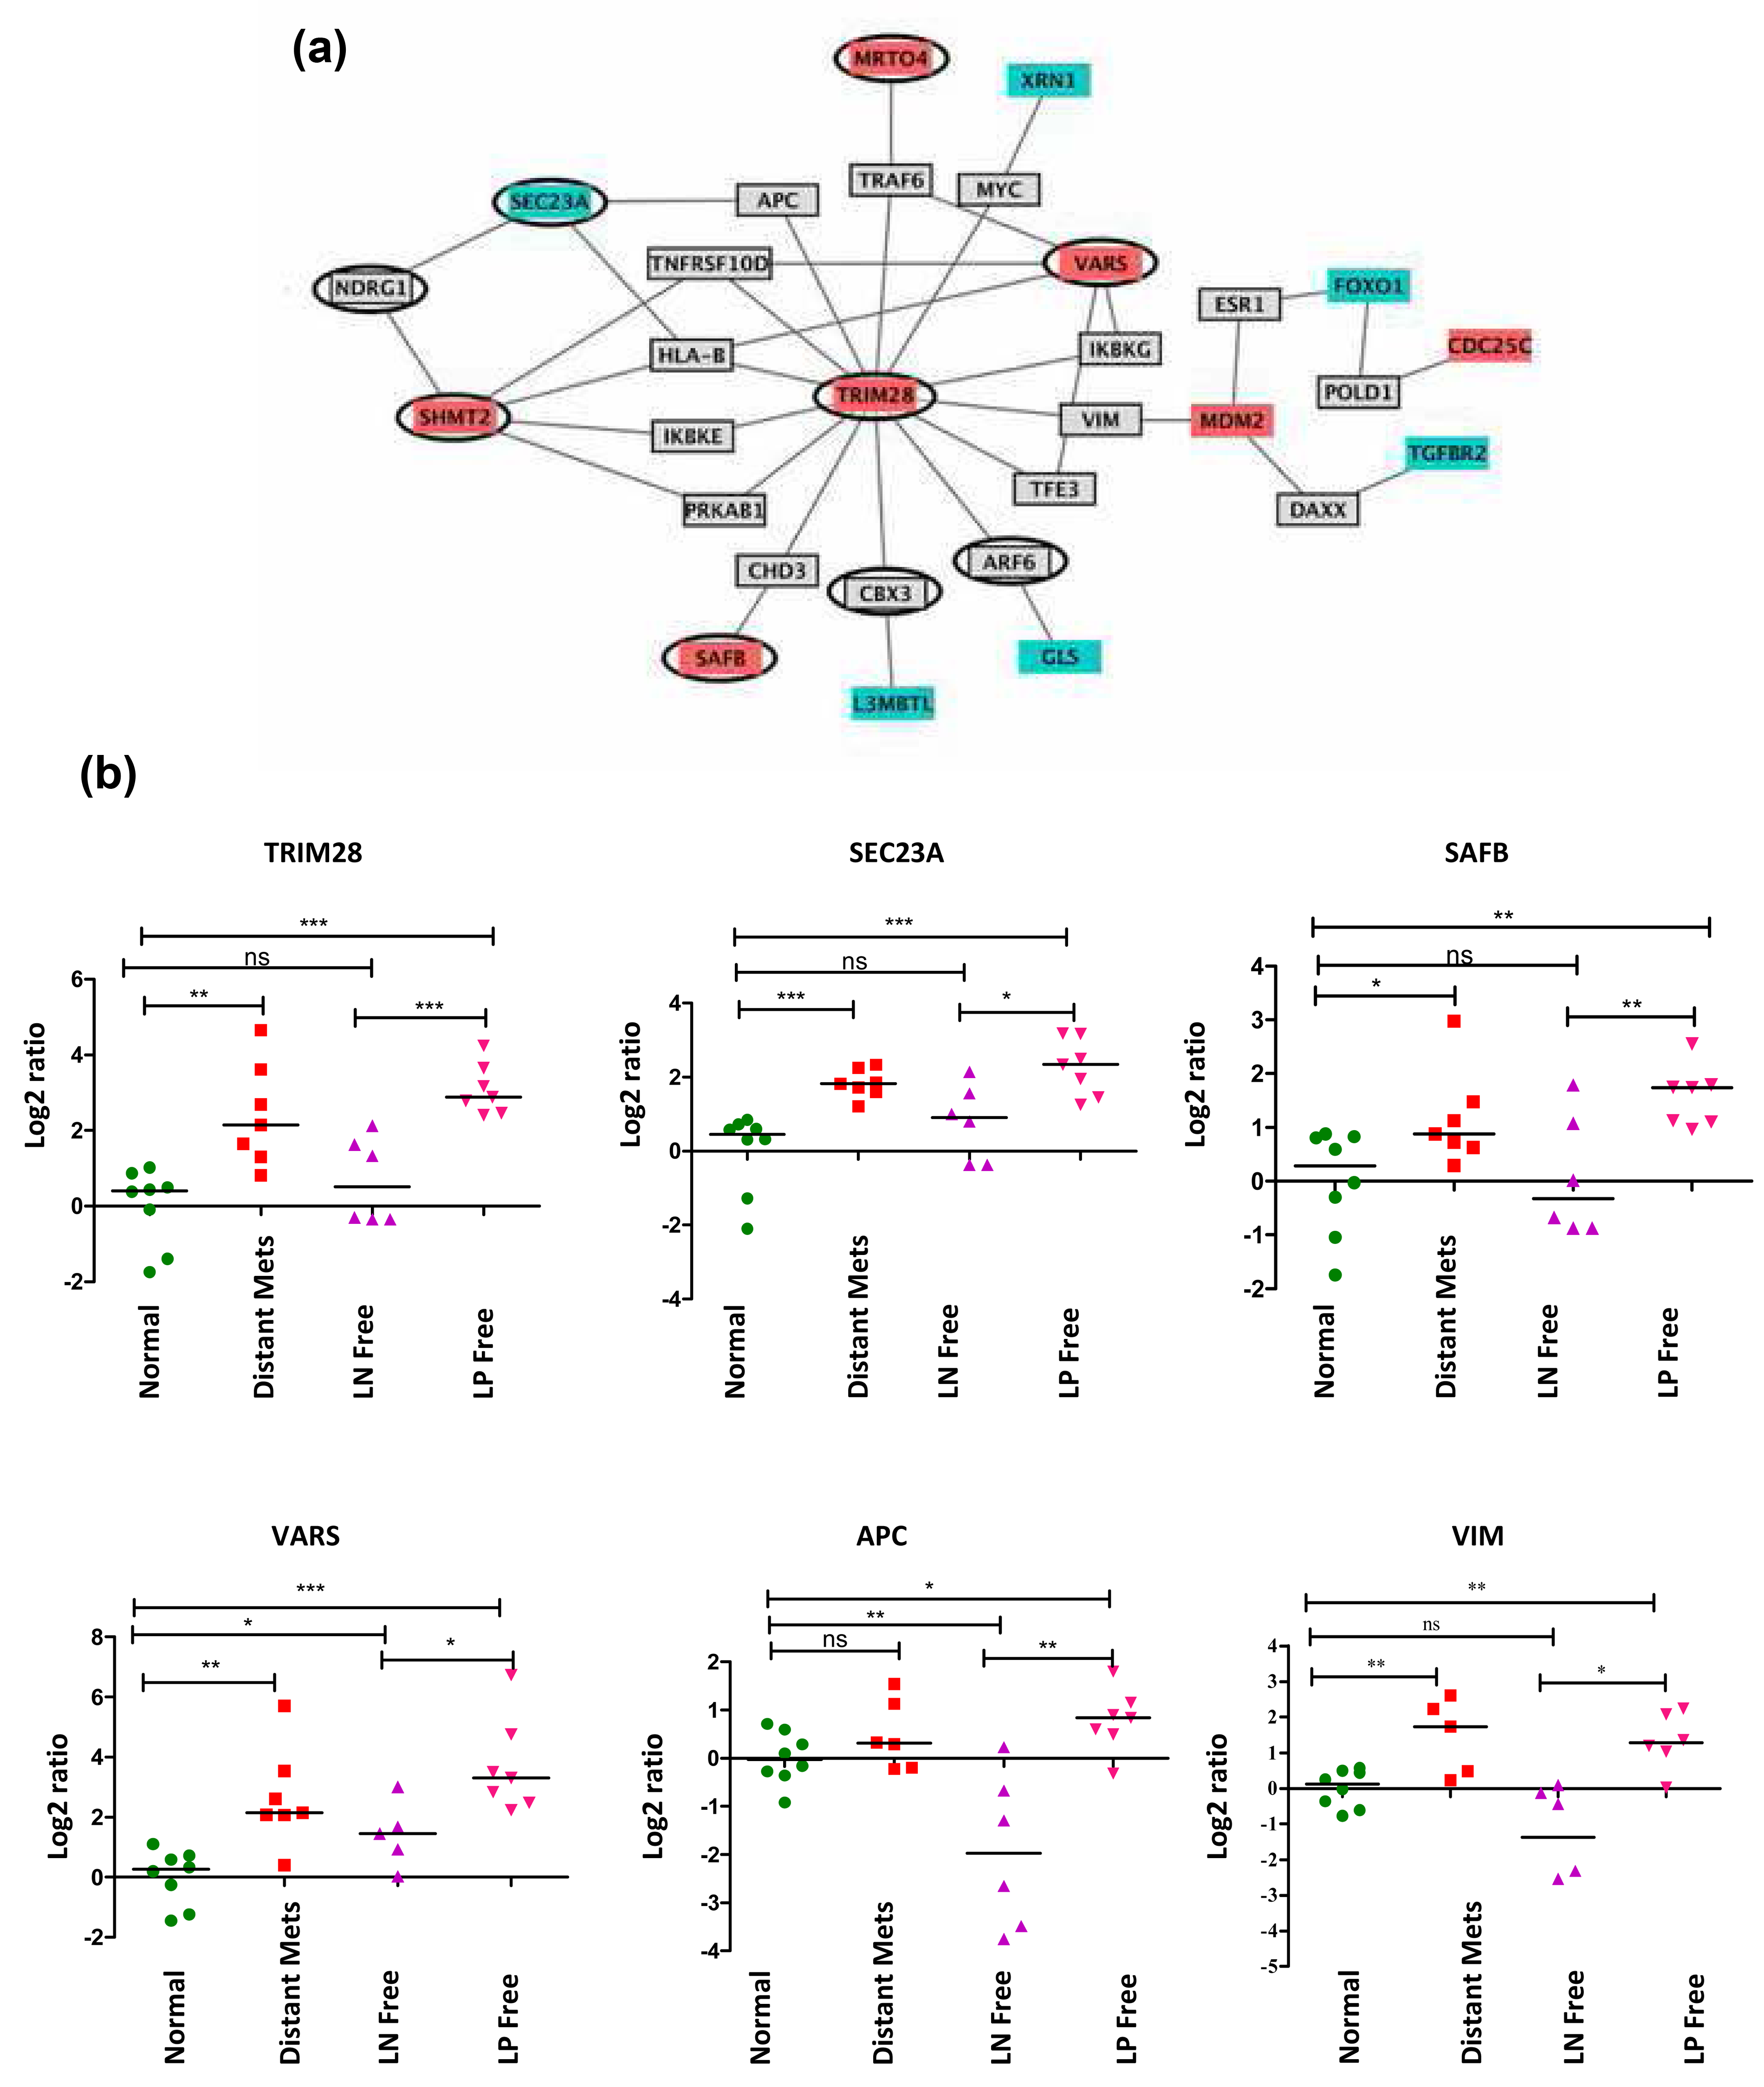
TRIM28 network. (a) A network of genes centered on TRIM28 are shown. Genes up-regulated (red) and down-regulated (blue) in metastatic tumors compared to disease-free tumors, in the microarray data, are shown. The genes that are the first-degree neighbors bridging the differentially expressed genes are depicted in gray. The edges depict physical interactions between the proteins as reported in the IntAct database. TRIM28 is the hub of the network. Proteins overlapping with the mitotic spindle formation proteome are circled in black border. (b) Real-time PCR validation of genes from the TRIM28 network is shown. TRIM28, SAFB, SEC23A, and VARS from the primary microarray data, and APC1 and vimentin (VIM; first-degree neighbors), were validated using quantitative PCR to represent differential expression of the TRIM28 network genes. Differential expression was compared between normal and primary tumors of patients who developed visceral metastasis, who are lymph node negative and disease free, and lymph node positive for invasion but are disease free. The Y-axis plots (log2) fold change in expression. The p value (t-test) for significant differential expression between metastatic primary tumors and LN-negative free tumors is reported for each gene. Error bar represents the standard error of the mean (SEM); *p < 0.05; **p < 0.01; ***p < 0.001; ns: not significant (n = 7).
Furthermore, the expressions of TRIM28 (p < 0.03), SHMT2 (p < 0.02), SAFB (p < 0.07), and SEC23A (p < 0.01) from the network were confirmed using real-time PCR experiments (Figure 2(b) and Table 1). We also validated the differential expression of additional “first-degree neighbor” genes from the TRIM28 network that did not show any change of expression in the microarrays. APC1 (p < 0.04) and vimentin (p < 0.1) over-expressions were confirmed by the more sensitive real-time PCR experiments. We also observed that the TRIM28 network is differentially expressed in those samples that were LN positive at presentation compared to those which are LN negative and remain free of invasion in the follow-up (Figure 2(b)). Both microarray data and real-time PCR confirmation validated these data (Table 1). These findings lead to the conclusion that the TRIM28-regulated network of genes are indeed involved in metastasis and invasion, irrespective of hormone receptor or nodal status, in breast cancer. Genes involved in mitotic spindle formation, regulating cell cycle, apoptosis, and DNA damage and replication are enriched in the primary tumors of patients who reported metastasis, compared to those who remained disease free, suggesting differential regulation of these processes in the metastatic tumors.
Several studies in the recent years have thrown light on the involvement of tripartite motif (TRIM) proteins (one of the subfamilies of the RING-type E3 ubiquitin ligase) as regulators of tumorigenesis, and often involved in various translocations in leukemia. 25 Of these, the over-expression of TRIM28 has recently been correlated with recurrence and metastasis in non–small cell lung carcinoma. 22 However, there is at least one study that reports contradictory results as well. 26 In breast cancer, the differential expression of the TRIM28 protein and its correlation with invasion were initially reported by Ho et al. 27 Our results confirm the observation at the RNA level as well and also report the association of expression changes in a group of proteins connected to TRIM28, in addition to TRIM28, that correlates to metastasis. A majority of the network candidate genes are shown to have molecular interactions with TRIM28, which forms the hub, and hence, we call it the TRIM28 network. Importantly, the differentially expressed genes in our study that belong to this network distinguished the metastatic tumors from the recurrence-free group, in hierarchical cluster analysis with more than 90% accuracy. It is important to note that the genes in the TRIM28 network showed a similar expression pattern in LN-positive tumors that have not progressed to distant metastasis. This raises an issue that expression of the genes in TRIM28 network drives the tumor cell invasion and metastasis to either LN or distant organs. The differential expression of TRIM28 network genes will predict metastasis of node-negative tumors irrespective of hormone receptor status. This suggests that TRIM28 network gene analysis is an important parameter to the accurate prediction of metastasis.
Interestingly, the sub-network of genes overlap significantly with the proteins expressed in mitotic spindle formation.23,24 While the exact significance of this observation needs to be probed further, one may suggest that disruption of mitotic spindle formation causes aberrant chromosome segregation in cancer cells and interferes with regulated cell division. 28 TRIM28 is known to regulate p53 tumor suppressor. 29 Interestingly, another E3 ubiquitin ligase, MDM2 that represses p53, is found over-expressed in the metastatic tumors, and also forms a part of this network, implying de-regulation of p53 tumor suppressor in the invasive tumors. The repression of p53 protein is known to confer resistance to chemotherapy, and hence, those patients with activated TRIM28 network probably do not respond to chemotherapy, resulting in metastasis. Another interesting candidate of this network, SAFB1, is shown to repress immune response and apoptotic regulation in breast cancer cells. 30 Among other validated candidate genes of the TRIM28 network, serine hydroxyl methyltransferase 2 protein (SHMT2) over-expression has been correlated with prostate cancer progression and found significantly increased in metastatic prostate cancer cell lines in the Oncomine cancer microarray database. 31 Although the role of VARS (valyl-tRNA synthetase) remains to be explained, a recent publication highlights a new role for another member, the threonyl-tRNA synthetase in endothelial cell migration and angiogenesis, in cancer progression. 32 Among genes that do not display differential expression in the primary data, but are probably candidates of the TRIM28 network, we confirmed the expression of two such first-degree neighbors. Adenomatous polyposis coli protein APC1 is a key regulator of the beta-catenin degradation, in the oncogenic Wnt signaling pathway and appears, while vimentin is widely used as an EMT marker, a process that occurs early in metastasis. 33 Taken together, TRIM28 network seems to be significantly associated with metastatic spread of breast tumors irrespective of their ER or nodal status.
Knockdown of TRIM28 effects on functional EMT
Since our previous results showed that TRIM28 levels were more in metastasis patients, we further investigated in the prospective of EMT and invasion using breast cancer cell lines. To move in this direction, first we generated stably expressing TRIM28 knockdown cells in MD-MB-231 (Figure 3(a)) and BT-474 (Figure 3(b)). We observed that vimentin, N-cad, Slug, and fibronectin levels (mesenchymal markers) were reduced upon TRIM28 knockdown (Figure 3(c)) in MDA-MB-231 cells; we also observed that fibronectin and slug levels were reduced while we observed that E-cad (epithelial marker) levels were increased in TRIM28 knockdown cells compared to control shRNA cells in BT-474 cell lines (Figure 3(d)). As reported earlier, 34 we also did not observe the basal protein expression of E-cad in MDA-MB-231 and of vimentin, N-cad, and CD44 in BT-474 cells. A recent study also showed similar results in lung cancer cell lines. 14 MDA-MB-231 cell line was negative for E-cad, and BT-474 cell line was negative for vimentin and N-cad. 34 Attainment of migration and invasive capabilities is a hallmark feature of a functional EMT. 35 To assess whether TRIM28 can modulate the motility and migration of cancer cells, we undertook a scratch assay with MDA-MB-231 stably expressing shTRIM28 cells. Compared to control shRNA cells, shTRIM28 cells showed a significant decrease in migration in both serum-free condition (Figure 3(e) and Figure S2A) and complete media (Figure 3(f) and Figure S2B). Next, we investigated the effects of TRIM28 knockdown on the invasive potential of breast cancer cells by Boyden chamber invasion assay. Invasion assay results revealed that knockdown of TRIM28 significantly reduced the percentage of invaded cells compared to control shRNA cells (Figure 3(g) and Figure S2C). Our results first time demonstrated the effect of TRIM28 knockdown on EMT marker expression, migration, and invasion in breast cancer cells.

Knockdown of TRIM28 down-regulates EMT. shTRIM28 expression down-regulates TRIM protein. (a) MDA-MB-231 or (b) BT-474 cells stably expressing control or shTRIM28 were harvested and subjected to qRT-PCR analysis for TRIM28. (c) and (d): Regulations of indicated TRIM28 and EMT markers upon TRIM28 knockdown. (c) MDA-MB-231 or (d) BT-474 cells stably expressing control shRNA or shTRIM28 were harvested and subjected to western blot analysis using antibodies. (e)–(g): Reduced migration and invasion upon TRIM28 knockdown. MDA-MB-231 cells stably expressing control shRNA or shTRIM28 were subjected to scratch assay in (e) serum free-media and (f) complete media. Wound width was measured at 0 and 48 h after wound has been made. Errors bar represents the standard error of the mean (SEM); *p < 0.05 (n = 3). (g) MDA-MB-231 cells stably expressing control shRNA or shTRIM28 were subjected to Matrigel invasion assay. Number of invaded cells was measured after 20 h of incubation in Matrigel inserts. Error bar represents the SEM; **p < 0.01 (n = 3).
Knockdown of TRIM28 reduces the stem-like cell population and increases the chemosensitivity to anti-cancer agents
It is well established that cells with high EMT phenotype show increased stem-like cell population in several cancer cells including breast cancer. 16 Since our results showed that knockdown of TRIM28 reduces the EMT expression and activity, we investigated the effect of TRIM28 on stemness expression in breast cancer cells. Toward this, we performed western blot analysis to check the expression of stemness genes (CD44 and Bmi1). Our western blot results demonstrated that CD44 and Bmi1 levels were reduced in MDA-MB-231 stably expressing shTRIM28 cells compared to control shRNA cells (Figure 4(a)). Similarly, we also observed that knockdown of TRIM28 reduces the Bmi1 levels (BT-474 cells are negative for CD44) in BT-474 cells (Figure 4(a)). Since we observed that CD44 levels were reduced upon TRIM28 knockdown, further we went ahead to check the CD44high/CD24low population to assess stem-like cell population in TRIM28 knockdown cells. Interestingly, we observed that TRIM28 knockdown significantly reduces the stem-like cell population compared to control shRNA cells (Figure 4(b)). To further confirm the role of TRIM28 in breast cancer stemness, we performed mammospheres formation assay, which is considered to be a surrogate for tumorigenic assay in vitro. MDA-MB-231 stably expressing shTRIM28 cells significantly reduced sphere formation (p < 0.01) compared to control shRNA cells (Figure 4(c) and (d)). Similar results were obtained with BT-474 stably expressing shTRIM28 cells (Figure 4(d)). It has been known that stem-like cells show more drug resistance and decreases the chemosensitivity in several cancer types. 36 Since TRIM28 knockdown showed reduction of stemness marker expression and stem-like cell population, we assessed the chemosensitivity of TRIM28 knockdown cells (MDA-MB-231 and BT-474 cells). In the MTT assay, interestingly, shTRIM28 cells were more sensitive to DOX (Figure 4(e) and Figure S3A), 5-FU (Figure 4(f) and Figure S3B), and MTX compared to control cells (Tables 3 and 4). Next, we investigated the effect of shTRIM28 on apoptosis using Caspase 3 assay. Our results revealed that knockdown of TRIM28 significantly increased the apoptosis of breast cancer cells upon 5-FU treatment (Figure 4(g)); we observed around 1% of basal apoptosis in control shRNA (0.9 ± 0.15) and TRIM28 knockdown (1.07 ± 0.3) cells (Figure 4(g)). Taken together, our results showed that knockdown of TRIM28 reduces the stem-like cell population and increases the chemosensitivity and apoptosis in breast cancer cells.
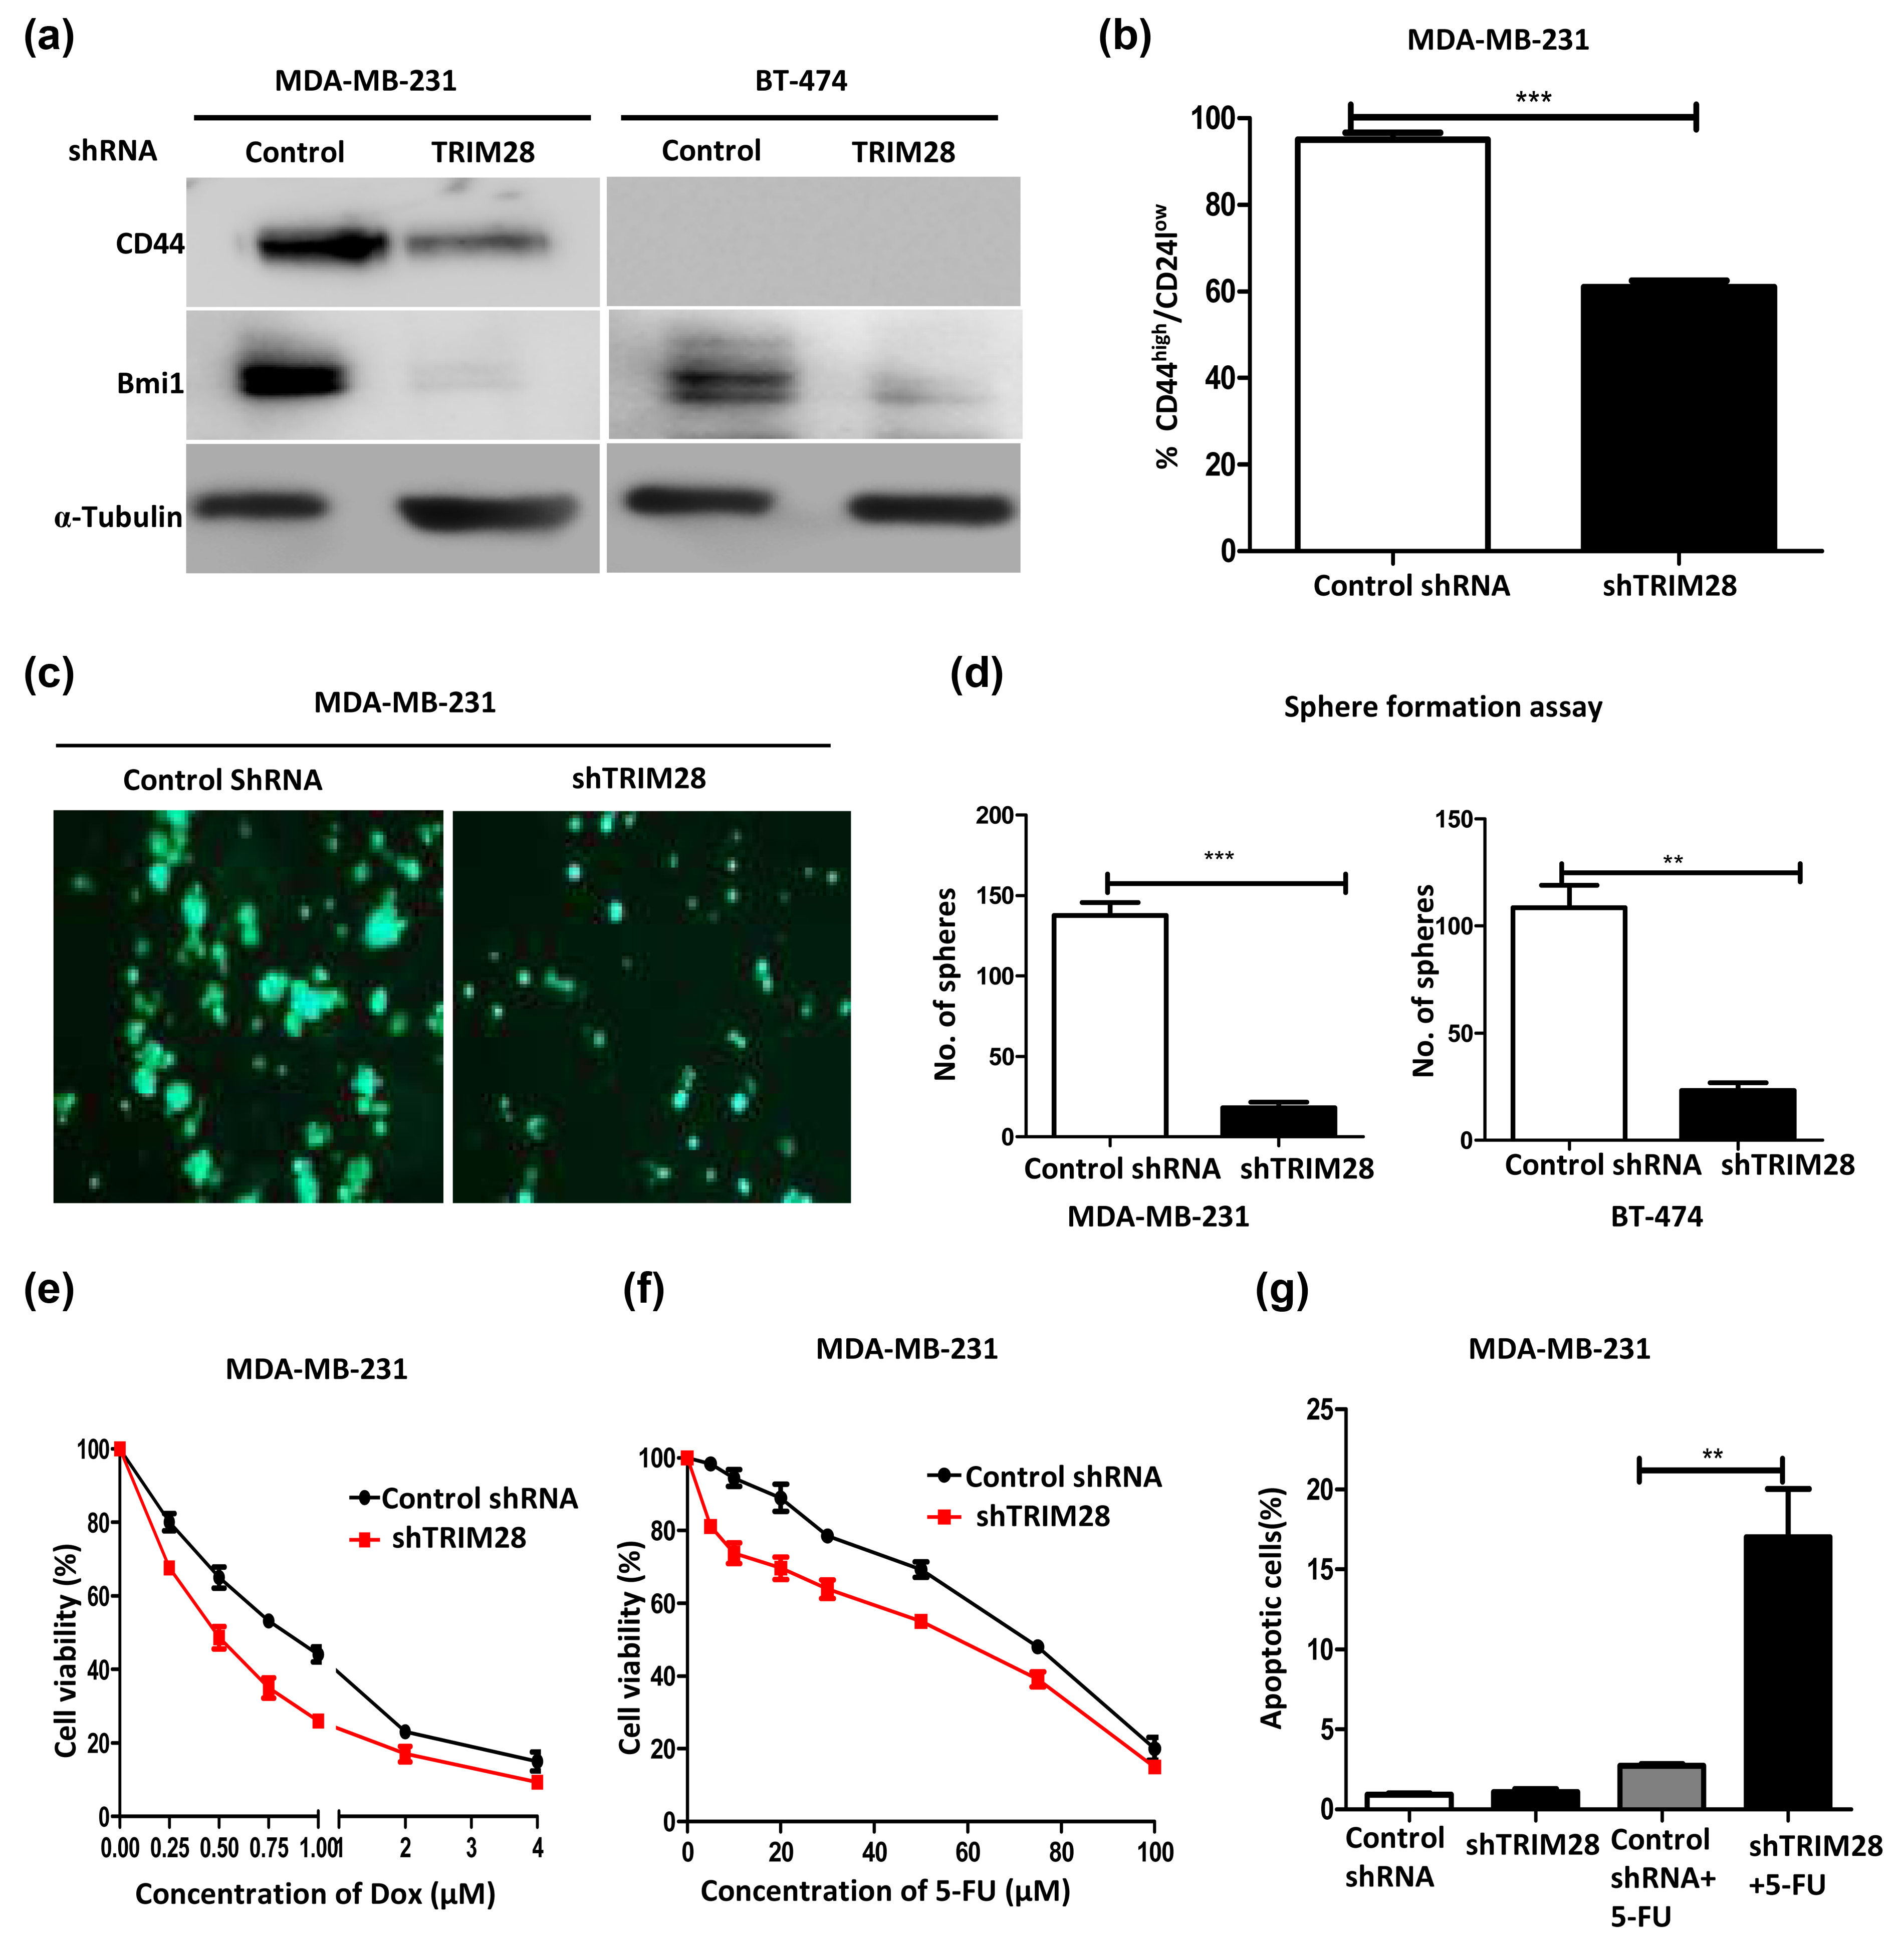
Regulation of stemness and chemoresistance by TRIM28. (a) Reduction of stemness markers upon TRIM28 knockdown. MDA-MB-231 and BT-474 cells stably expressing control shRNA or shTRIM28 were harvested and subjected to western blot analysis for stemness markers CD44 and BMI antibodies. (b) TRIM28 knockdown alters the proportion of CD44high/CD24lowcells. MDA-MB-231 cells stably expressing control shRNA or shTRIM28 were subjected to CD44high/CD24low analysis using CD44-PE-cy7 and CD24-PE antibodies. Error bar represents the standard error of the mean (SEM); **p < 0.01 (n = 3). (c) and (d): TRIM28 knockdown reduces the cancer sphere formation. Fluorescent images show the sphere formation ability of MDA-MB-231 cells stably expressing control shRNA or shTRIM28 after 10 days of methyl cellulose assay. (d) Bar graph represents the quantification of spheres in stably expressing control shRNA or shTRIM28 breast cancer cells. Error bar represents the SEM; **p < 0.01 (n = 3). (e) and (f): Knockdown of TRIM28 increases the chemosensitivity. MDA-MB-231 cells stably expressing control shRNA or shTRIM28 were seeded into 96-well plates and treated with different concentrations of (e) doxorubicin and (f) 5-fluorouracil for 48 h. After 48 h of treatment, cells were subjected to MTT assay. Absorbance was measured at 575 nm. Error bar represents the SEM (n = 3). (g) TRIM28 knockdown results in increased apoptosis of breast cancer cells treated with 5-FU. MDA-MB-231 cells stably expressing control shRNA or shTRIM28 were treated with 5-fluorouracil for 20 h; after the treatment, cells were subjected to caspase 3 assay. Error bar represents the SEM; *p < 0.05 (n = 3).
Effect of anti-cancer drugs on TRIM28 knockdown MDA-MB-231 cells.

IC50 values of chemotherapeutic drugs in stably expressing MDA-MB-231 shTRIM28 cells compared to control shRNA cells (n = 3).
Effect of anti-cancer drugs on TRIM28 knockdown BT-474 cells.

IC50 values of chemotherapeutic drugs in stably expressing BT-474 shTRIM28 cells compared to control shRNA cells (n = 3).
Knockdown of TRIM28 reduces the proliferation of cancer cells
To further investigate functional link between proliferation of cancer cells and TRIM28, we performed proliferation assay and analyzed the doubling time for control shRNA cells and TRIM28 knockdown cells. As reported in Addison et al., 11 we also observed that knockdown of TRIM28 significantly decreased the proliferation of cancer cells (Figure S3C). We have also observed that doubling time was increased in shTRIM28 stable cells (36.02 ± 3.11) compared to control shRNA cells (29.16 ± 2.2).
Furthermore, we have also performed the cell cycle analysis using TRIM28 knockdown cells (MDA-MB-231 and BT-474) to see whether knockdown of TRIM28 affected the cell cycle profile. Cell cycle analysis revealed that there was no significant difference in any of the cell cycle phases (G1, S, and G2/M) between control shRNA cells and TRIM28 knockdown cells (Figure S3D and S3E).
Knockdown of TRIM28 reduces the in vivo tumor formation and metastasis and increases the sensitivity of DOX in vivo
To further corroborate the above results with stemness and drug resistance in vivo, we performed xenograft tumor formation assay using immunocompromised mice. Consistent with the reduction of stem-like cells (Figure 4(b)) and mammosphere formation (Figure 4(d)), we observed a significant growth reduction in tumors upon TRIM28 knockdown compared to control shRNA cells (Figure 5(a)). In addition, DOX treatment resulted in a further reduction in the growth of TRIM28 knockdown tumors compared to DOX-treated control shRNA cells–derived tumors (Figure 5(a)–(c)). While DOX treatment resulted in the reduction of 50.4% growth of control shRNA cells, it was around 77% in shTRIM28 cells (Figure 5(c) and Table 5). This suggests a chemoresistance function of TRIM28. Furthermore, there was a significant reduction (~50%) of stem-like cells in tumors generated from TRIM28 knockdown cells compared to tumors generated from control shRNA cells (Figure 5(d) and (e) and Figure S4F).

TRIM28 knockdown results in reduced tumor growth kinetics of breast cancer cells and increased sensitivity to doxorubicin. (a)–(c): The line graph shows kinetics of growth of xenograft tumors in nude mice. MDA-MB-231 cells stably expressing control shRNA or shTRIM28 were injected subcutaneously (2 × 10⁶ cells/injection) into 5-week-old athymic nude mice, and doxorubicin treatment was given for 6 weeks from the initial tumor formation. Tumor growth was monitored for the indicated periods. At the end of treatment, tumors were isolated and tumor weights were determined. (b) Representative images of the resected tumors. (c) Scatter plots of the weights of tumors from different groups. Error bar represent the standard error of the mean (SEM); **p < 0.01; ***p < 0.001 (n = 6). (d) and (e): Effect of TRIM28 knockdown on the proportion of CD44high/CD24lowcells. Tumor-derived MDA-MB-231 cells stably expressing control shRNA or shTRIM28 were isolated and subjected to CD44high/CD24low analysis using CD44-PE-cy7 and CD24-PE antibodies. Error bar represents the SEM (n = 3).
Effect of TRIM28 knockdown in in vivo tumorigenicity assay.
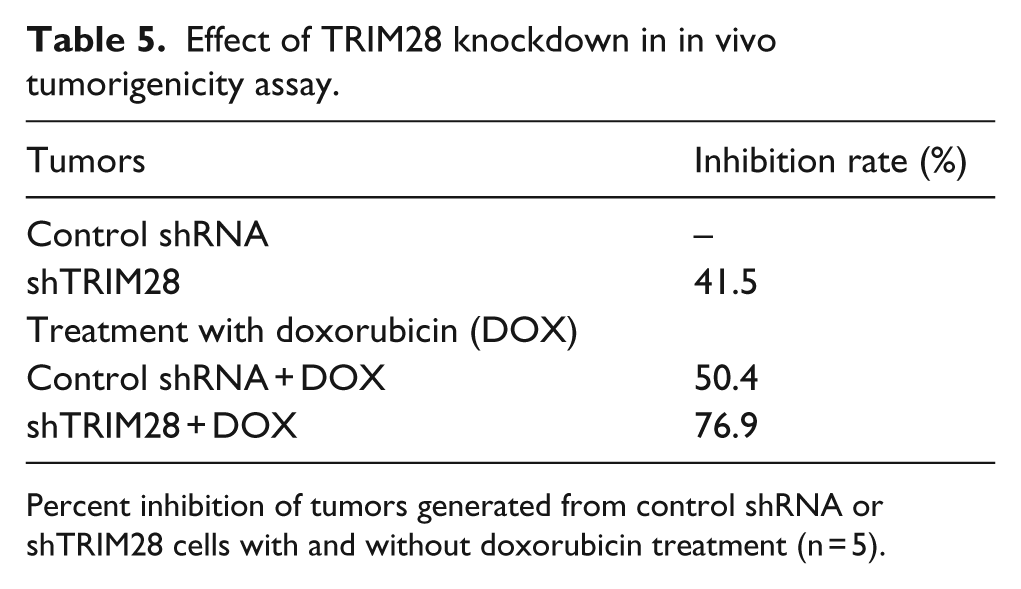
Percent inhibition of tumors generated from control shRNA or shTRIM28 cells with and without doxorubicin treatment (n = 5).
We have also performed the metastasis analysis to evaluate the effect of TRIM28 knockdown on metastatic nodule formation in vivo. We observed that TRIM28 knockdown animals showed significantly reduced metastatic nodules in lungs compared to control shRNA–injected animals (Figure 6(a)). Lesions were confirmed by H&E staining (Figure 6(b)). Taken together, all these results suggest a protumorigenic role for TRIM28.

TRIM28 knockdown reduced the metastasis in vivo. (a) The scatter plots show the number of metastatic nodules in immunocompromised mice. MDA-MB-231 cells stably expressing control shRNA or shTRIM28 were injected orthotopically (2 × 10⁶ cells/injection) into 5-week-old athymic nude mice and monitored for 3 months. At the end of 3 months, lungs were isolated and visually observed for nodules. (b) Representative H&E-stained images of the resected lungs. Black arrows indicate the metastatic cells. Inset shows enlarged image of the metastatic nodules. Error bar represents the standard error of the mean (SEM); **p < 0.01; ***p < 0.001 (n = 6).
Discussion
A majority of the breast cancer patients who relapse with cancer die due to metastasis to the distant organs in the body. The 5-year survival of distant metastatic breast cancer patients is approximately 20%. 37 However, there are no criteria to predict development of distant metastasis especially in those patients who do not display LN positivity. While recent diagnostic tests are focused on ER positive on LN-negative tumors, the percentage of Indian patients with ER-negative cancers is high. 38 Hence, it is very important to develop molecular markers to predict metastasis, irrespective of LN or ER status of the primary tumor. Several lines of evidence suggest that molecular differences exist between the primary tumors of patients who eventually develop distant metastasis and those who remain disease free. Indeed, the gene expression level changes in the primary tumors have been leveraged to develop the commercially available diagnostic tests such as Oncotype Dx (Genomic Health Inc., California, CA, USA) and MammaPrint (Agendia, Amsterdam, The Netherlands) to stratify patients into low- and high-risk groups for recurrence and metastasis. These signatures are developed mostly as surrogate markers for clinical management and do not attempt to explain the underlying differences between the metastatic and non-metastatic tumors with respect to tumor biology.
Another glaring lacuna in the field remains in that these tests were all developed and rigorously validated in mostly Western cohorts of ER-positive breast cancer patients. Majority of the Indian breast cancer patients are young in age, often pre-menopausal group and many of them being ER negative and triple negative categories, the above tests are inadequate for prediction of metastasis. Most of the genes that form part of the Oncotype Dx and MammaPrint test signatures are not differentially expressed in our study (our unpublished data). Hence, a detailed study of distant metastasis is important for the patients of the Indian subcontinent.
As a first step to develop a metastatic signature applicable to the Indian patients, and to understand the underlying biology of invasion, we studied a cohort of 80 breast cancer patients with follow-up information for at least 5 years. Of these, nine patients relapsed with distant metastasis within the study period. In this study, we have derived molecular differences between this metastatic primary tumor group and the corresponding disease-free group.
Our results on the functional characterization of TRIM28 role in breast cancer cells revealed interesting findings. Our data suggest that knockdown of TRIM28 down-regulates the expression of EMT markers in breast cancer cells. Consequently, there was a reduction in the migration and invasion of cells upon knockdown of TRIM28. These data are consistent with the reported actions of TRIM28 on lung cancers, 14 wherein TRIM28 was shown to regulate the EMT markers, migration, and invasion of lung cancer cells. In our results, in the context of breast cancer cells, TRIM28 was shown to regulate invasion and migration. Also, there was a significant decrease in the proliferation, doubling time, and the expression of stemness markers upon TRIM28 knockdown as revealed by the expression of CD44 and Bmi1 genes. Similarly, knockdown of TRIM28 reduced the cancer sphere formation and stem-like cell population in breast cancer cells. In addition, there was increased chemosensitivity in the TRIM28 knockdown cells. Most importantly, TRIM28 knockdown cells formed smaller tumors in immunocompromised mice and reduced metastatic nodules in the lungs. Interestingly, these tumors were more sensitive to DOX treatments. All these data suggest a pro-invasive and protumorigenic role for TRIM28 in breast cancer. While these experiments were ongoing, Addison et al. 11 reported a protumorigenic role of TRIM28 in breast cancer cells. They also compared the expression of TRIM28 between normal and breast cancer tumors reported in the TCGA data. Our data are in agreement with the reported data on the role of TRIM28 promoting the tumor growth in mice and increased expression in patients. However, in addition, our data revealed a loss of EMT, increased chemosensitivity, and decreased stemness of breast cancer cells upon knockdown of TRIM28.
Conclusion
In conclusion, the most important finding from our study is the identification of differential expression of genes belonging to a novel network of TRIM28 protein. Our results establish a role for TRIM28 on EMT, drug resistance, and stemness in addition to the already reported protumorigenic actions in breast and other cancers. These findings could form a basis for devising novel strategies in the management of breast cancers.
Footnotes
Acknowledgements
The authors thank Dr Vani Santosh for the help with histology, and Drs Ramesh Hariharan and Annapoorni Rangarajan for useful comments. They also thank Drs Debasis Dan and Jemima Jacob for initial discussions on data analysis; Drs Umaira Tabassum, Raghu Bhushan, and Rashmi for sample collection and processing; and Dr Imran Khan for the help with microarrays. The authors thank the Department of Biotechnology for a Research Associateship to surekha damineni (SD) and science and engineering research board (SERB) and confederation of Indian industry (CII) for providing Prime Minister’s fellowship to S.A.B. A.S. acknowledges funding from University Grants Commission (UGC), Government of India, for D.S. Kothari Postdoctoral Fellowship. The authors acknowledge the Flow Cytometry and Animal Facility at Indian Institute of Science (IISc). S.D., S.A.B., A.S., and S.N. contributed equally to this work.
Declaration of conflicting interests
The author(s) declared no potential conflicts of interest with respect to the research, authorship, and/or publication of this article.
Funding
This study was funded by the Department of Biotechnology in a program support, and infrastructure support to Molecular Reproduction and Development and Genetics (MRDG), Indian Institute of Science (IISc) by the Department of Science and Technology-Fund For Improvement of Science and Technology (DST-FIST), University Grants Commission (UGC), and Department of Science and Technology-Indian Institute of Sciences (DBT-IISc) partnership is acknowledged.
References
Supplementary Material
Please find the following supplemental material available below.
For Open Access articles published under a Creative Commons License, all supplemental material carries the same license as the article it is associated with.
For non-Open Access articles published, all supplemental material carries a non-exclusive license, and permission requests for re-use of supplemental material or any part of supplemental material shall be sent directly to the copyright owner as specified in the copyright notice associated with the article.