
Abstract
Peroxisome proliferator-activated receptor gamma coactivator-1 alpha plays a crucial role in regulating the biosynthesis of mitochondria, which is closely linked to the energy metabolism in various tumors. This study investigated the regulatory role of peroxisome proliferator-activated receptor gamma coactivator-1 alpha in the pathogenesis of hepatocellular carcinoma. In this study, the changes of peroxisome proliferator-activated receptor gamma coactivator-1 alpha messenger RNA levels between normal human liver and hepatocellular carcinoma tissue were examined by quantitative reverse transcription polymerase chain reaction. Knockdown of peroxisome proliferator-activated receptor gamma coactivator-1 alpha was conducted by RNA interference in the human liver cell line L02, while overexpression of peroxisome proliferator-activated receptor gamma coactivator-1 alpha was conducted by adenovirus encoding peroxisome proliferator-activated receptor gamma coactivator-1 alpha complementary DNA in the human hepatocarcinoma cell line HepG2. Cellular morphological changes were observed via optical and electron microscopy. Cellular apoptosis was determined by Hoechst 33258 staining. In addition, the expression levels of 21,400 genes in tissues and cells were detected by microarray. It was shown that peroxisome proliferator-activated receptor gamma coactivator-1 alpha expression was significantly downregulated in hepatocellular carcinoma compared with normal liver tissues. After knockdown of peroxisome proliferator-activated receptor gamma coactivator-1 alpha expression in L02 cells, cells reverted to immature and dedifferentiated morphology exhibiting cancerous tendency. Apoptosis occurred in the HepG2 cells after transfection by adenovirus encoding peroxisome proliferator-activated receptor gamma coactivator-1 alpha. Microarray analysis showed consistent results. The results suggest that peroxisome proliferator-activated receptor gamma coactivator-1 alpha acts as a tumor suppressor in the formation and development of hepatocellular carcinoma and that peroxisome proliferator-activated receptor gamma coactivator-1 alpha may be a potential therapeutic target for hepatocellular carcinoma.
Keywords
Introduction
Hepatocellular carcinoma (HCC), one of the most common tumors worldwide, has affected an increasingly large number of people over the past two decades,1–3 and it is the third most common cause of cancer-related death with 598, 000 deaths per year.4,5 The development of HCC is a complex and multistep process. Although the molecular pathogenesis of HCC remains unclear, the involvement of multiple genetic aberrations in the control of hepatocyte proliferation, differentiation, and death has been suggested.6,7
Mitochondria are primary regulators of cellular metabolism. The impairment of mitochondrial function results in decreased aerobic respiration and increased anaerobic respiration, which promotes the development, infiltration, and metabasis of carcinomas. Therefore, the impairment of mitochondrial function is proposed to play a causative role in tumor formation and development.8,9 Peroxisome proliferator-activated receptor gamma coactivator-1 alpha (PGC-1α) is a multiple-function transcription coactivator that regulates the activity of multiple nuclear receptors and transcription factors involved in mitochondrial biogenesis,10–12 and it also regulates oxidative metabolism in various tissues by coactivating other nuclear receptors and transcriptional factors. 13 PGC-1α also regulates the expression of many genes that code for mitochondrial proteins. In brown adipose or muscle tissues, PGC-1α induces the proliferation of mitochondria and increases the expression of oxidative phosphorylation genes, 14 and in liver, PGC-1α stimulates hepatic gluconeogenesis. 15 However, the overexpression of PGC-1α can result in some pathological alteration.
More recently, it has been found that the expression level of PGC-1α in certain cancerous tissues like breast cancer is significantly higher than in normal tissues.16,17 In our previous study, we reported that PGC-1α was involved in the apoptotic signal transduction pathways, and down-regulation of PGC-1α served as a key point in promoting the growth and progression of epithelial ovarian cancer and colon carcinoma,18,19 which allows us to speculate that there may be a potential relationship between PGC-1α and cancer development. The role of PGC-1α in the pathogenesis of HCC, however, remains unknown.
In this study, we explored the potential role of PGC-1α in HCC development by comparing human HCC tissues and cultured hepatocytes. We found, for the first time, that the expression level of PGC-1α was significantly decreased in HCC tissues. Mechanistic studies suggest that PGC-1α may initiate the apoptosis pathway by inhibiting genes involved in tumor development.
Materials and methods
Human hepatic tissues specimens
Tissue specimens from 23 patients (including 16 cases of HCC, aged 51.3 ± 7.1 years; 7 cases of hepatic cirrhosis, aged 47.3 ± 6.4 years) and 16 normal controls (aged 50.9 ± 9.3 years) were collected from Jinling Hospital and Yanggongjing Hospital. In addition, nine cases of PTC (aged 40.8 ± 14.6 years), nine cases of hyperthyroidism (aged 45.4 ± 7.1 years), and nine cases of normal thyroid tissues (aged 43.4 ± 8.9 years) were also collected from Jinling Hospital. HCC and PTC were confirmed by pathology diagnosis. Histological typing of the tumors was performed according to the World Health Organization criteria. Following surgery, tissues were snap frozen in liquid nitrogen and stored at −80°C for subsequent RNA extraction.
Cell line and culture conditions
Human normal hepatic cells (L02) and hepatoma cells (HepG2) were obtained from the State Key Lab of Pharmaceutical Biotechnology at Nanjing University. The cells were cultured at 37°C in RPMI-1640 medium supplemented with 10% fetal calf serum (Gibco BRL, Rockville, MD, USA) in a humidified environment containing 5% CO2. Cells in the logarithmic growth phase were used for experiments.
Adenovirus infection
Recombinant adenoviruses expressing PGC-1α GFP fusion protein and GFP alone were provided by Dr Dan Kelly (Washington University, St. Louis, MO, USA). Purified virus was stocked which were prepared through cesium chloride (CsCl) step-gradient centrifugation as described previously. 11 Cells were grown to confluence, induced to differentiate for 48 h, and then infected with adenovirus at MOI of 100. The infection efficiency was determined by comparison of GFP with the control. After 48 h of infection, cells were harvested for isolation of total RNA.
RNAi
In total, two siRNA sequences targeting different sites of human PGC-1α cDNA and another negative control sequence were designed and synthesized by Genesil (Wuhan, PR China). siRNA was transfected into L02 cells using the Metafectene reagent (Biontex, Munich, Germany) according to the manufacturer’s instructions. At 48 h after medium replacement, cells were harvested for total RNA isolation, and PGC-1α expression levels were analyzed by semi RT-PCR. The siRNA sequences used in the experiments are as follows: S1: 5′-GACGGAUUGCCCUCAUUUG-3′, S2: 5′-GAGCCGUCUCUACUUAAGA-3′, and S3: 5′-GCUUCAUAAGGCGCAUAGC-3′ (a non-specific oligonucleotide used as a negative control).
RNA analysis
Total RNA was isolated from tissues or cultured cells using the TRIzol method. The relative mRNA expression level of PGC-1α in tissues was quantified by semi RT-PCR. A volume of 2 µg of RNA was reverse transcribed into cDNA using 18 oligo (dT) primers (SuperScript III First-Strand Synthesis System for RT-PCR, Invitrogen, Carlsbad, CA, USA). PGC-1α and house-keeping gene glyceraldehyde-3-phosphate dehydrogenase (GAPDH) were amplified with specific primers: PGC-1α: 5′-CTGACCACAAACGATGACC-3′ (sense), 5′-GAACAAATCTGCCCCTGC-3′ (antisense); GAPDH: 5′-GAAGGTGAAGGTCGGAGT-3′ (sense), 5′-TGGGTGGAATCATATTGG-3′ (antisense), using the following parameters: 95°C for 5 min, 95°C for 1 min, 60°C (PGC-1α) and 59°C (GAPDH) for 1 min, and 72°C for 1 min, with a final extension step at 72°C for 7 min. PCR products were electrophoresed through 1.5% agarose gel, stained with ethidium bromide, and visualized under ultraviolet illumination. Band intensity was calculated densitometrically using Quantity One-4.4.1 imaging software (Bio-Rad Laboratories Pudong Shanghai, China). Levels of mRNA were expressed as the ratio of band intensity for PGC-1α relative to that of GAPDH.
qPCR for L02 cells was performed with the ABI Prism 7000 sequence detection system (Applied Biosystem, Foster City, CA, USA) using TaqMan probes (Shanghai Shinegene Molecular Biotechnology Co., Ltd, Shanghai, China), and threshold cycle numbers were obtained using ABI Prism 7000 SDS software version 1.0. The sequences of the primers and probes used for amplification were as follows: PGC-1α: 5′-GTCACCACCCAAATCCTTAT-3′ (sense), 5′-ATCTACTGCCTGGAGACCTT-3′ (antisense), 5′FAM + ATATGGTGATCGGGAACACGACC + TAMRA3′ (probe); GAPDH: 5′-CCACTCCTCCACCTTTGAC-3′ (sense), 5′-ACCCTGTTGCTGTAGCC-3′ (antisense), 5′FAM + TTGCCCTCAACGACCACTTTGTC + TAMRA3′ (probe). Conditions for amplification were as follows: one cycle of 94°C for 3 min; followed by 35 cycles of 94°C for 30 s, 60°C for 30 s, 72°C for 30 s; and final one cycle of 72°C for 7 min.
Hoechst 33258 staining
HepG2 cells were collected after infection with Ad-GFP and Ad-PGC-1α for 24 h, then washed with phosphate-buffered saline (PBS) and fixed with methanol-acetic acid (3:1, v/v) at 25°C for 10 min. After staining with Hoechst 33258 (Beyotime Biotechnology, Songjiang Shanghai, China) for 5 min, the samples were washed three times with PBS, dried, and then observed under a microscope (Nikon E800, Tokyo, Japan).
Electron microscopy
The tissues and cells were first fixed with 2.5% glutaraldehyde in 0.1 M PBS (pH 7.4) for 2 h at 4°C and then post-fixed in 1% osmium tetroxide and 0.1 M phosphate buffer (pH 7.4). After dehydrating in ethanol and embedding in an Epon-Araldite mixture, tissues were sectioned on a Reichert-Jung Ultracut-E ultramicrotome and stained with lead citrate. Samples were examined with a JAM-1200 electron microscope (JEOL, Tokyo, Japan).
Microarray assay
Total RNA of tissues and cells were isolated using TRIzol reagent (Invitrogen) and analyzed by a human genome microarray from CapitalBio Corporation (Beijing, China). A minimum of program 12 uses normalized spatial and intensity dependence. In total, three independent experiments were performed, and for each test and control sample, two hybridizations were performed using a reversal fluorescent strategy. Only genes with alteration tendency that were consistent in both microarray assays and showed at least a two-fold change when compared with the control were designated as differentially expressed genes.
Statistical analysis
The results are expressed as means ± standard deviation (SD). Statistical analyses were performed using SPSS 10.0, and two-group differences were detected using two-tailed independent Student’s t-tests. Statistical significance was accepted at the level of p < 0.05.
Results
PGC-1α expression was decreased in the tissues of HCC patients
All patients enrolled in this study were clinically and pathologically diagnosed with HCC. Patient characteristics are listed in Table 1. Quantitative reverse transcription polymerase chain reaction (qRT-PCR) was employed to assess the levels of PGC-1α messenger RNA (mRNA) in normal liver (n = 16), hepatocirrhosis (n = 7), and HCC tissues (n = 16). Results showed that expression of PGC-1α was decreased to 25% in HCC as compared with normal tissue and hepatocirrhosis (p < 0.05). Although the p value was not significant, the PGC-1α levels were lower in hepatocirrhosis when compared with either normal samples or hepatocirrhosis (Figure 1(a)–(c)). Electron microscopic analysis revealed ultrastructural derangements in the mitochondria, including the myelinoclasis of mitochondrial membrane and vacuolization of mitochondria (Figure 1(d) and (e)).
Clinical and pathological data of patients with HCC.

HCC: hepatocellular carcinoma; AFP: alpha-fetoprotein.

The expression pattern of PGC-1α in HCC. (a) Real time RT-PCR of PGC-1α mRNA in normal liver (n = 16), hepatocirrhosis (n = 7), and liver cancer tissues (n = 16). Bars represent the mean ± SE of the ratio between PGC-1α and GAPDH. The expression of PGC-1α mRNA in liver cancer was assumed to be *p < 0.05 versus hepatocirrhosis and normal liver tissue. (b) Western blot analysis of PGC-1α in HCC and hepatocirrhosis tissues (n = 3). (c) Quantitative analysis of (b). (d) Electron microscope photos of normal liver tissues. (e) Electron microscope photos of HCC tissues.
Suppression of PGC-1α expression in L02 cells by RNA interference promotes cancerous tendency
To further testify our hypothesis that PGC-1α is in action with the formation and development of HCC, two RNA interference (RNAi) sequence short hairpin RNAs (shRNAs) targeting human PGC-1α complementary DNA (cDNA) homology region were designed and transfected into cultured human normal liver cell line L02 to inhibit the expression of PGC-1α. As shown in Figure 2(a) and (b), short interfering RNA (siRNA) S2 inhibited PGC-1α expression by 72% in L02 cells when compared with the negative control (siRNA HK); therefore, S2 was chosen as inhibitor sequence (Figure 2(a)–(d)).

Knockdown of PGC-1α by shRNA in L02 cells. (a) Photographs show PCR sets of products from L02 cells (n = 3 per group). Left side lanes show DNA markers. (b) Densitometric quantitation of PGC-1α mRNA expression in cells. Bars represent the mean ± SD of the ratio between PGC-1α and GAPDH. (c) PGC-1α protein levels were decreased by shRNA (n = 3). (d) Quantitative analysis of (c).
Next, we examined whether PGC-1α could affect the growth of L02 cells. After PGC-1α expression in L02 cells was inhibited by shRNA, the cells exhibited obvious changes in morphology, that is, decreased number, clustered distribution, and enlarged nuclei. About 50% cells were observed to have increased rate of nucleus to cytoplasm ratio. In addition, the cellular ultrastructure also exhibited visible alteration. About 30% of cellular mitochondria degenerated into myelin sheath structures. These results indicate that after suppression of PGC-1α, the cells reverted to immature and dedifferentiated morphologies, closely resembling cancer cells (Figure 3(a)–(c)).

Electron microscope photos of L02 cell line interfered by shRNA1. (a) Electron microscope photos of L02. (b) Electron microscope photos of transfected HK. (c) Electron microscope photos of transfected shRNA1.
PGC-1α overexpression promotes apoptosis in HepG2 cells
Our results have indicated that increased PGC-1α expression is necessary for inhibiting cancerous tendency. To further confirm our results, we overexpressed PGC-1α in HepG2 cells. After plasmids of pBluescript SK(II)-Ad-PGC-1α and pBluescript SK(II)-Ad-GFP were ingested by Pac I, two fragments of 9 kb and 5 kb were obtained and amplified by a PGC-1α primer. A bright band at 477 bp only in DNA with adenovirus encoding peroxisome proliferator-activated receptor gamma coactivator-1 alpha (Ad-PGC-1α) was observed, indicating that PGC-1α adenoviral vectors were successfully constructed (Figure 4(a) and (b)). Furthermore, Table 2 showed that when multiplicity of infection (MOI) is 100, optimum efficiency for adenovirus infection was reached.

Overexpression of PGC-1α in L02 cells. (a) Electrophoresis of plasmids after being ingested by Pac I. Left lane: pBluescript SK(II)-Ad-GFP; Right lane: pBluescript SK(II)-Ad-PGC-1α. (b) Electrophoresis results of PCR of virus DNA. (c) PGC-1α expression level in HepG2 cells transfected by Ad-PGC-1α. Photographs show PCR sets of products from HepG2 cells. Left side lanes show DNA markers. (d) Densitometric quantitation of PGC-1α mRNA expression in cells (n = 3). (e) Western blot analysis of PGC-1α in L02 cells transfected with Ad-PGC-1 plasmids (n = 3).
Infection efficiency using different MOI adenovirus to infect L02 cells.

MOI: multiplicity of infection.
Next, the effect of increased PGC-1α expression on hepatocarcinoma was analyzed. Expression of PGC-1α mRNA in HepG2 cells was upregulated more than five times which was transfected by Ad-PGC-1α than control (Figure 4(c) and (d)). The protein levels of PGC-1α were also increased significantly (Figure 4(e)).
Furthermore, morphology analysis also showed that overexpression of PGC-1α attenuates cancer tendency. After 48 h of transfection of HepG2 cells with Ad-PGC-1α, protoplasm concentration, shrinkage of nuclei, diminished cell volume, abrogation of cell-to-cell contact, and partial detachment from the culture plate (Figure 5(a) and (b)) were observed, indicating that these cells underwent apoptosis. The Hoechst staining assay was also used to observe apoptosis. The results showed that enlarged subdivided nuclei were stained bright blue, signifying apoptosis in HepG2 with the transfection of Ad-PGC-1α, while none of these results were found in the control which was transfected with adenovirus encoding green fluorescent protein (Ad-GFP) (Figure 5(c) and (d)). A similar experiment was conducted in normal cells but there existed nearly no apoptosis after overexpression of PGC-1α (Figure 5(e) and (f)). This result suggests that PGC-1α may possibly initiate apoptosis pathway and strongly supports that overexpression of PGC-1α in malignant cell attenuates cancerous tendency. Based upon the above results, we propose that PGC-1α may have an important role in hepatocellular carcinoma pathogenesis.

Role of overexpressed PGC-1α in HepG2 cells. (a and b) Morphological observation of HepG2 cell line transfected by Ad-GFP and Ad-PGC-1(×40). (c and d) Fluorescent pictures of HepG2 cells dyed with Hoechst 33258 (×40). (e and f) Fluorescent pictures of normal cells dyed with Hoechst 33258 (×10).
Global changes in gene expression profiles among HCC, hepatocirrhosis, and normal liver tissues determined by microarray
We analyzed the gene expression profiles of HCC, hepatocirrhosis, and normal liver tissues and detected a total of 21,400 genes. As summarized in Table 3, compared to normal liver tissues, significantly downregulated genes were found to be involved in glucose, lipid, and amino acid metabolism in hepatocirrhosis. Compared to hepatocirrhosis, genes involved in glucose, lipid, and amino acid metabolism were downregulated in HCC. Increased expression of some genes involved in extracellular matrix protein synthesis and blood coagulation was also observed. Compared to normal liver tissues, genes that are involved in glucose, lipid, and amino acid metabolism were significantly downregulated in HCC liver tissue. Specifically, redox reaction genes were significantly downregulated while extracellular matrix protein genes were upregulated. The common change in gene expression profiles between hepatocirrhosis/normal and HCC/normal tissues could be seen in Table 4. Overall, the alteration in gene expression levels from normal liver to hepatic cirrhosis tissue was similar to that from hepatic cirrhosis to HCC.
The comparison of gene expression profiles among liver tissues.

HCC: hepatocellular carcinoma.
The common change in gene expression profiles between hepatocirrhosis/normal and HCC/normal tissues.

HCC: hepatocellular carcinoma.
Global changes in gene expression profiles associated with PGC-1α inhibition in L02 and upregulation in HepG2 cells by microarray
PGC-1α expression in L02 cells inhibition was associated with significant gene changes (Table 5). Some mitochondrial enzyme genes and several other genes involved in lipid and amino acid metabolism were downregulated, while genes related to tumor generation were upregulated (Table 5). In addition, many genes involved in immunoreactivity and some cellular matrix protein genes were also upregulated. The gene expression profile of the L02 cells with inhibition of PGC-1α was similar to that of HCC (Tables 6 and 7), which confirmed the above morphologic results.
The gene expression profile of L02 after RNAi treatment.

RNAi: RNA interference; GTP: Guanosine-5′-triphosphate.
Some downregulated and upregulated genes in both RNAi-L02 and HCC.
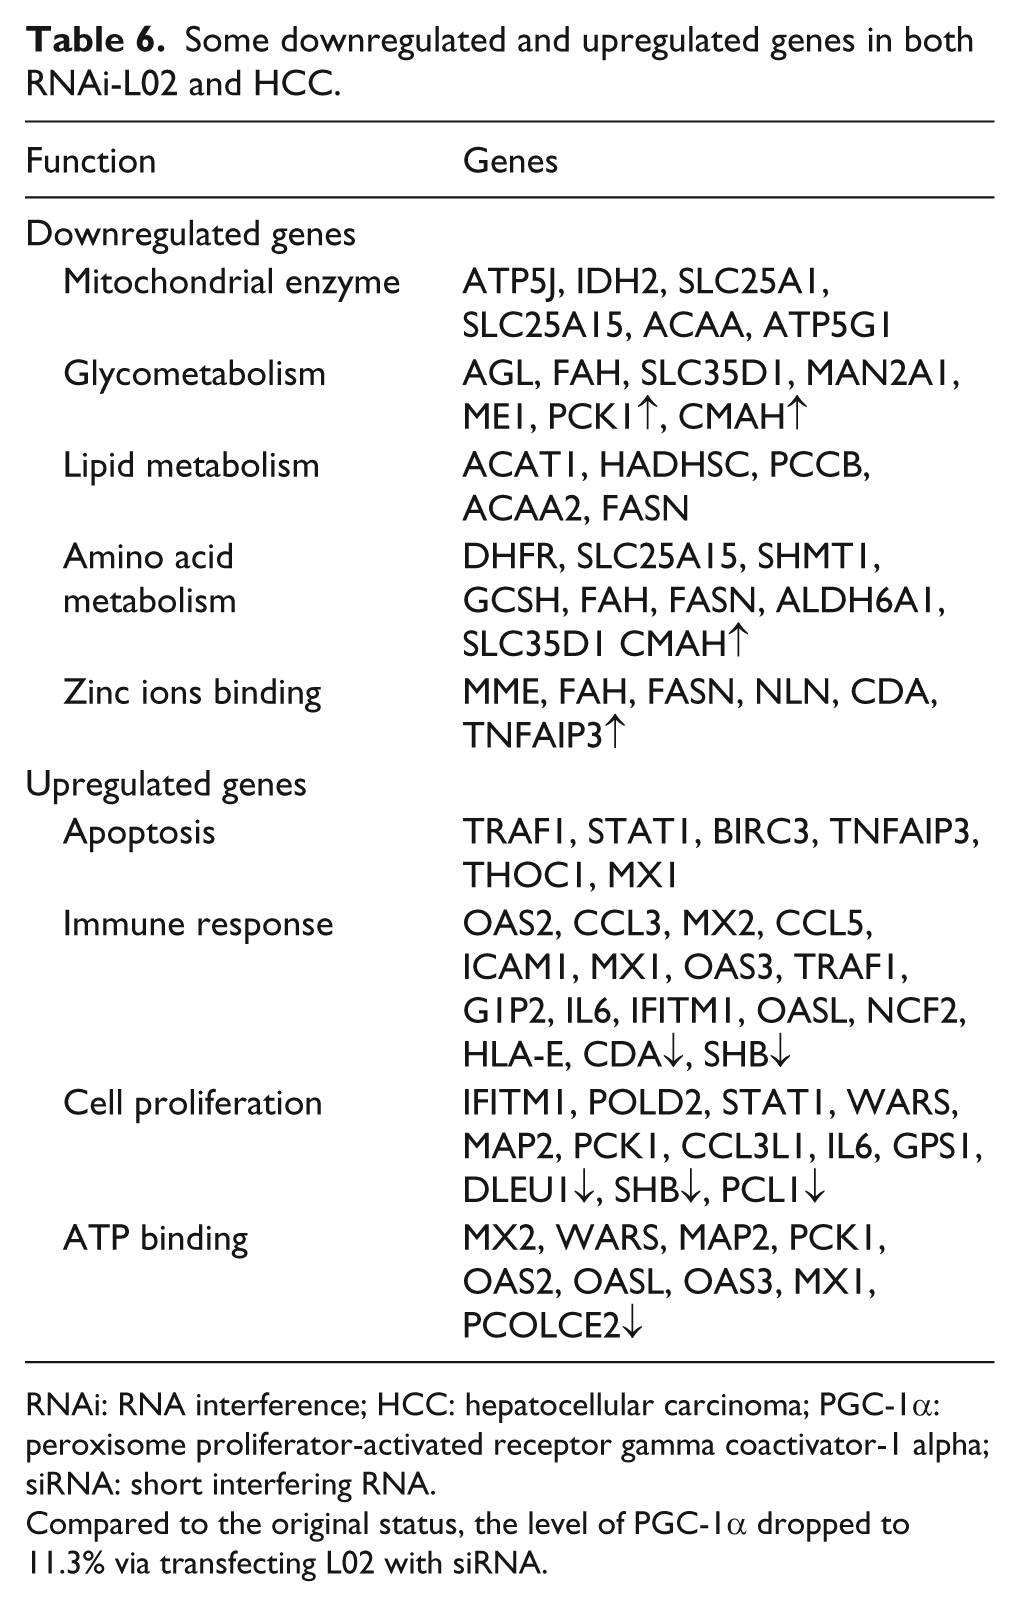
RNAi: RNA interference; HCC: hepatocellular carcinoma; PGC-1α: peroxisome proliferator-activated receptor gamma coactivator-1 alpha; siRNA: short interfering RNA.
Compared to the original status, the level of PGC-1α dropped to 11.3% via transfecting L02 with siRNA.
The common change in gene expression profiles between RNAi-L02/negative control and HCC/normal tissues.

RNAi: RNA interference; HCC: hepatocellular carcinoma.
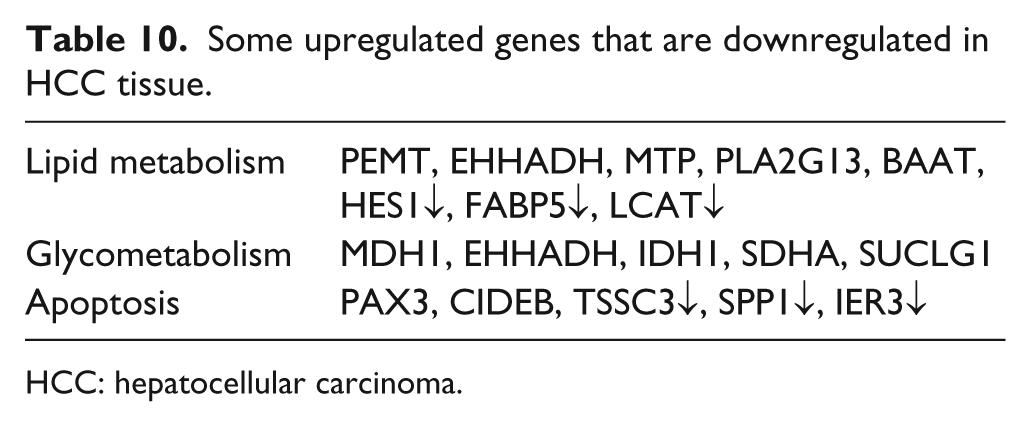
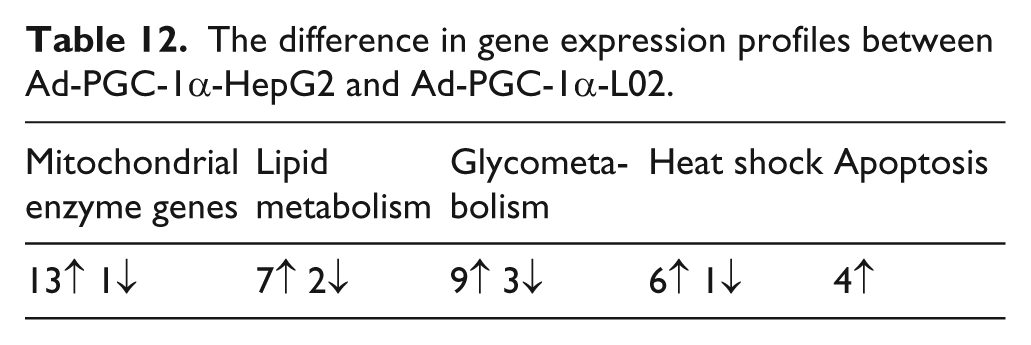
We then analyzed the changes of gene expression in HepG2 cells after overexpressing PGC-1α by microarray (Table 8). As expected, after HepG2 cells overexpressed PGC-1α, some genes involved in glucose and lipid metabolism, mitochondrial electron transport, and oxidative phosphorylation were upregulated (Table 9). The overexpression of PGC-1α in HepG2 reactivated some genes that are usually inhibited in HCC tissue, including some mitochondrial enzyme genes involved in respiration and oxidative phosphorylation, such as electron-transferring-flavoprotein dehydrogenase, malate dehydrogenase 1, soluble isocitrate dehydrogenase 1 and enoyl-coenzyme A, hydratase/3-hydroxyacyl coenzyme A dehydrogenase, and so on (Table 10). In addition, the overexpression of PGC-1α in HepG2 also inhibited some genes involved in tumor development, deterioration, and metastasis, which have been seen to be upregulated in HCC tumorous tissue, such as SPP1, ENC1, and IER3 (Table 11). The differences between Ad-PGC-1α-HepG2 and Ad-PGC-1α-L02 (Table 12) suggest that PGC-1α may have a function of inhibiting the development of HCC. Thus, the global changes in gene expression revealed by microarray are consistent with the above conclusions.
The gene expression profile of HepG2 cells after Ad-PGC-1α infection.

Ad-PGC-1α: adenovirus encoding peroxisome proliferator-activated receptor gamma coactivator-1 alpha.
Some upregulated mitochondrial enzymes that are downregulated in HCC tissue.
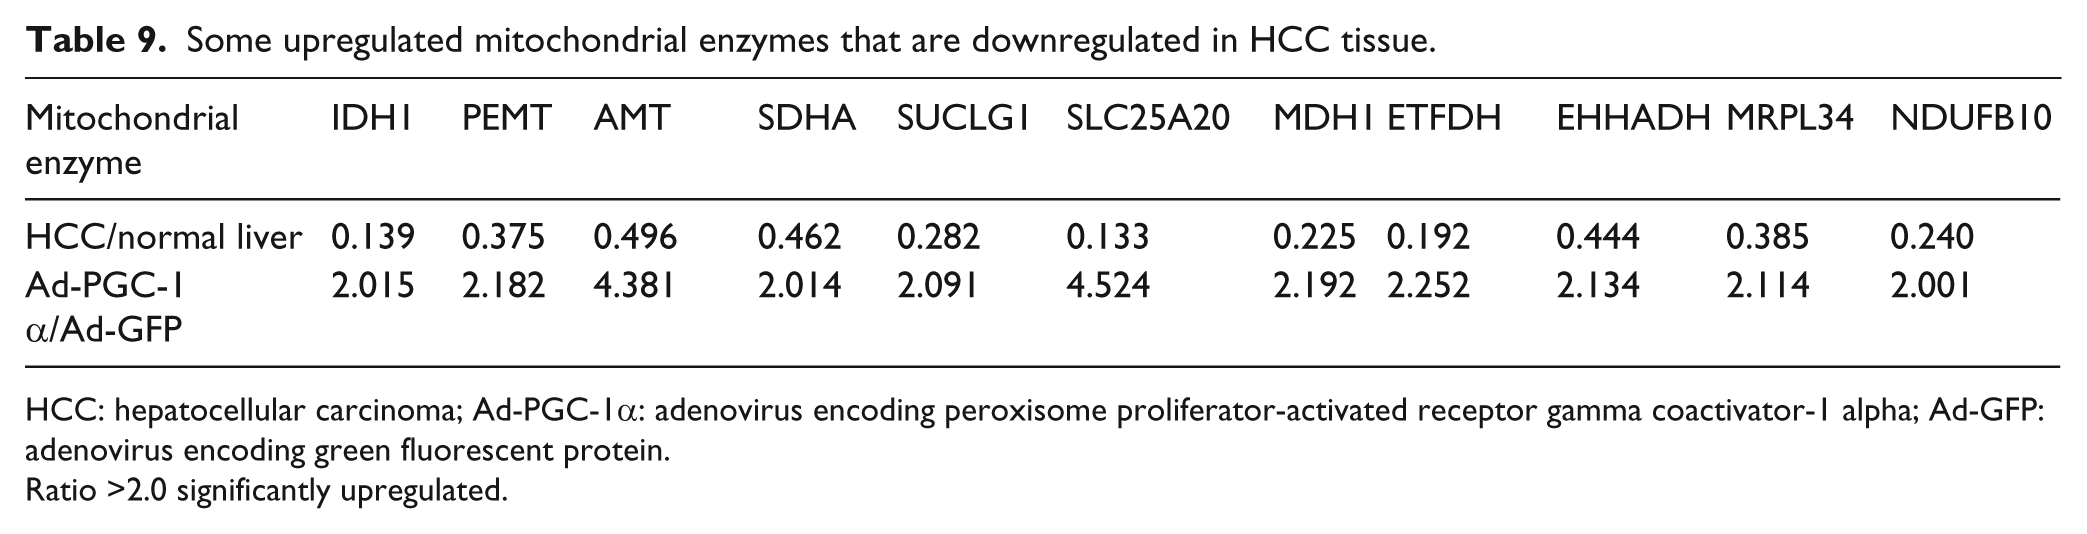
HCC: hepatocellular carcinoma; Ad-PGC-1α: adenovirus encoding peroxisome proliferator-activated receptor gamma coactivator-1 alpha; Ad-GFP: adenovirus encoding green fluorescent protein.
Ratio >2.0 significantly upregulated.
Some upregulated genes that are downregulated in HCC tissue.
HCC: hepatocellular carcinoma.
Some downregulated tumor related genes in Ad-PGC-1α-HepG2 that are upregulated in HCC tissue.

HCC: hepatocellular carcinoma; Ad-PGC-1α: adenovirus encoding peroxisome proliferator-activated receptor gamma coactivator-1 alpha; Ad-GFP: adenovirus encoding green fluorescent protein.
Ratio >2.0 significantly upregulated; ratio <0.5 significantly downregulated.
The difference in gene expression profiles between Ad-PGC-1α-HepG2 and Ad-PGC-1α-L02.
PGC-1α expression was also decreased in the tissues of papillary thyroid carcinoma
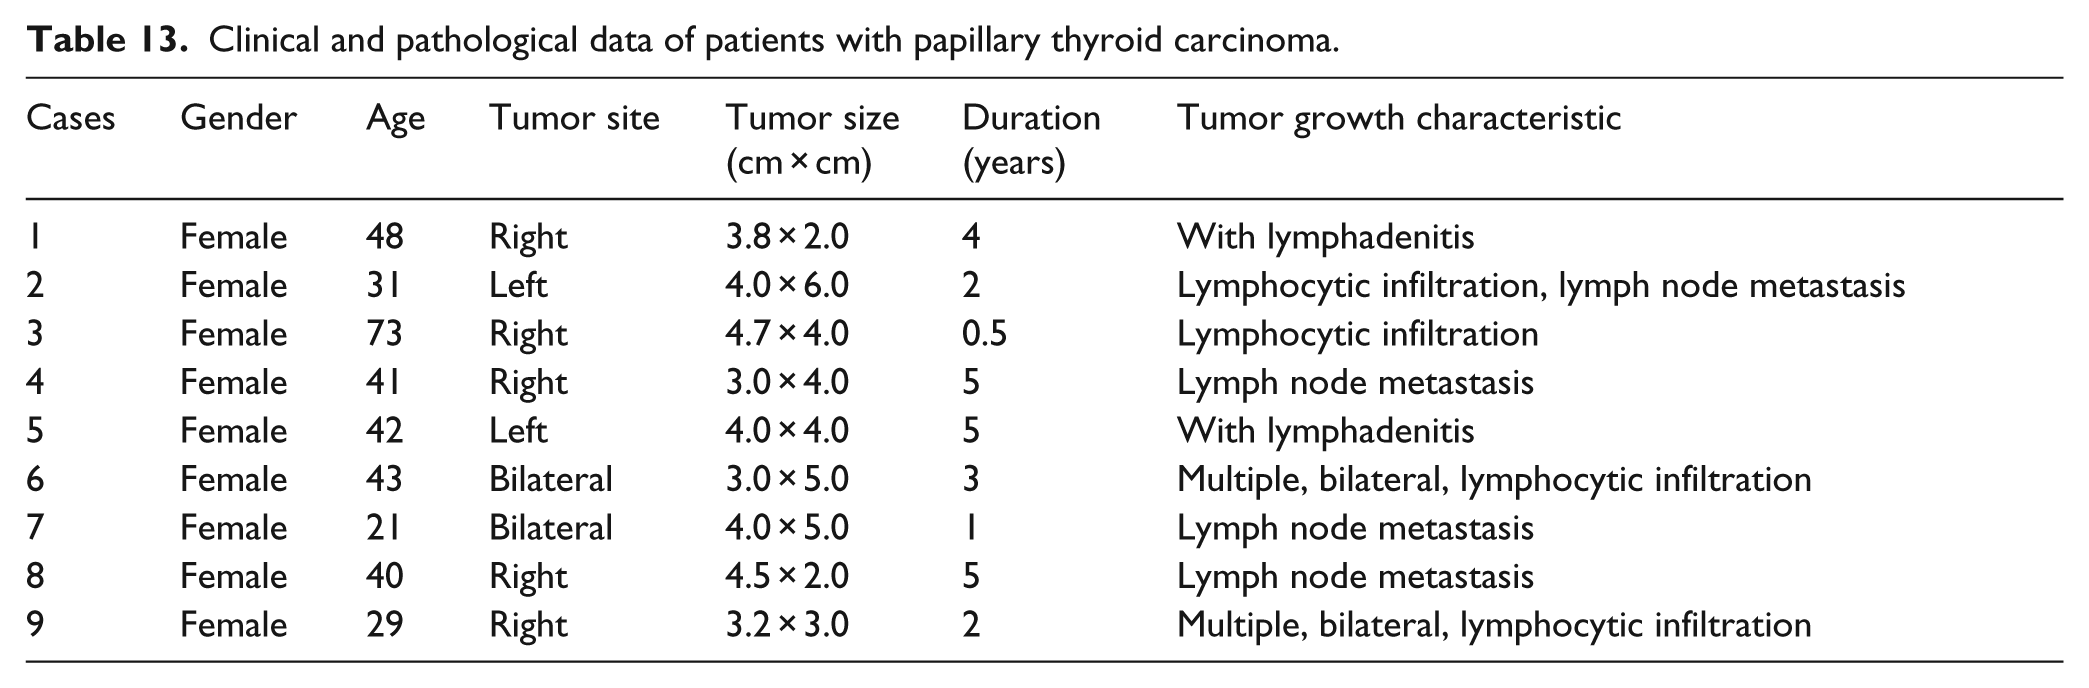
We also measured the expression level of PGC-1α mRNA in papillary thyroid carcinoma (PTC), hyperthyroidism, and normal tissues. The nine patients enrolled in this section of the study were clinically and pathologically diagnosed with PTC. Data of the patients are shown in Table 13.
Clinical and pathological data of patients with papillary thyroid carcinoma.
The expression level of PGC-1α mRNA in PTC tissue was significantly repressed when compared with normal thyroid and hyperthyroidism tissues. As can be seen in Figure 6(a) and (b), the expression level of PGC-1α in PTC was just 40% of normal thyroid (p < 0.01) and was also lower than hyperthyroidism (p < 0.01). However, no significant differences were observed between hyperthyroidism and normal tissues. The results suggest that decreased level of PGC-1α expression is a common characteristic shared by a range of tumors.

Relative levels of PGC-1α mRNA in normal thyroid, hyperthyroidism, and thyroid carcinoma. (a) Photographs show PCR products from normal thyroid, hyperthyroidism, and thyroid carcinoma (n = 3 per group). Left side lanes show DNA markers. (b) Densitometric quantitation of PGC-1α mRNA expression in three kinds of thyroid tissues. Bars represent the mean ± SE of the ratio between PGC-1α and GAPDH. The expression of PGC-1α in thyroid carcinoma (n = 9) was assumed to be *p < 0.05 versus normal thyroid tissue (n = 9) and thyroid tissues from hyperthyroidism (n = 7).
Discussion
HCC is one of the most common solid tumors worldwide. Cancer cells can spread to the liver through the hepatic portal vein. HCC is usually diagnosed at an advanced stage with very poor prognosis. Hepatocarcinogenesis is a multistep process evolving from normal through chronic hepatitis/cirrhosis and dysplastic nodules to HCC.2,4,5 Despite its significance, there is only an elemental understanding of the molecular, cellular, and environmental mechanisms that drive pathogenesis. Therefore, study of the pathogenesis of HCC is very important.6,7 Some reports show that the impairment of mitochondrial function is significantly severe in hepatocarcinogenesis20,21 and the changes of mitochondrial oxidative phosphorylation in the tumor cell can profoundly influence tumorigenesis, clinical phenotype, and prognosis. 22 The level of PGC-1α is always linked to clinical outcome in patients with a variety of human cancers.16–19 It has also been shown to stimulate mitochondrial biogenesis and respiration in muscle cells 14 and hepatic gluconeogenesis in liver; 15 therefore, it is reasonable to suspect that PGC-1α may also play a pivotal role in the pathogenic development of HCC. However, no correlation has been established for the possible involvement of PGC-1α in HCC.
In this study, we demonstrated that PGC-1α mRNA levels were significantly decreased in HCC tissues when compared with normal liver tissues. This finding is also consistent with other reports and our own studies showing that PGC-1α is downregulated in colon cancer and epithelial ovarian cancer. 19 It has been shown that the expression levels of PGC-1α were significantly decreased in HCC tissues compared to hepatic cirrhosis and normal liver tissues. A non-significant decrease in expression level of PGC-1α was also observed in hepatic cirrhosis when compared with normal liver tissue. Due to the downregulation of PGC-1α in HCC, the expression of PGC-1α in HCC cell line HepG2 was upregulated by adenovirus infection of PGC-1α in cancer survivorship. After 24 h, HepG2 cells underwent apoptosis as evidenced by positive Hoechst staining. This result suggests that PGC-1α possibly initiates the apoptosis pathway. This model is consistent with our previous results that PGC-1α can induce apoptosis in cancer cells, and cytochrome c release from mitochondria into the cytosol after elevation of PGC-1α expression might actively trigger the apoptosis. 19
Gene microarray analysis showed upregulation of antiapoptotic genes, such as IER3, in HCC tissues when compared with control samples. However, apoptosis was not observed in normal rat vascular smooth muscle cell with overexpressed PGC-1α. PGC-1α has been shown to stimulate mitochondrial biogenesis and respiration in muscle cells 14 and to stimulate the hepatic gluconeogenesis in liver. 15 The differing effects of PGC-1α upregulation in HCC and normal rat vascular smooth muscle cells suggest a different function or role of PGC-1α expression in the cell. Overexpression of PGC-1α in normal cells is mainly involved in proliferation of mitochondria, while overexpression of PGC-1α in the cancer cell not only participates in mitochondrial synthetic biology but also participates in the initiation of the apoptosis pathway, ultimately leading to cell death and removal.
We also inhibited the PGC-1α expression in normal liver cell lines (L02 cells) by shRNA. These cells paralleled the morphological changes observed in HCC cells. In addition, the cellular ultrastructure also exhibited visible alteration. These results suggested that inhibition of PGC-1α promotes tumorigenesis, which is similar to the changes in the mitochondrial structure of HCC tissues and cells. Both the myelinoclasis of mitochondria membrane and vacuolization of mitochondria resulted in depressed respiration levels in cells. Other effects of PGC-1α inhibition on mitochondria by shRNA included a severe respiratory deficiency marked by slow growth on galactose, defective respiratory subunit expression, reduced respiratory enzyme levels and ATP production, and hypoxia. The changes observed in L02 cells were far more dramatic compared to those in HCC tissues, likely due to the time frame allowed by the experimental treatment. The changes of morphology and mitochondrial structure indicate that L02 cells became predisposed to malignancy after inhibition of the PGC-1α expression. Based on the above results, we speculate that PGC-1α is closely involved in the pathogenesis of HCC.
We also analyzed the gene expression levels of both tissues and cells by microarray. It was found that the alteration in gene expression levels from normal liver to hepatic cirrhosis tissue was similar to those from HCC to hepatic cirrhosis tissue. These altered genes include those involved in mitochondrial electron transport, oxidative phosphorylation, extracellular matrix protein synthesis, and blood coagulation. This result suggests that it is a gradual procession changing from normal hepatocytes to hepatic cirrhosis and then to HCC and that PGC-1α may play a certain role in the transformation from hepatic cirrhosis to HCC.
After PGC-1α expression in L02 cells was inhibited, some mitochondrial enzymes genes that are involved in lipid and amino acid metabolism were downregulated. However, many genes involved in tumor generation, immunoreactivity, and cellular matrix protein synthesis were upregulated. These results were similar to HCC, verifying the above morphologic results indicating that cells change from primarily aerobic respiration to anaerobic in cancer pathology. 22
After PGC-1α were overexpressed in HepG2 cells, many genes involved in glucose and lipid metabolism, mitochondrial electron transport, and oxidative phosphorylation were upregulated; other genes inhibited in HCC tumorous tissue were reactivated; and many genes involved in tumor development, deterioration, and metastasis, usually upregulated in HCC tissue, were inhibited. It seems that the HepG2 cell malignancy was decreased after PGC-1α overexpression. These results show that PGC-1α could contribute to the development and progression of HCC.
In addition, the expression level of PGC-1α mRNA in PTC was also measured using both semi-qRT-PCR and qRT-PCR method. The expression level of PGC-1α mRNA in PTC tissue was significantly repressed compared with normal thyroid and hyperthyroidism tissues in this study. No difference, however, was seen between tissue samples from patients with hyperthyroidism and control samples. Based on these findings, tumors most likely exhibit decreased levels of PGC-1α expression when compared with healthy subjects. The mechanism of PGC-1α regulation in carcinomas is not clear; thus, our group is now exploring the mechanisms and signaling pathways that regulate PGC-1α expression.
This study provides the first evidence that repressed expression of PGC-1α plays an important role in the formation and development of HCC, and the overexpression of PGC-1α in HCC cell lines promotes apoptosis. PGC-1α may be a potential effective therapeutic target for HCC.
Footnotes
Declaration of conflicting interests
The author(s) declared no potential conflicts of interest with respect to the research, authorship, and/or publication of this article.
Funding
This study is supported by Program for National Natural Science Fund of China (No. 81201946, 81372394, and 30772484), Ministry of Education Research Fund for Doctoral Program (No. 2012202120013), Science Foundation of the Medical University of Tianjin (No. 2011KY15), and National Research Platform of Clinical Evaluation Technology for New Anticancer Drugs (No. 2013ZX09303001).