
Abstract
Despite an overall good prognosis, a significant proportion of patients with hormone receptor positive human epidermal growth factor receptor 2 negative breast cancers develop distant metastases. The metastatic potential of epithelial cells is known to be regulated by tumor–stromal interaction and mediated by epithelial-to-mesenchymal transition. Hormone receptor positive human epidermal growth factor receptor 2 negative tumors were used to estimate markers of epithelial-to-mesenchymal transition, and the luminal breast cancer cell line MCF-7 was used to examine the interactions between integrins and growth factor receptors in causation of epithelial-to-mesenchymal transition. A total of 140 primary tumors were sub-divided into groups enriched for the markers of epithelial-to-mesenchymal transition (snail family transcriptional repressor 2 and integrin β6) versus those with low levels. Within the epithelial-to-mesenchymal transition+ tumors, there was a positive correlation between the transcripts of integrin β6 and growth factor receptors—human epidermal growth factor receptor 2 and epidermal growth factor receptor. In tumors enriched for epithelial-to-mesenchymal transition markers, patients with tumors with the highest quartile of growth factor receptor transcripts had a shorter disease-free survival compared to patients with low growth factor receptor expression by Kaplan–Meier analysis (log rank, p = 0.03). Epithelial-to-mesenchymal transition was induced in MCF-7 cells by treatment with transforming growth factor beta 1 and confirmed by upregulation of SNAI1 and SNAI2 transcripts, increase of vimentin and integrin β6 protein, and repression of E-cadherin. Treatment of these cells with the dual-specificity tyrosine-kinase inhibitor lapatinib led to downregulation of epithelial-to-mesenchymal transition as indicated by lower levels of SNAI1 and SNAI2 transcripts, integrin αvβ6, and matrix metalloproteinase 9 protein. The results suggest that synergistic interactions between growth factor receptors and integrin β6 could mediate epithelial-to-mesenchymal transition and migration in a subset of luminal breast cancers and lapatinib might be effective in disrupting this interaction.
Keywords
Introduction
Distant metastasis of the tumor accounts for most of the mortality in women with breast cancer. The hormone receptor–positive luminal tumors that do not meet the clinical threshold for human epidermal growth factor receptor 2 (HER2) expression by immunohistochemistry (IHC)/fluorescence in situ hybridization (FISH) (hormone receptor positive human epidermal growth factor receptor 2 negative (HR+HER2−)) have the best overall prognosis, with a very low risk of recurrence. 1 However, data from large studies suggest that luminal tumors are the most heterogeneous with varied mutational spectrum, copy number aberrations, gene expression signatures, and patient outcomes. 2
There is wide agreement that the biological determinant that has the best correlation with poor prognosis in the HR+HER2− subgroup is a measure of the rate of proliferation. The established methods for quantitative estimation of this attribute are by the use of either Ki-67 labeling index (LI)3–5 or gene expression–based measures of markers of proliferation that have been used by commercialized tests including Oncotype DX, MammaPrint, and EndoPredict.6–8
Invasiveness and migratory potential are obvious traits that influence distant metastasis and are independent of the proliferative capacity of tumors. Currently, there is no single test in the form of a set of markers that can identify and quantify these attributes in human tumor specimens. Recent studies have elucidated multiple signaling pathways that converge at epithelial-to-mesenchymal transition (EMT) and lead to tumor progression. Tumor cells, when cued by stroma-derived growth factors like transforming growth factor beta 1 (TGFβ1), undergo transition into a mesenchymal state. 9 This alters extracellular matrix (ECM) proteins which activate the cell-surface integrin family of heterodimeric proteins,10,11 leading to a positive feedback loop with TGFβ1 contributing to increased aggressiveness of tumor cells.12,13
Engagement of integrin receptors has been shown to amplify growth factor receptor signaling by direct phosphorylation. This cross-talk between integrins and tyrosine-kinase receptors has been shown to lead to signaling events controlling metastatic cascades.14,15 We and others have recently presented evidence for a cross-talk between high levels of αvβ6 in clinically HER2+ tumors leading to a higher migratory and invasive behavior of tumor cells through the Rho-Rac pathway accounting for higher rates of metastasis.16,17
The clinical threshold of HER2 positivity by IHC and FISH that was established for selecting patients who could receive treatment with trastuzumab excludes many tumors that still possess detectable levels of HER2 transcripts.18,19 Most of these tumors are classified as HR+HER2−, and Pinhel et al. 20 have reported that significant levels of HER2 messenger RNA (mRNA) are sufficient to skew the prognosis of patients within this subtype. In this report, we have examined the consequence of growth factor receptor expression in the context of integrin β6 (ITGB6) and snail family transcriptional repressor 2 (SNAI2); makers of EMT, in human tumors. In order to manipulate this interaction, we induced EMT in MCF-7 cells (known to have significant levels of HER2 transcripts despite having no HER2 amplification) 21 with TGFβ1 and independently used the dual-specificity tyrosine-kinase inhibitor lapatinib and functional blocking antibody against integrin αvβ6.
Materials and methods
Cell lines and reagents
Breast cancer cell lines, MCF-7 (luminal) and SK-BR-3 (HER2+) belonging to two different molecular subtypes, were procured from American Type Culture Collection (ATCC, Manassas, VA, USA) and cultured according to ATCC guidelines. Briefly, MCF-7 and SK-BR-3 cells were maintained in Dulbecco’s modified Eagle’s medium (DMEM)-high glucose (Sigma) and RPMI-1640 (Gibco), respectively; 4-(2-hydroxyethyl)-1-piperazineethanesulfonic acid (HEPES) buffered; and supplemented with heat inactivated 10% (v/v) fetal bovine serum (FBS; Gibco) and 100 U/mL of penicillin and streptomycin (Gibco). Both cell lines were maintained in a humidified chamber at 37°C with 5% CO2. Cell lines were recharacterized phenotypically in the lab and routinely tested for mycoplasma and were found to be negative. 22 For all experimental work using cell lines, a passage number below 20 was used.
Human recombinant TGFβ1 (R&D Systems) was reconstituted as per manufacturer’s instruction; dose standardization was done and used at a concentration of 5 ng/mL to induce EMT for all experiments. Lapatinib ditosylate (GW-572016; Selleck Chemicals LLC) was reconstituted in dimethyl sulfoxide (DMSO) and used at various doses for treatment of MCF-7 and SK-BR-3 after assessment of cell viability by dose response curves (Online Resource 1). Function-blocking mouse monoclonal antibody to integrin alpha v + beta 6 (ab77906; Abcam) was used at a concentration of 50 µg/mL to treat TGFβ1-induced MCF-7 cells, and quantitative real time polymerase chain reaction (qRT-PCR) assay was done to assess changes in gene expression of EMT markers. The following primary antibodies were used for western blot or immunofluorescence: β actin (Sigma), E-cadherin (Clone-NCH38; Dako), Vimentin (Clone V9; BioGenex), and αvβ6 (Clone 6.2-A1; kind gift from Biogen Idec Inc.).
Breast tumor specimens
Tumor bits from surgically excised breast tumors from women with a confirmed diagnosis of breast cancer were collected from 446 women at two tertiary-care hospitals in Bangalore from June 2008 to February 2013. Informed consent for use of the material for research was obtained from all patients, and the study was approved by the ethics committee at each hospital. Samples were fixed in 10% neutral buffered formalin at room temperature (RT) and stored as formalin-fixed paraffin-embedded (FFPE) blocks. All tissues were sectioned and stained with hematoxylin and eosin (H&E; Merck). Only those with >50% tumor content as estimated by a pathologist (J.S.P.) and passing the quality control (QC) criteria for RNA 23 (N = 275) were used in all molecular analysis. Clinicopathological characteristics like age, type of tumor, grade, and lymph node status along with estrogen receptor (ER), progesterone receptor (PR), and HER2 status were obtained from the clinical and histopathological records.
Of the 275 cases, 30 tumors were assigned to the HER2-equivocal class by IHC criteria. For these equivocal cases, we carried out fluorescent in situ hybridization (FISH) by established methods described earlier. 16 Out of 30 cases, 16 cases did not meet the FISH criterion of positivity and were classified as HER2 negative; 14 could not be tested for technical reasons and hence remained as HER2 equivocal. There were a total of 145 tumors that were HR+HER2−. Out of the 145 HR+HER2−, 5 blocks did not have enough tissue to assay for gene expression limiting the analysis to 140 tumor specimens. The 140 tumor samples came from 137 patients as three patients had bilateral breast cancer. The median follow-up of these 137 patients is 62 months as of 31 March 2016, with a range between 88 and 37 months. Out of 137 patients, 5 had metastasis at presentation, 4 had no follow-up information, and 1 patient was defaulter for treatment and hence were not considered for survival analysis. Of the 127 HR+HER2− patients, 43 patients were EMT+ and had a median follow-up of 61 months as of 31 March 2016 with a range between 87 and 37 months. The treatment history for the 43 patients is mentioned in Online Resource 2. The details of the sequential exclusion of the tumor samples from the case series (CS) for various analyses are outlined in Online Resource 3.
RNA extraction and complementary DNA synthesis
Total ribonucleic acid (RNA) extraction and complementary DNA (cDNA) synthesis from patient tumor samples were done according to a method established in the lab and published earlier. 23 For cell line experiments, trypsinized (0.05% trypsin/EDTA) cells were pelleted and subjected to digestion at 55°C for 1 h with Tris-EDTA (TE) buffer containing 1% sodium dodecyl sulfate (SDS) and Proteinase K (Qiagen), followed by the same protocol as used for tumor samples.
Quantitative real time PCR
A total of 0.3 × 10⁶ MCF-7 cells were seeded in six-well dishes and allowed to attach overnight followed by serum starvation for 24 h. Next day, cells were treated with TGFβ1 for 48 and 72 h for EMT induction. RNA extraction and cDNA conversion were done. The qRT-PCR experiments for both tumor specimens and cell lines were performed according to the protocol for PCR and data normalization standardized in our lab and published recently.23,24 The results were reported in accordance to the minimum information guidelines for publication of qRT-PCR experiments. 25 For tumors specimens, adjusted relative normalized units (ARNU) were calculated for each of the transcripts measured, by taking the difference between the least value and the corresponding value for every sample. Precaution was taken while designing the primers to ensure they were specific to the intron-spanning region of the genes. Primers for all genes were designed using the software Primer3Plus and manufactured by Eurofins, Bangalore, India. The amplicon sizes ranged from 77 to 119 base pairs. The primer sequences and product length in base pairs (bp) for the genes tested are in Online Resource 4.
IHC
We performed IHC for Ki-67 (marker of proliferation) on each of the tumor blocks selected according to standard procedures.16,23 Primary antibody against Ki-67 (Clone MIB1, 1:100, Cat no. M7240; Dako) was used and secondary antibody (Dako REAL™ EnVision™) incubation was done for 20 min as per the kit instructions, followed by development of the color using diaminobenzidine (DAB; Dako REAL™ EnVision™) for 10 min. Sections were counterstained with hematoxylin and mounted after dehydration in graded alcohol and xylene. Appropriate positive and negative controls were used in all runs. LI for Ki-67 was calculated by counting at least 500 tumor cell nuclei according to the recommendations of Dowsett et al. 26 LI of 14% and above was considered as Ki-67 high as recommended by the St. Gallen Breast Cancer Conference (SG-BCC) guidelines. 27
Western blot
MCF-7 cells were seeded at a concentration of 0.3 × 10⁶ in duplicates and allowed to attach overnight after which they were serum starved for 24 h followed by treatment with TGFβ1 for 72 h. Cells were then treated with 0.5, 1, 1.5 and 2 µM lapatinib for another 48 h; appropriate controls were maintained. Protocol for sodium dodecyl sulfate polyacrylamide gel electrophoresis (SDS-PAGE) and western blot used was as per a method standardized in the lab and published recently. 24 For the detection of integrin αvβ6, the gel was run under non-reducing conditions. The following antibody dilutions were used—anti-E-cadherin (1:100), anti-p-src (Y418; 1:2000), anti–matrix metallopeptidase 9 (MMP9; 1:150,00) anti-αvβ6 (0.5 µg/mL), anti-β actin (1:1000), and secondary horseradish peroxidase (HRP)-conjugated antibodies (1:5000). Quantity One software (Bio-Rad) was used for densitometric analysis. The protein densities were normalized to the density of loading control β actin, and ratios were calculated and plotted as histograms.
Immunofluorescence
A total of 2 × 10⁴ MCF-7 and SK-BR-3 cells were seeded on coverslips and allowed to attach for 24 h. MCF-7 cells were serum starved for 24 h, followed by treatment with TGFβ1, and SK-BR-3 cells were directly treated with 2 µM lapatinib for 72 h. After appropriate treatment, cells were washed with phosphate-buffered saline (PBS) and fixed in 4% paraformaldehyde (PFA) for 10 min at RT. Permeabilization and blocking were done with 2% FBS in 0.3% PBS-Triton X-100 (Calbiochem) for 30 min at RT. Cells were incubated overnight at 4°C with the primary antibodies vimentin (Clone V9, dilution 1 in 10) and αvβ6 (Clone 6.2-A1, dilution 1 in 10,000), respectively. On the following day, the cells were washed thrice with 0.05% PBS-Tween-20 and incubated with the corresponding secondary antibody Alexa Flour 488 chicken anti-mouse IgG (H+L) and Alexa Flour 568 chicken anti-mouse IgG (H+L; Invitrogen) for 1 h in a dark moist chamber. Appropriate controls were maintained. Coverslips were mounted with ProLong Gold Antifade Mountant (Invitrogen) containing 4′,6-diamidino-2-phenylindole (DAPI) and examined under a fluorescent microscope with a 100× oil immersion lens using the Olympus BX51 microscope.
Cell morphology
A total of 2 × 10⁴ cells were seeded in duplicates in 24-well plates and allowed to attach overnight followed by treatment with or without TGFβ1. Change in morphology was monitored and recorded every 24 h over a period of 4 days. Images were captured using Olympus CKX41 microscope at a 20× magnification.
Gelatin zymography
A total of 0.3 × 10⁶ cells were grown in 60 mm dishes and allowed to attach overnight. They were then serum starved for 24 h followed by TGFβ1 treatment for 48 h. Conditioned media from both treated and untreated cells was precipitated in 60% ethanol for 30 min at −20°C, after which media was subjected to centrifugation (Eppendorf 5415R) at 8374g for 20 min to pellet the protein. The protein pellet was re-suspended in lysis buffer containing 50 mM Tris-HCl, 1% Triton-X-100, 0.1% SDS, and 100 mM NaCl at pH8. Protein concentration was estimated using Bradford reagent (Sigma). A volume of 30 µg of protein was loaded and run on a 10% SDS-PAGE containing gelatin as substrate (3 mg/mL) for the MMP9 protease. The gel was then washed twice for 20 min in 2.5% Triton X-100 on a gel rocker followed by a quick wash in the renaturing 1× low-salt collagen buffer (LSCB—0.05 M Tris base, 0.2 M NaCl, and 0.05 M CaCl2) and then incubated in LSCB for 48 h at 37°C for optimum MMP9 activity. Using 0.15% Coomassie brilliant blue (CBB), the gel was stained for 1 h and destained with methanol for 30 min to visualize sites of MMP9 cleavage. Clear bands were observed at the proteolytic sites, and comparison was made between conditioned media obtained from TGFβ1-treated and control cells.28,29
In vitro scratch assay
A total of 0.3 × 10⁶ cells were seeded in 35 mm dishes and allowed to grow into a confluent monolayer, after which they were maintained in a media containing low serum (1% FBS) for 24 h followed by a 48 h treatment with TGFβ1. A scratch was made using a sterile 10 µL micro-pipette tip vertically across the center of the dish, and the width of the wound was measured after washing the cells with PBS to remove debris. Vehicle-treated cells were maintained as control. Migration of cells was captured at 6, 24, and 48 h to monitor closure of the wound using Olympus BX51 microscope at 10× magnification. Wound closure was calculated using the Progress Capture® software.
Transwell matrigel invasion assay
Corning BioCoat matrigel-coated inserts (no. 354480) and uncoated control inserts (no. 354578) (8 µ pore size) were hydrated in a 24-well companion plate with 500 µL of 1% DMEM and incubated overnight at 37°C. A total of 0.3 × 10⁶ MCF-7 cells were seeded and allowed to attach overnight in a 35 mm dish, followed by serum starvation for 24 h. Next day, cells were trypsinized and 5 × 10⁴ cells were seeded in each insert in 500 µL volume of 1% DMEM containing 5 ng/mL TGFβ1 and 5 ng/mL TGFβ1 + 2 µM lapatinib. To each of the bottom wells, 10% FBS in DMEM was added as a chemoattractant. Vehicle-treated control cells were maintained. Cells were allowed to invade for 72 h followed by fixation in 4% PFA and H&E staining. The non-invasive cells were removed using a sterile wet cotton swab. Invasive cells were counted in 10 fields of view under 20× magnification using the Olympus BX51 microscope. The total number of cells was averaged and percentage of invasion was calculated as mean number of cells invading through matrigel-coated inserts/mean number of cells invading through uncoated inserts × 100.
Lapatinib treatment
A total of 0.3 × 10⁶ MCF-7 cells were seeded in six-well dishes and allowed to attach overnight followed by serum starvation for 24 h. Next day, cells were treated with TGFβ1 for 72 h for EMT induction. Following this, 0.5, 1, 1.5, 2, and 4 µM lapatinib was added and cells were incubated for another 48 h. Vehicle-treated control cells were maintained for comparison. qRT-PCR was done to assay for ITGB6 gene expression and western blot was done to assay for integrin αvβ6, p-src (Y418), and MMP9 expression. SK-BR-3 cells, possessing inherently high expression of integrin β6, were directly treated with 2 µM lapatinib or vehicle control and assayed for αvβ6 protein expression by immunofluorescence and western blot.
Inhibition of integrin αvβ6 signaling
A total of 0.2 × 10⁶ MCF-7 cells were seeded and allowed to attach overnight in 24-well dishes. Cells were serum starved for 24 h, following a 72 h treatment with TGFβ1. The function-blocking mouse monoclonal antibody, clone 10D5 against integrin αvβ6 was used at a concentration of 50 µg/mL and cells were incubated for 48 h; control cells were maintained in TGFβ1 alone. Following the treatment, RNA was extracted and converted to cDNA using the protocol mentioned earlier. qRT-PCR was done to assess the expression of EMT genes and a comparison was made between cells treated with TGFβ1 + anti-integrin αvβ6 antibody and TGFβ1 alone.
Statistical analysis
For graphical representations, the data are depicted as mean ± standard deviation or standard error of the mean calculated from three experimental replicates with technical duplicates for all cell line experiments. A paired student’s t-test was done to obtain statistical significance. Descriptive statistics was used for all clinical variables. The distribution of continuous variables was checked for normality and appropriate parametric/non-parametric tests were applied. Disease-free survival was calculated as the time from the date of primary tumor diagnosis to the time when recurrence or metastasis or cancer-related death, whichever occurred earlier, within the follow-up period. Survival data in patients who were alive or dead due to other reasons were censored. Kaplan–Meier curves were plotted and log-rank test was used to calculate the probability of disease-free survival between the two groups considered for analysis. Univariate Cox proportional hazard analysis was used to calculate the hazard ratios. For all tests, a p value of <0.05 was considered to be statistically significant. All statistical analysis was carried out using the software XLSTAT 2015 (Windows) and SPSS software version 18.
Results
Characterization of tumors for the presence of markers of the EMT phenotype in HR+HER2− breast tumors
SNAI2 (a transcription factor) and the integrin β6 (cell-surface integrin) have been linked to EMT-mediated invasion and migration.30,31 We reasoned that a combination of these markers would be enriched only in tumors with activation of EMT. We measured the transcript abundance of these genes in 140 HR+HER2− tumors by qRT-PCR. As with most transcripts, the abundance is distributed over a wide range across the tumors (12–13 CT, approx. 4000–8000 fold). A significant positive correlation was observed between SNAI2 and ITGB6 mRNA levels (r = 0.34; p = 0.00). We then used the mean expression value of these markers to stratify the specimens into groups with higher and lower than average levels. In all, 46 tumors had higher than average of both SNAI2 and ITGB6 and we have considered these tumors to be enriched for EMT (EMT+). When these 46 tumors were compared to the remainder 94 tumors (EMT−), they were not statistically distinguishable using any of the standard clinicopathological variables as shown in Table 1.
Clinical variables of the Nadathur-CS (N = 140) divided into EMT− (N = 94) and EMT+ (N = 46) showed no difference in any of the clinicopathological characteristics between the two groups.

Nx: lymph nodes cannot be evaluated; PR: progesterone receptor; ER: estrogen receptor; EMT: epithelial-to-mesenchymal transition.
Statistical significance obtained by paired student’s t-test/chi-square test shown as p value.
In vitro EMT induction leads to upregulation of EMT master regulators, integrin β6 and higher migratory and invasive phenotype in luminal MCF-7 cells
As stated before,32–34 there is evidence to support the interplay between integrins and growth factor receptors (GFRs) in producing the EMT phenotype. The luminal cell line MCF-7 is known to have significant levels of HER2 transcripts despite having no amplification of the locus and undergoes EMT upon stimulation with TGFβ1. We used this model system to examine the contribution of GFR signaling to EMT. Transcripts levels of critical EMT-associated genes like SNAI1, SNAI2, ZEB1, ZEB2, FN1, CDH1, ACTA2, FOXC2, ZO-1, and SERPINE1 were assayed using qRT-PCR before and after induction with TGFβ1. Genes that showed notable upregulation were the EMT master regulators, SNAI1 and SNAI2; the gene encoding the ECM protein, fibronectin (FN1) and a direct TGFβ1 target gene, SERPINE1 (Figure 1(a)). There was more than 6-fold change in SNAI1 and SNAI2; 30-fold increase in SERPINE1 and a 3-fold increase in FN1 transcript levels 48 h post treatment. Apart from the canonical EMT genes, a significant upregulation (6-fold) of ITGB6 transcript (Figure 1(a)) and αvβ6 protein (Figure 1(b) and (c)) was observed, but there were no alterations in the levels of ITGB1.

Induction of EMT upon TGFβ1 stimulation in MCF-7 cells. (a) EMT genes as expressed by MCF-7 cells pre and post EMT induction. (b) Western blot showing upregulation of integrin αvβ6 protein upon treatment with TGFβ1 for 72 h. (c) Graph depicting the ratio of band intensity calculated for integrin αvβ6 relative to β actin by densitometric analysis using Quantity One software (Bio-Rad). (d) Change in morphology and gain of vimentin in MCF-7 cells 72 h post EMT induction. Images were captured at 100× magnification for immunofluorescence. (e) Western blot showing loss of E-cadherin in MCF-7 cells post treatment; β actin was used as the loading control. (f) Graph depicting the ratio of band intensity calculated for E-cadherin relative to β actin by densitometric analysis. (g) transcript levels of MMP9 in MCF-7 cells after 48 h treatment. (h) Gelatin zymogram showing MMP9 proteolytic activity as clear white band representing enhanced MMP9 activity compared to control. (i) Closure of wound at 48 h in MCF-7 cells post TGFβ1 treatment. Images captured at 10× magnification, scale bar represents 200 µM. (j) Percentage of wound closure calculated as distance migrated by treated and untreated MCF-7 cells.
To see whether the aforementioned findings were accompanied by changes in morphology, we microscopically examined the TGFβ1 treated as well as control MCF-7 cells at multiple time-points for up to 96 h (data shown only for 72 h). A steady loss of epithelial characteristics was observed along with the acquisition of a more mesenchymal-like morphology. By 72 h, cells demonstrated typical mesenchymal features like cell-elongation, loss of polarity, and dispersion from cell clusters (Figure 1(d)). A significant gain of the post-EMT marker vimentin and loss of the cell junction protein E-cadherin were also observed by immunofluorescence (Figure 1(d)) and western blot (Figure 1(e) and (f)), respectively, suggesting the acquisition of mesenchymal features. Transcript levels of E-cadherin were downregulated 4-fold (data not shown).
Furthermore, to evaluate the acquisition of invasive properties associated with EMT, the transcript abundance, and proteolytic activity of a gelatinase, MMP9 (enzyme known to degrade the components of the basement membrane) pre and post TGFβ1 treatment was assayed. There was a 15-fold increase in MMP9 transcript levels post treatment (Figure 1(g)). Gelatin zymography showed sites of proteolytic cleavage as clear white bands at 82 kDa, the site of the latent MMP9 (Figure 1(h)). We also observed a significant upregulation of MMP9 protein after 72 h of TGFβ1 treatment by western blot (Figure 2(e)). These findings confirm the ability of TGFβ1 to upregulate MMP9, an essential component for matrix degradation. Next, we determined the migratory potential of breast cancer cells post treatment by performing an in vitro scratch assay. After TGFβ1 stimulation, the ability of cells to migrate and fill the wound was monitored over 48 h. Cells migrated inwards to close the wound. At 48 h, the wound closure was observed in the treated MCF-7 cells but not in the control (Figure 1(i)). The rate of closure at 48 h in MCF-7 cells post induction was significantly higher with 90% closure compared to 60% in the control.

Treatment of TGFβ1-induced MCF-7 cells with lapatinib and anti-integrin αvβ6 antibody. (a) Dose-dependent downregulation of ITGB6 transcript levels upon lapatinib treatment (*statistically significant by paired student’s t-test). (b) Western blot image showing downregulation of integrin αvβ6 protein upon various doses of lapatinib. (c) Graph depicting the ratio of band intensity calculated for integrin αvβ6 relative to β actin by densitometric analysis. (d) Lapatinib-mediated downregulation of EMT genes and MMP9. (e) Repression of growth factor signaling seen as reduced p-src(Y418) and decreased MMP9 levels; β actin was used as the loading control. Band intensity calculated for (f) p-src (Y418) and (g) MMP9 by densitometric analysis using Quantity One software (Bio-Rad). (h) Graph depicting percentage of invasion obtained by Transwell matrigel invasion assay. (i) Functional blockade of integrin αvβ6 leading to downregulation of EMT markers.
Downregulation of integrin β6 upon lapatinib treatment and functional blockade using anti-integrin αvβ6 antibody
Upregulation of integrin αvβ6 upon EMT induction in MCF-7 cells prompted us to investigate the cross-talk between integrin αvβ6 and growth factor receptors and to examine the consequences of this co-expression on EMT. We have previously shown that integrin αvβ6 mediates metastasis in HER2+ tumors via the Rho-Rac pathway and upregulated MMPs. We found significant expression of both HER2 and EGFR transcripts in MCF-7 cells as previously reported by others (Online Resource 5).35,36 The dual-specificity tyrosine-kinase inhibitor, lapatinib, was used to abrogate downstream HER2 and EGFR signaling, and we observed a significant dose-dependent downregulation of ITGB6 at the transcript and protein levels in MCF-7 cells (Figure 2(a)–(c)). Apart from integrin β6, a significant downregulation of EMT genes (SNAI1, SNAI2, and PAI1) and MMP9 transcript was observed in TGFβ1-induced MCF-7 cells treated with lapatinib compared to TGFβ1 alone (Figure 2(d)). There was also a reduction in the level of p-src (Y418; an adaptor molecule leading to phosphorylation of kinase domain of GFRs)37,38 and MMP9 proteins shown by western blot in Figure 2(e)–(g).
In addition, lapatinib treatment was able to effectively reduce the invasive behavior of TGFβ1-treated MCF-7 cells in transwell matrigel invasion assay. We observed a 25% reduction in the proportion of MCF-7 cells invading through matrigel-coated inserts after dual treatment with TGFβ1 and lapatinib compared to cells treated with TGFβ1 alone and vehicle-treated cells (Figure 2(h)). We also confirmed lapatinib mediated downregulation of integrin αvβ6 in SK-BR-3, the HER2-amplified cell line (Online Resource 6).
To confirm the contribution made by downstream signaling via integrin αvβ6 to the EMT process in MCF-7 cells, we used a function-blocking monoclonal anti-integrin αvβ6 antibody (clone 10D5) at 50 µg/mL concentration and treated TGFβ1-induced cells for 48 h with the antibody. We assayed for critical EMT genes by qRT-PCR assay and found a significant downregulation of EMT genes—SNAIL (4.5-fold), SLUG (4-fold), and MMP9 (3.5-fold) in cells treated with TGFβ1 + anti-integrin αvβ6 compared to TGFβ1 alone (Figure 2(i)).
Coupling of integrins with growth factor receptors during EMT is associated with poor prognosis in luminal breast tumors
To look for the possibility of similar mechanisms in human tumors, we measured the expression of HER2, EGFR and HER3 transcripts in our HR+HER2− subset of tumors and found a statistically significant positive correlation between ITGB6 and HER2 transcripts (Pearson’s correlation coefficient r = 0.19 and p = 0.03) as well as with EGFR transcript (r = 0.37, p = 0.00); however, there was no correlation with HER3 transcript levels (r = 0.08, p = 0.3). We used the average transcript levels of HER2 and EGFR (average GFR) and divided the 46 EMT+ tumors into two GFR groups. Tumors with values of average GFR in the top quartile (N = 19) were termed EMT+ GFR-High group, and the rest (N = 27) as the EMT+ GFR-Low group. Of the 46 patients with tumors, 3 patients had metastasis at presentation and were removed from the survival analysis, limiting the patients to 43 with complete follow-up and outcome information. Kaplan–Meier survival analysis of the two groups showed a significant difference in disease-free survival (log rank, p = 0.03) with a mean survival time of 49 months in the EMT+ GFR-High group versus 67 months in the EMT+ GFR-Low group. This finding supports the idea of higher GFR expression increasing the risk of metastasis in luminal tumors that are enriched for markers of EMT (Figure 3).

Kaplan–Meier survival analysis of EMT+ tumors coupled with GFR expression.
A comparative analysis of the classical clinicopathological variables like age, stage, tumor size, or Ki-67 expression showed no statistical difference between the two classes suggesting that the molecular parameters used in this analysis were distributed independent of the classical variables (data shown in Table 2). Interestingly, both grade and Ki-67 levels that are the best correlates of proliferation were higher in the EMT+ GFR-Low group indicating that the measures used to separate these groups are in fact independent of proliferation.
Clinicopathological characteristics of EMT+ tumors divided based on the top quartile expression of growth factor receptors into GFR-High (N = 17) and GFR-Low (N = 26).
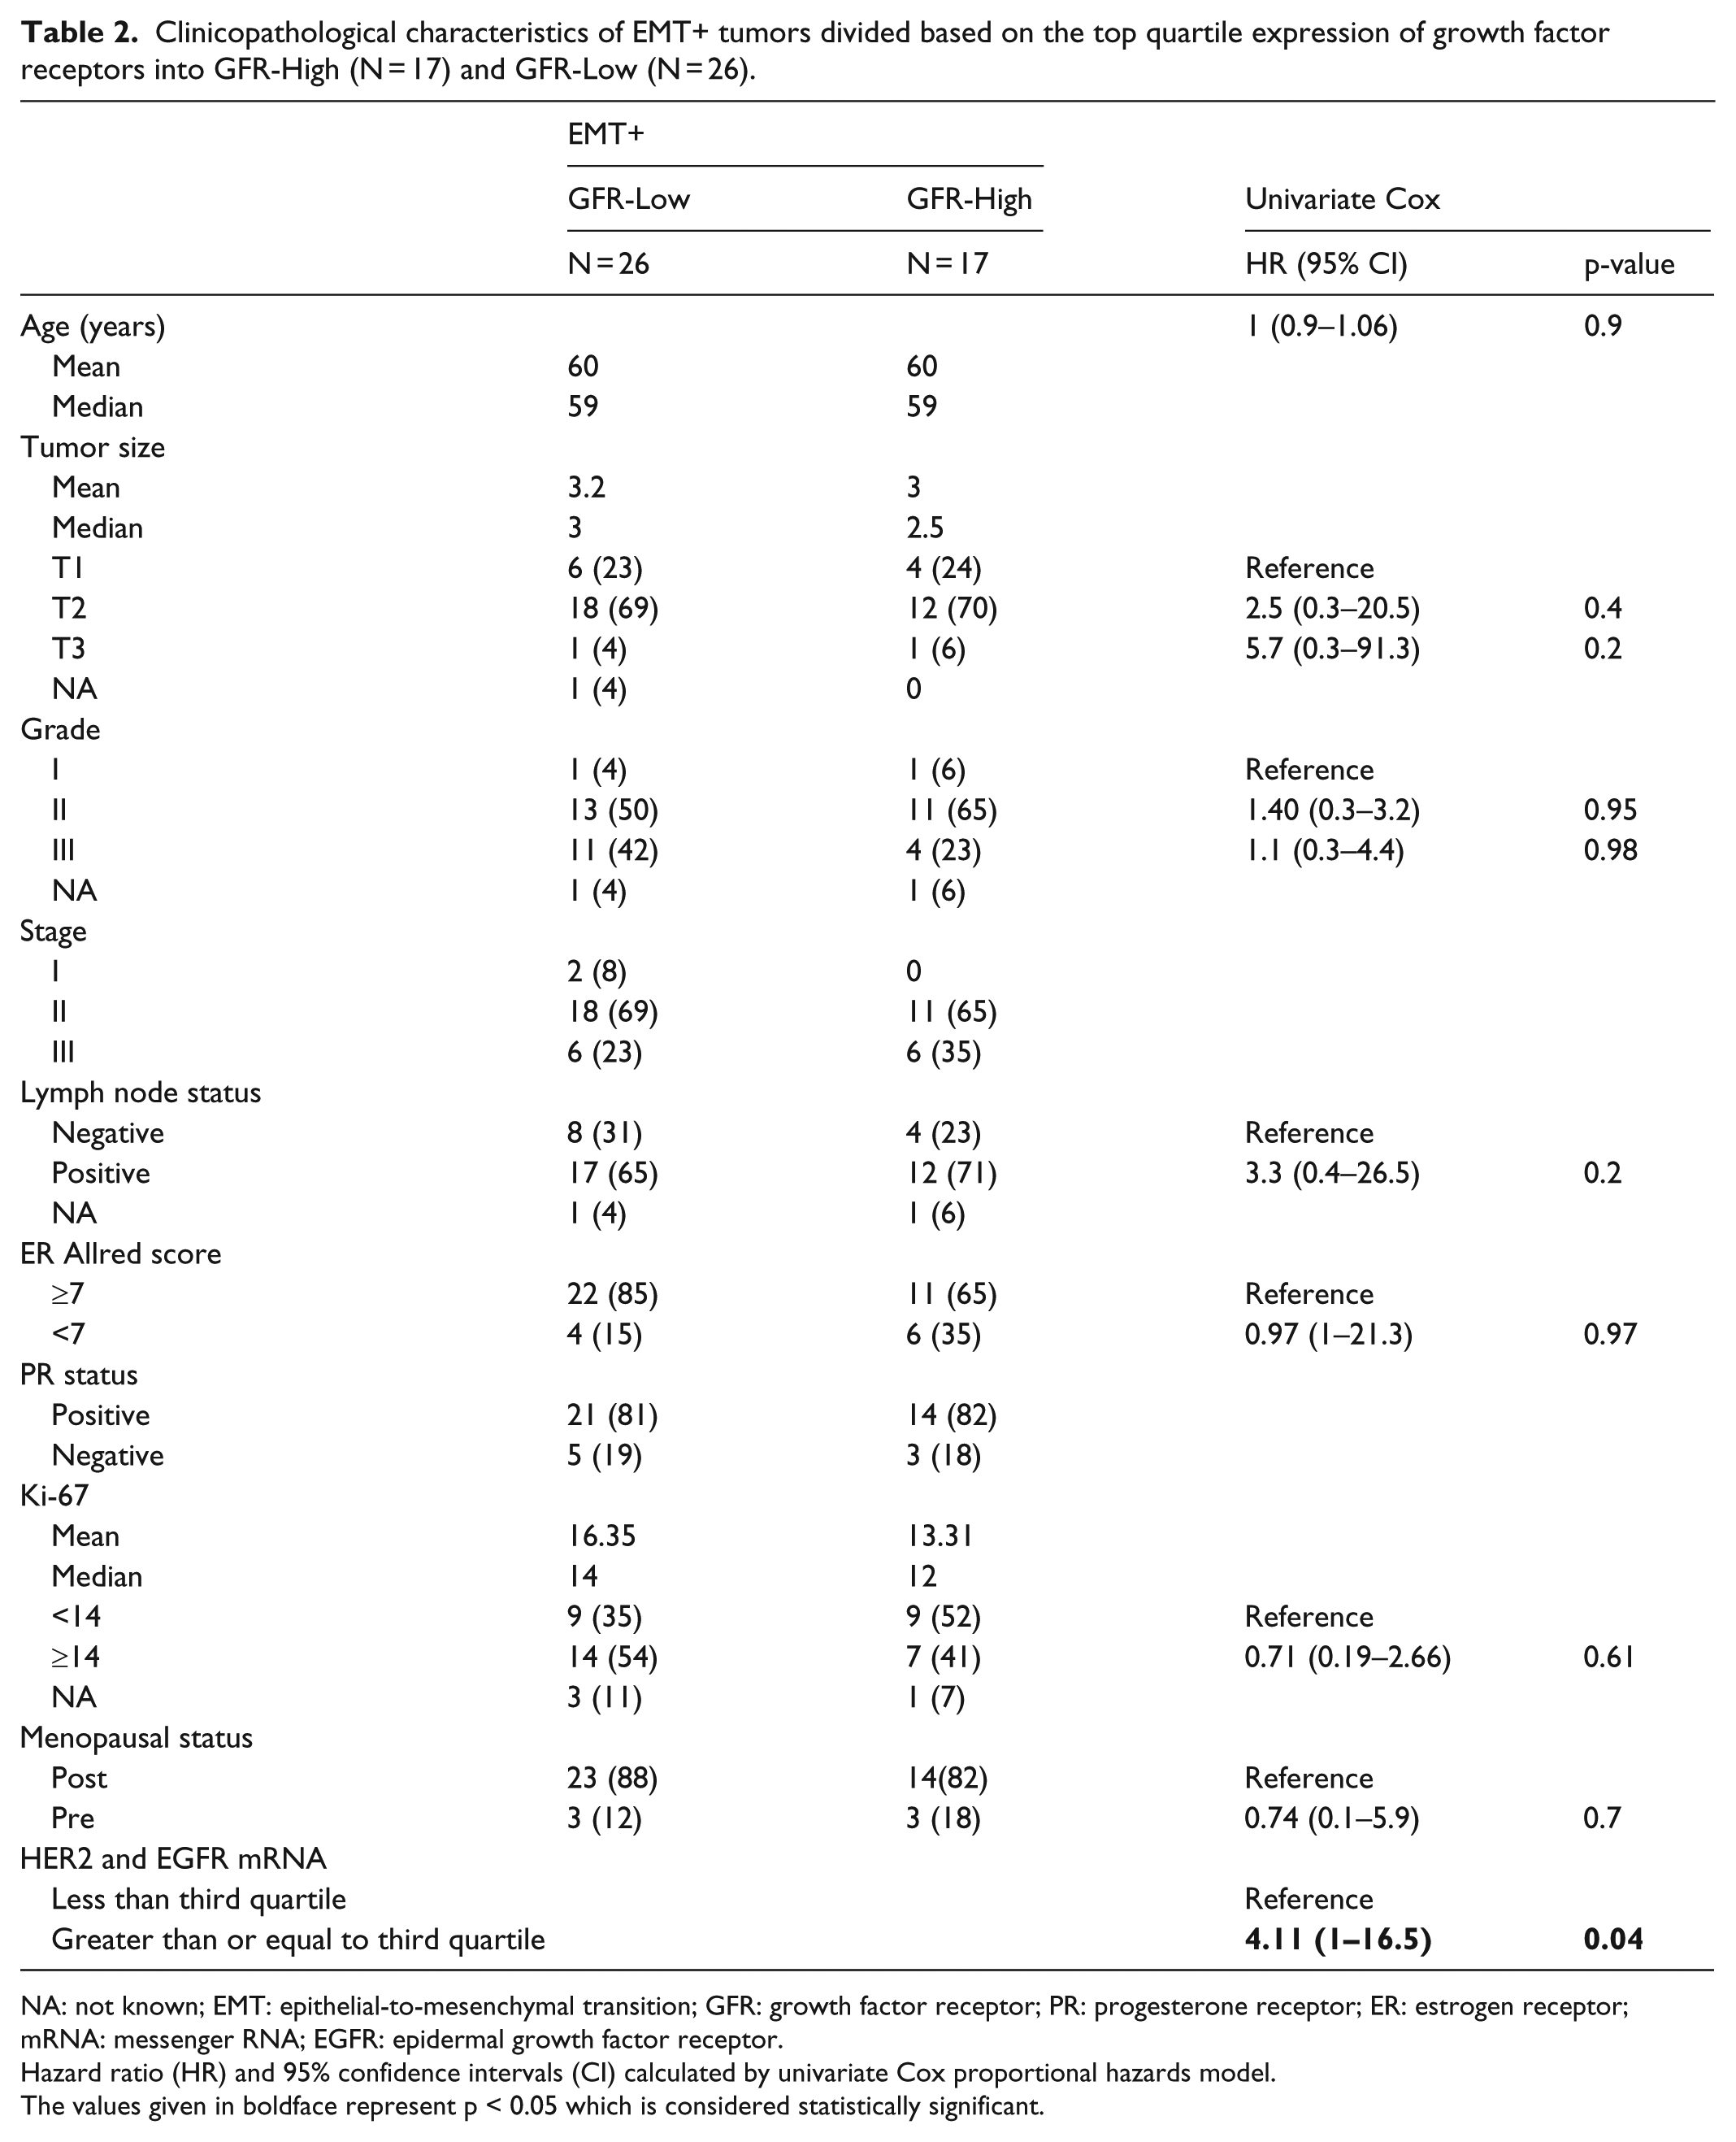
NA: not known; EMT: epithelial-to-mesenchymal transition; GFR: growth factor receptor; PR: progesterone receptor; ER: estrogen receptor; mRNA: messenger RNA; EGFR: epidermal growth factor receptor.
Hazard ratio (HR) and 95% confidence intervals (CI) calculated by univariate Cox proportional hazards model.
The values given in boldface represent p < 0.05 which is considered statistically significant.
To calculate the hazard ratio of higher GFR expression in EMT+ tumors, we performed a univariate Cox proportional hazard analysis and found that high GFR expression alone carried a significantly high hazard ratio (HR = 4.11, p = 0.04). None of the other clinicopathological characteristics included in the analysis had any significant risk (data shown in Table 2).
Discussion
Though there is growing evidence for genes that are critical to organ-specific metastasis,39,40 the detection of these markers in human primary tumors is not part of current routine patient management protocols. In HR+HER2− breast cancers, the subtype with the best prognosis, the only proven non-IHC molecular-diagnostic approach is the use of tests of gene expression like Oncotype DX to identify patients who can be spared chemotherapy. The markers measured in these tests are mostly genes linked to proliferation and cell survival.41,42 We and others have recently provided support for the prognostic utility of ITGB6 in the HER2+ subtype of breast cancers.16,17 This observation builds on a growing body of evidence that suggests the co-operative function of cell-surface growth factor receptor tyrosine kinases (RTK) and specific sets of integrins that are aberrantly expressed in cancer epithelia.14,15 In fact, the six-gene signature of breast cancer metastasis to lung includes ITGB8 as one of the candidates. 43 In this article, we chose to examine the interplay between RTKs and ITGB6 in a tumor type that has approximately 7-fold lesser expression of ITGB6 and an order of magnitude lesser levels of HER2 transcripts. Tumors enriched for the markers of EMT and in the top quartile of GFR expression had a decreased event-free survival. Interestingly, both the accepted measures of proliferation, grade and Ki-67 LI, were higher in the group with EMT+ GFR-Low—the group with higher survival. This suggests that in a very small subset of patients (approximately 10% of Luminal HER2−), the presence of GFRs in a background of EMT can increase the probability of metastasis independent of the rate of proliferation.
The heterogeneity of clinically HER2+ tumors is now well accepted though a vexing reality. 44 The presence of varying levels of transcripts of the ErbB family members in breast tumors and their associations with response to therapy and clinical outcomes is now supported by convincing data.45–47 We have examined the consequences of this detectable, albeit low transcript level of two of these ErbB genes in the context of EMT. The separation of the fates of women with high levels of these markers compared to the rest suggests a possible involvement in leading to metastases. Recognizing the fact that these correlations in small sets of tumors would not be persuasive standalone, we used the established luminal cell line, MCF-7, to experimentally manipulate these pathways. MCF-7 cells have detectable transcripts of HER2 though there is no amplification of this locus. 21 In fact, we and others have shown that MCF-7 cells have 1+ levels of HER2 protein by immunofluorescence depending on their passage number.22,48,49 A dose-dependent decrease in the TGFβ1-induced EMT and integrin αvβ6 in response to treatment with the dual-specificity tyrosine-kinase inhibitor (TKI) lapatinib provides a mechanistic basis for the involvement of GFRs in the generation of EMT in luminal cells. This could suggest a possible direct regulation of integrin β6 by HER2 and EGFR signaling or an indirect mechanism mediated as a result of GFR activity which may block integrin β6-mediated EMT. Further experimental studies examining the downstream mechanism of interaction between integrins and GFRs need to be performed to clarify the matter. Recently, data from a large trial have indicated a clinical benefit from the use of lapatinib in the setting of HR+HER2− tumors with metastatic breast cancer and in targeting endocrine-therapy-resistant tumor cells. 50
It needs to be noted that close to 80% of the women used for this analysis are post menopausal. This is not representative of the general trend seen in large clinical centers in this country. The tumors in our series had a median size of 3 cm, two-thirds were lymph-node positive, and a third were late stage. These characteristics suggest a larger proportion at a later stage of clinical progression than that encountered in most Western CS.
Though we started this study with a set of 250 patients who had all of the molecular and clinical data that are necessary for survival analysis, we were down to 43 patients by the time we had worked our way down to HR+HER2−, EMT+ group. Surely, these associations need to be confirmed in a larger dataset. Reassuringly, the proportion of patients with this expression pattern in the The Cancer Genome Atlas (TCGA) Nature 2012 dataset was approximately the same as that observed here (Online Resource 7), suggesting that activation of these biological pathways at detectable levels is restricted to a small subset of patients. The additional limitation arises from not having protein expression data for integrin αvβ6 in this CS of patient tumors; however, in our recent publication, 16 we showed a good concordance between the integrin αvβ6 protein expression and ITGB6 transcript levels (area under the curve (AUC) = 0.8), using material from another CS (Kidwai Memorial Institute of Oncology (KMIO)-CS).
In conclusion, we believe that the concerted mechanism that operates between integrins and growth factor receptors might mediate metastatic progression in a small though significant subgroup of HR+HER2− patients. Not only does this study suggest that tyrosine-kinase inhibitor therapy be useful in these select patients, but targeting integrin function emerges as an additional option.
Footnotes
Acknowledgements
The authors thank the University Grants Commission for awarding senior research fellowship to M.G.N. The authors extend gratitude to Dr Jose Remacle, Rtd. Professor, University of Namur, Belgium, for his critical review of the manuscript and Dr Tinku Sarah Thomas, Department of Epidemiology and Biostatistics, St. John’s Research Institute, for her guidance with statistical analysis. The authors also thank Dr Shelia M Violette and Dr Paul Weinreb, Biogen Idec Inc., MA, USA, for their kind gift of integrin αvβ6 antibody (Clone 6.2-A1). In addition, the authors would like to thank Dr Geetashree Mukherjee and Dr Rekha V Kumar, Kidwai Medical Institute of Oncology, Bangalore, India, for providing the tumor specimens for the KMIO-CS. K.D. and R.A. have equally contributed to this work.
Compliance with ethical standards
All procedures performed in the studies involving human participants were in accordance with the ethical standards of both St. John’s Medical College Hospital and Rangadore Memorial Hospital. A written informed consent for utilization of clinical data was obtained from all enrolled patients.
Declaration of conflicting interests
The author(s) declared no potential conflicts of interest with respect to the research, authorship, and/or publication of this article.
Funding
T.S.S. is grateful to Nadathur Estates and The Bagaria Education Trust for their support of all the breast cancer research activities at SJRI since 2008. Part of the project was funded by Department of Biotechnology for the DBT-BBI grant (No. BT/PR13926/MED/31/97/2010) and DBT-DISC grant (No. BT/IN/Denmark/01/LSS/2014) to T.S.S.
References
Supplementary Material
Please find the following supplemental material available below.
For Open Access articles published under a Creative Commons License, all supplemental material carries the same license as the article it is associated with.
For non-Open Access articles published, all supplemental material carries a non-exclusive license, and permission requests for re-use of supplemental material or any part of supplemental material shall be sent directly to the copyright owner as specified in the copyright notice associated with the article.