
Abstract
Glioblastoma is the most malignant and invasive brain tumor with extremely poor prognosis. p53-inducible gene 3, a downstream molecule of the tumor suppressor p53, has been found involved in apoptosis and oxidative stress response. However, the functions of p53-inducible gene 3(PIG3) in cancer are far from clear including glioblastoma. In this study, we found that p53-inducible gene 3 expression was suppressed in glioblastoma tissues compared with normal tissues. And the expression of p53-inducible gene 3 was significantly associated with the World Health Organization grade. Patients with high p53-inducible gene 3 expression have a significantly longer median survival time (15 months) than those with low p53-inducible gene 3 expression (8 months). According to Cox regression analysis, p53-inducible gene 3 was an independent prognostic factor with multivariate hazard ratio of 0.578 (95% confidence interval, 0.352–0.947; p = 0.030) for overall survival. Additionally, gain and loss of function experiments showed that knockdown of p53-inducible gene 3 significantly increased the proliferation and invasion ability of glioblastoma cells while overexpression of p53-inducible gene 3 inhibited the proliferation and invasion ability. The results of in vivo glioblastoma models further confirmed that p53-inducible gene 3 suppression promoted glioblastoma progression. Altogether, our data suggest that high expression of p53-inducible gene 3 is significant for glioblastoma inhibition and p53-inducible gene 3 independently indicates good prognosis in patients, which might be a novel prognostic biomarker or potential therapeutic target in glioblastoma.
Introduction
Glioma is the most common primary brain tumors which account for almost 35% of intrinsic tumors of central nervous system.1,2 Among the gliomas, glioblastoma multiforme (GBM) is the most malignant and prevalent phenotypes of glioma with the worst prognosis. Despite the progresses in neurosurgery, radiotherapy, and chemotherapy, the mean survival time of GBM patients is merely 12–15 months from the time of diagnosis. 3 Since the extremely aggressive and highly infiltrative nature of GBM accounts for the major challenge in the treatment of GBM, novel prognostic markers and targets of therapeutic response are urgently needed.
Degradation of extracellular matrix (ECM) is the key step for infiltration, invasion, and growth in GBM.4,5 Proteases including matrix metalloproteinases (MMPs) and cathepsins are responsible for ECM degradation. 5 Many studies have reported implication of matrix metalloproteinases (MMPs) in the degradation and increased expressions of several MMPs in cancer cells compared to their normal cell counterparts, including glioma cells.6–8
The p53-inducible gene 3 (PIG3), one of the p53-inducible genes, is highly homologous to oxidoreductases, suggesting its function in generating reactive oxygen species (ROS) and p53-initiated apoptosis.9,10 In recent years, PIG3 has been found to regulate cell proliferation, genotoxic and oxidative stress, and reversible growth arrest suggestive of tumor suppressor function.11–15 Loss of PIG3 promoted protein synthesis via hypoxia-inducible factor (HIF)-1α in renal cell carcinoma cells and suppression of PIG3 was related to vascular endothelial growth factor (VEGF) secretion and cell migration. 16 However, PIG3 also plays oncogenic function in papillary thyroid cancer via PI3K/AKT pathway. 17 Since the different functions of PIG3 are found in cancer, the precise pathophysiological function of PIG3 in cancer is complicated and remains to be determined including GBM. Moreover, the clinical significance of PIG3 in glioma is still unclear.
In this study, we investigated the expression of PIG3 in a cohort of 104 glioma specimens and analyzed correlations of the protein expression with patient characteristics, clinical and pathological variables as well as patient survival. We further investigated the functional impact of PIG3 on GBM progression in a series of in vitro and in vivo assays. We also explored the molecular events that occur downstream of PIG3 in GBM. These data provide novel insights into the role of PIG3 in GBM progression and identify a potential therapeutic target in patients with GBM.
Materials and methods
Patients and tissue samples
Our study was approved by the Ethics Committee of the Yanbian University Hospital. Written consent was obtained from patients or guardians on behalf of the minor enrolled in the study. A total of 104 patients with histologically confirmed glioma at Yanbian University Hospital between January 2008 and December 2014 were recruited for this study. Their diagnoses were independently re-reviewed by two pathologists, classified by World Health Organization (WHO) criteria. All cases were classified as shown in Table 1 including 27 low-grade gliomas (grade I + II) and 77 high-grade gliomas (grade III + IV). The mean age of patients at diagnosis was 49.38 ± 15.87 years (range, 8–76 years), with 53 male and 51 female. Follow-up data were available in 68 patients (range, 0.03–59 months; mean, 14.74 ± 13.13 months).
Association of PIG3 expression with clinicopathological variables in gliomas.

PIG3: p53-inducible gene 3; WHO: World Health Organization.
Western blot
To analyze the expression of PIG3, Western blot assays were performed using the following primary antibodies: rabbit anti-human PIG3 (sc-16325, Santa Cruz, USA; 1:1000) and mouse anti-Actin (Millipore, Billerica, MA; 1:10,000). Briefly, tissues were lysed with radioimmunoprecipitation assay (RIPA) buffer (50 mM Tris–HCl (pH 7.5), 150 mM NaCl, 1% Triton X-100, 0.5% Na-deoxycholate) containing protease inhibitors (Roche, CompleteMini); 20–30 µg samples of the lysates were separated on 8%–12% sodium dodecyl sulfate–polyacrylamide gel electrophoresis (SDS-PAGE) gels and transferred to polyvinylidene difluoride (PVDF) membranes. The membranes were incubated with primary antibodies overnight at 4°C. The primary antibody incubation was followed by incubation with horseradish peroxidase–conjugated secondary antibody. The bound antibodies were detected using an ECL kit (Pierce, PI32209).
Immunohistochemistry
A total of 104 blocks of tissue microarray containing glioma tissues were constructed using Microarrayer. Serial 4-µm sections were obtained from each block, with the first slide being stained for H&E to confirm pathologic diagnosis, and the subsequent slides stained for further immunohistochemistry.
Tissue microarray slides were routinely deparaffinized and rehydrated. The monoclonal antibody against PIG3 (1:100 dilutions, sc-16325, Santa Cruz) was used as primary antibody. For antigen retrieval, the slides were heated at 98°C in a citrate buffer (pH 9.0) for a total of 20 min and cooled naturally to room temperature. Sections were incubated in 0.3% hydrogen peroxide for 20 min to inactivate endogenous peroxides. The sections were blocked with 5% normal horse serum in phosphate-buffered saline (PBS) for 30 min and then incubated with the primary antibody overnight at 4°C and then stained using a highly sensitive streptavidin–biotin–peroxidase detection system and counterstained with hematoxylin. A negative control (NC) was also incorporated using pre-immune IgG instead of the primary antibody.
Evaluation of immunohistochemistry
Two sections per GBM specimen were evaluated by two pathologists independently. Immunoreactive staining was characterized quantitatively according to the percentage of positive cells and staining intensity without prior knowledge of any of the clinicopathological information. We assigned the following proportion scores: 0 if 0% of the tumor cells showed positive staining, 1 if 0%–10% stained, 2 if 11%–50% stained, 3 if 51%–75% stained, and 4 if 75%–100% stained. We rated the intensity of staining on a scale of 0–3: 0, negative; 1, weak; 2, moderate; and 3, strong. We then combined the proportion and intensity scores to obtain a total score (range, 0–12). All patients were designated into negative (score 0), low (score 1–4), moderate (score 5–8), and high (score 9–12) groups based on PIG3 expression.
Lentiviral vector mediated PIG3 knockdown
PIG3 shRNA sequences were 5′-ccggatggctggagctatt-3′ (PIG3-KD1) and 5′-tgttcaggctggagactat-3′ (PIG3-KD2). After 48 h, the knockdown efficiency was confirmed via quantitative real-time polymerase chain reaction (qRT-PCR) and Western blot.
Lentiviral vectors for human PIG3-shRNA carrying a green fluorescent protein (GFP) sequence were constructed by Hanyin Co. (Shanghai, China). The recombinant PIG3 knockdown lentivirus and the NC lentivirus (GFP-lentivirus; Hanyin Co.) were prepared and titered to 109 transfection unit (TU)/mL. To obtain the stable PIG3-knockdown cell line, A172 cells were seeded in six-well dishes at a density of 2 × 10⁵ cells per well. The cells were then infected with the same titer virus with 8 µg/mL polybrene on the following day. Approximately 72 h after viral infection, GFP expression was confirmed under a fluorescence microscope, and the culture medium was replaced with selection medium containing 4 µg/mL puromycin. The cells were then cultured for at least 14 days. The puromycin-resistant cell clones were isolated, amplified in medium containing 2 µg/mL puromycin for 7–9 days, and transferred to a medium without puromycin. The clones were designated as PIG3-KD or NC cells.
Retrovirus-mediated gene expression
FLAG-tagged PIG3 were cloned into pMSCV-IRES-GFP vector. For overexpression of PIG3, U87-MG cells were transfected by viral supernatant from 293T cells transfected with PIG3 or control vector (2 × 10⁵ TU per 5 × 10⁵ cell). The clones were designated as PIG3-OE or NC cells.
Colony formation assay
A172 and U87-MG cells with or without PIG3 knockdown or overexpression were examined. Briefly, 1 mL of 0.8% agar (low melting point agarose) was added into each well (6-well plate), allowing to set as base agar. Then, cells were trypsinized and counted (500 cells/well; 0.5 mL).For plating, add 0.5 mL of pre-warmed Dulbecco’s Modified Eagle Medium (DMEM) with 20% fetal bovine serum (FBS) and 0.5 mL of 0.8% agar to tube with cells. Mix gently and add 1 mL to each replicate in triplicate. Incubate assay at 37°C in humidified incubator for 10–14 days. The wells were stained with 1 mL of 0.005% Crystal violet for 1 h before counting the colonies under a dissecting microscope.
Matrigel-Transwell assay
Cells were then plated on the top chamber of Transwell assay inserts (Millipore) with a Matrigel-coated membrane containing 8-µm pores in 200 mL of serum-free Roswell Park Memorial Institute (RPMI) 1640 medium. The assays were conducted in triplicate. The inserts were then placed into the bottom chamber of a 24-well plate containing RPMI 1640 with 10% FBS as a chemoattractant. After 24 h, the top layer of the insert was scrubbed with a sterile cotton swab to remove any remaining cells. The invading cells on the bottom surface were stained with 0.1% Crystal violet, examined, counted, and imaged using digital microscopy. The number of cells in five random fields of each chamber was counted, and an average number of cells were calculated.
Xenograft animal model
US National Institutes of Health and institutional guidelines for animal welfare and experimental conduct were followed. The animal study was approved by the Institutional Animal Care and Use Committee of Yanbian University. U87-MG cells with or without PIG3 overexpression were implanted into the anesthetized 6-week-old athymic nude mice subcutaneously using a small animal stereotactic frame (David Kopf Instruments). Tumor size and weight were monitored.
Statistical analysis
Survival was calculated starting from the date of surgery to the date of death or last follow-up. Survival curves for PIG3 were plotted using the Kaplan–Meier method and compared using the log-rank test. Cox proportional hazard models were used for univariate and multivariate analyses to test clinical features for their associations with overall survival (OS). In the multivariate Cox model, variables with p < 0.1 from the univariate model were included. In addition to PIG3 expression, the following variables were considered: age, gender, grading, and tumor location. Median time and hazard ratio (HR) were shown with 95% confidence interval (CI). All statistical analyses were performed using SPSS for Windows v.17.0 (SPSS, Chicago, IL). All results were considered significant at two-sided p-value <0.05.
Results
Expression of PIG3 in human GBM tissues
The expression of PIG3 in freshly collected GBM tissues (n = 5) and normal brain tissues (n = 5) was analyzed by Western blot. As shown in Figure 1, expression of PIG3 was much lower in GBM compared to normal tissues (Figure 1(a)). Furthermore, we analyzed the expression of PIG3 in 104 patients of gliomas using immunostaining analysis. Representative expression patterns in glioma samples were shown in Figure 1(b). The staining of PIG3 revealed both nuclear and cytoplasmic localization in glioma tissues (Figure 1(b)).
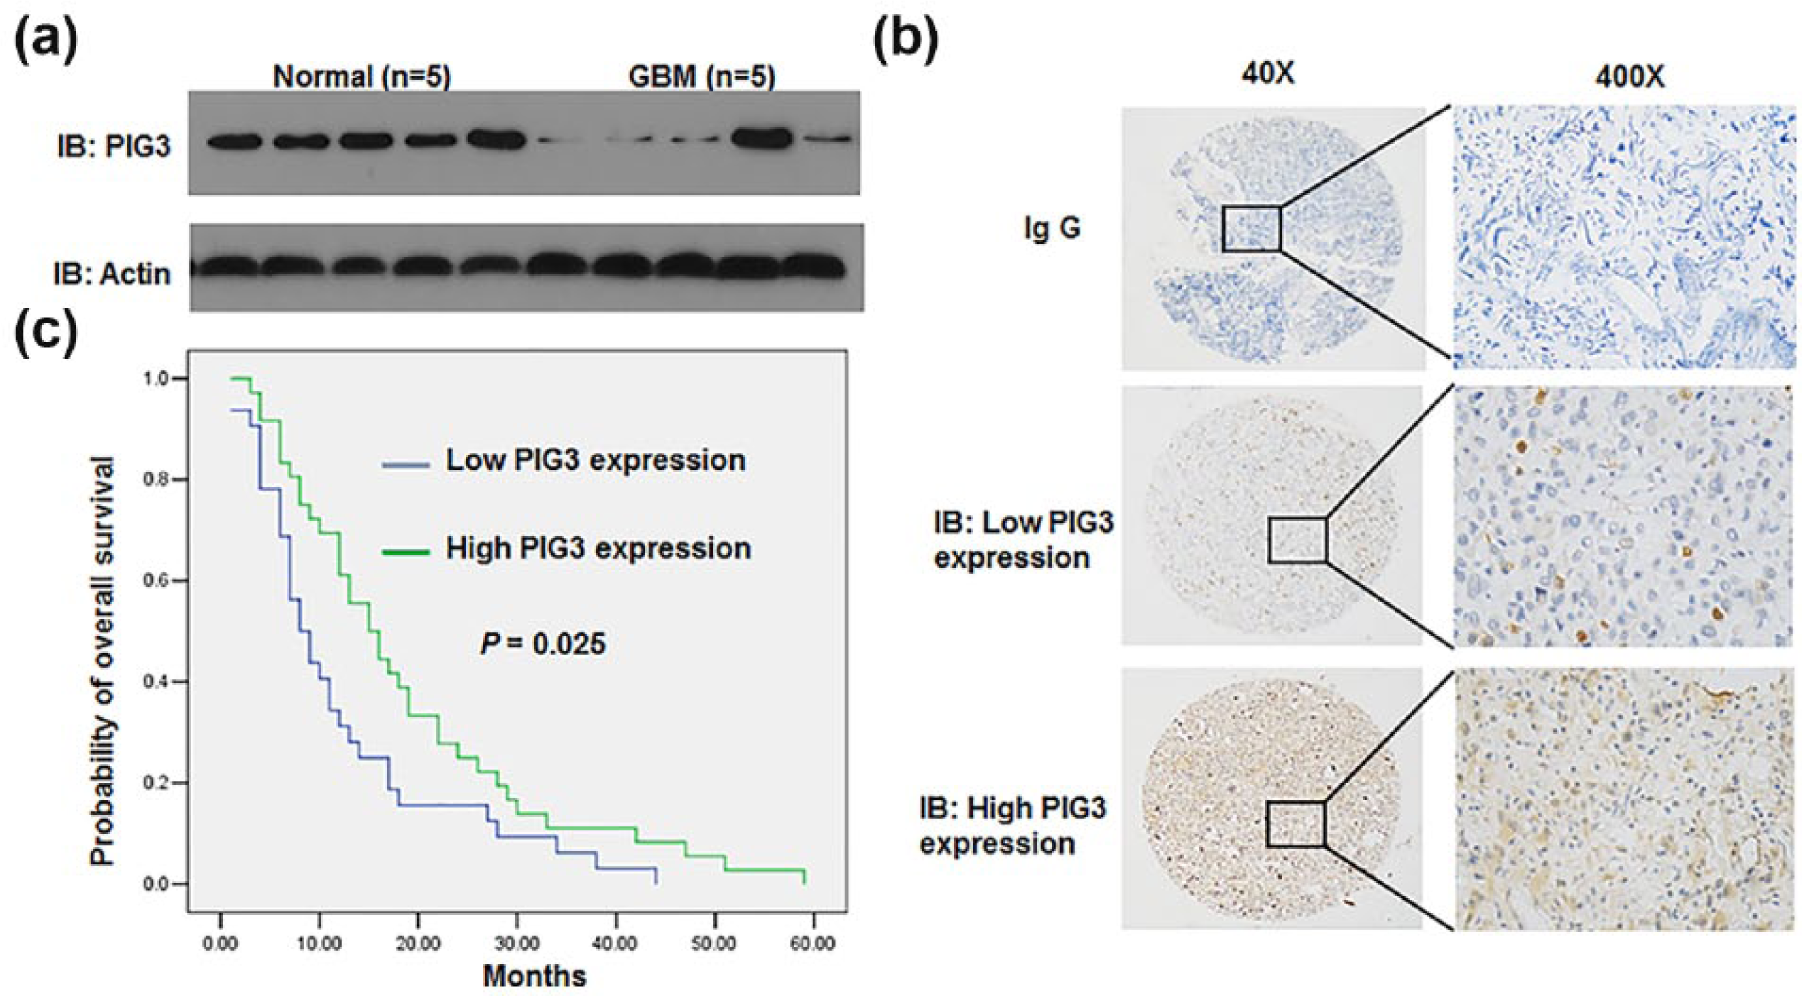
Low expression of PIG3 in glioma is associated with poor prognosis. (a) Western blot analysis of PIG3 in fresh glioma tissues (n = 5) and normal control (n = 5). The experiment has been repeated three times. (b) Immunohistochemical (IHC) staining with antibody to PIG3 was performed on 104 gliomas specimens. Images of representative staining are shown. Magnification: ×40, ×400. Representative cases presenting low and high PIG3 staining in glioma tissues. (c) Kaplan–Meier curves of PIG3 expression in tumor tissues in relation to overall survival (p = 0.000).
Relationship between PIG3 expression and the clinicopathological features of glioma patients
According to the expression of PIG3 in glioma samples, all cases were distributed into two groups: low PIG3 expression group (n = 48) and high PIG3 expression group (n = 56; Figure 1(b) and Table 1). Following the evaluation of immunohistochemical staining, PIG3 level in high-grade cases was significantly lower than in low-grade cases (p = 0.037, Table 1). The expression of PIG3 in glioma tissues showed strong correlation with WHO grades, although no associations were found between PIG3 expression and other clinicopathological features (Table 1).
PIG3 expression and patients’ prognosis
To evaluate the association of PIG3 expression with patients’ prognosis, gliomas were further divided into the high and low PIG3 expression group. A log-rank test and Kaplan–Meier analysis were introduced to assess the effect of PIG3 expression on the patient’s survival. Patients with low level of PIG3 expression in tumor tissues showed significantly shorter OS than patients with high PIG3 expression (n = 68, p = 0.025, Figure 1(c) and Table 2). As shown in Table 2, the median survival time of patients with low PIG3 expression was 8 months (n = 32, 95% CI: 5.228–10.772), whereas the median survival time of patients with high PIG3 expression was 15 months (n = 36, 95% CI: 10.59–19.41). The log-rank test (univariate analysis) revealed that patients with high expression had a significantly longer OS time (χ 2 = 5.042, p = 0.025; Table 2).
Median for survival time with 95% CI and the log-rank test.

PIG3: p53-inducible gene 3; CI: confidence interval.
Furthermore, multivariate Cox regression analysis was also performed to explore whether PIG3 was an independent prognostic factor for patient survival. As shown in Table 3, PIG3 expression and glioma WHO grades were identified as independent prognosis factors (PIG3: HR = 0.578, 95% CI: 0.352–0.947, p = 0.030; WHO grades: HR = 2.107, 95% CI: 1.063–4.179, p = 0.033) instead of age (HR = 1.328, 95% CI: 0.767–2.299, p = 0.311).
Univariate analysis and multivariate analysis of OS for the studied glioma patients.
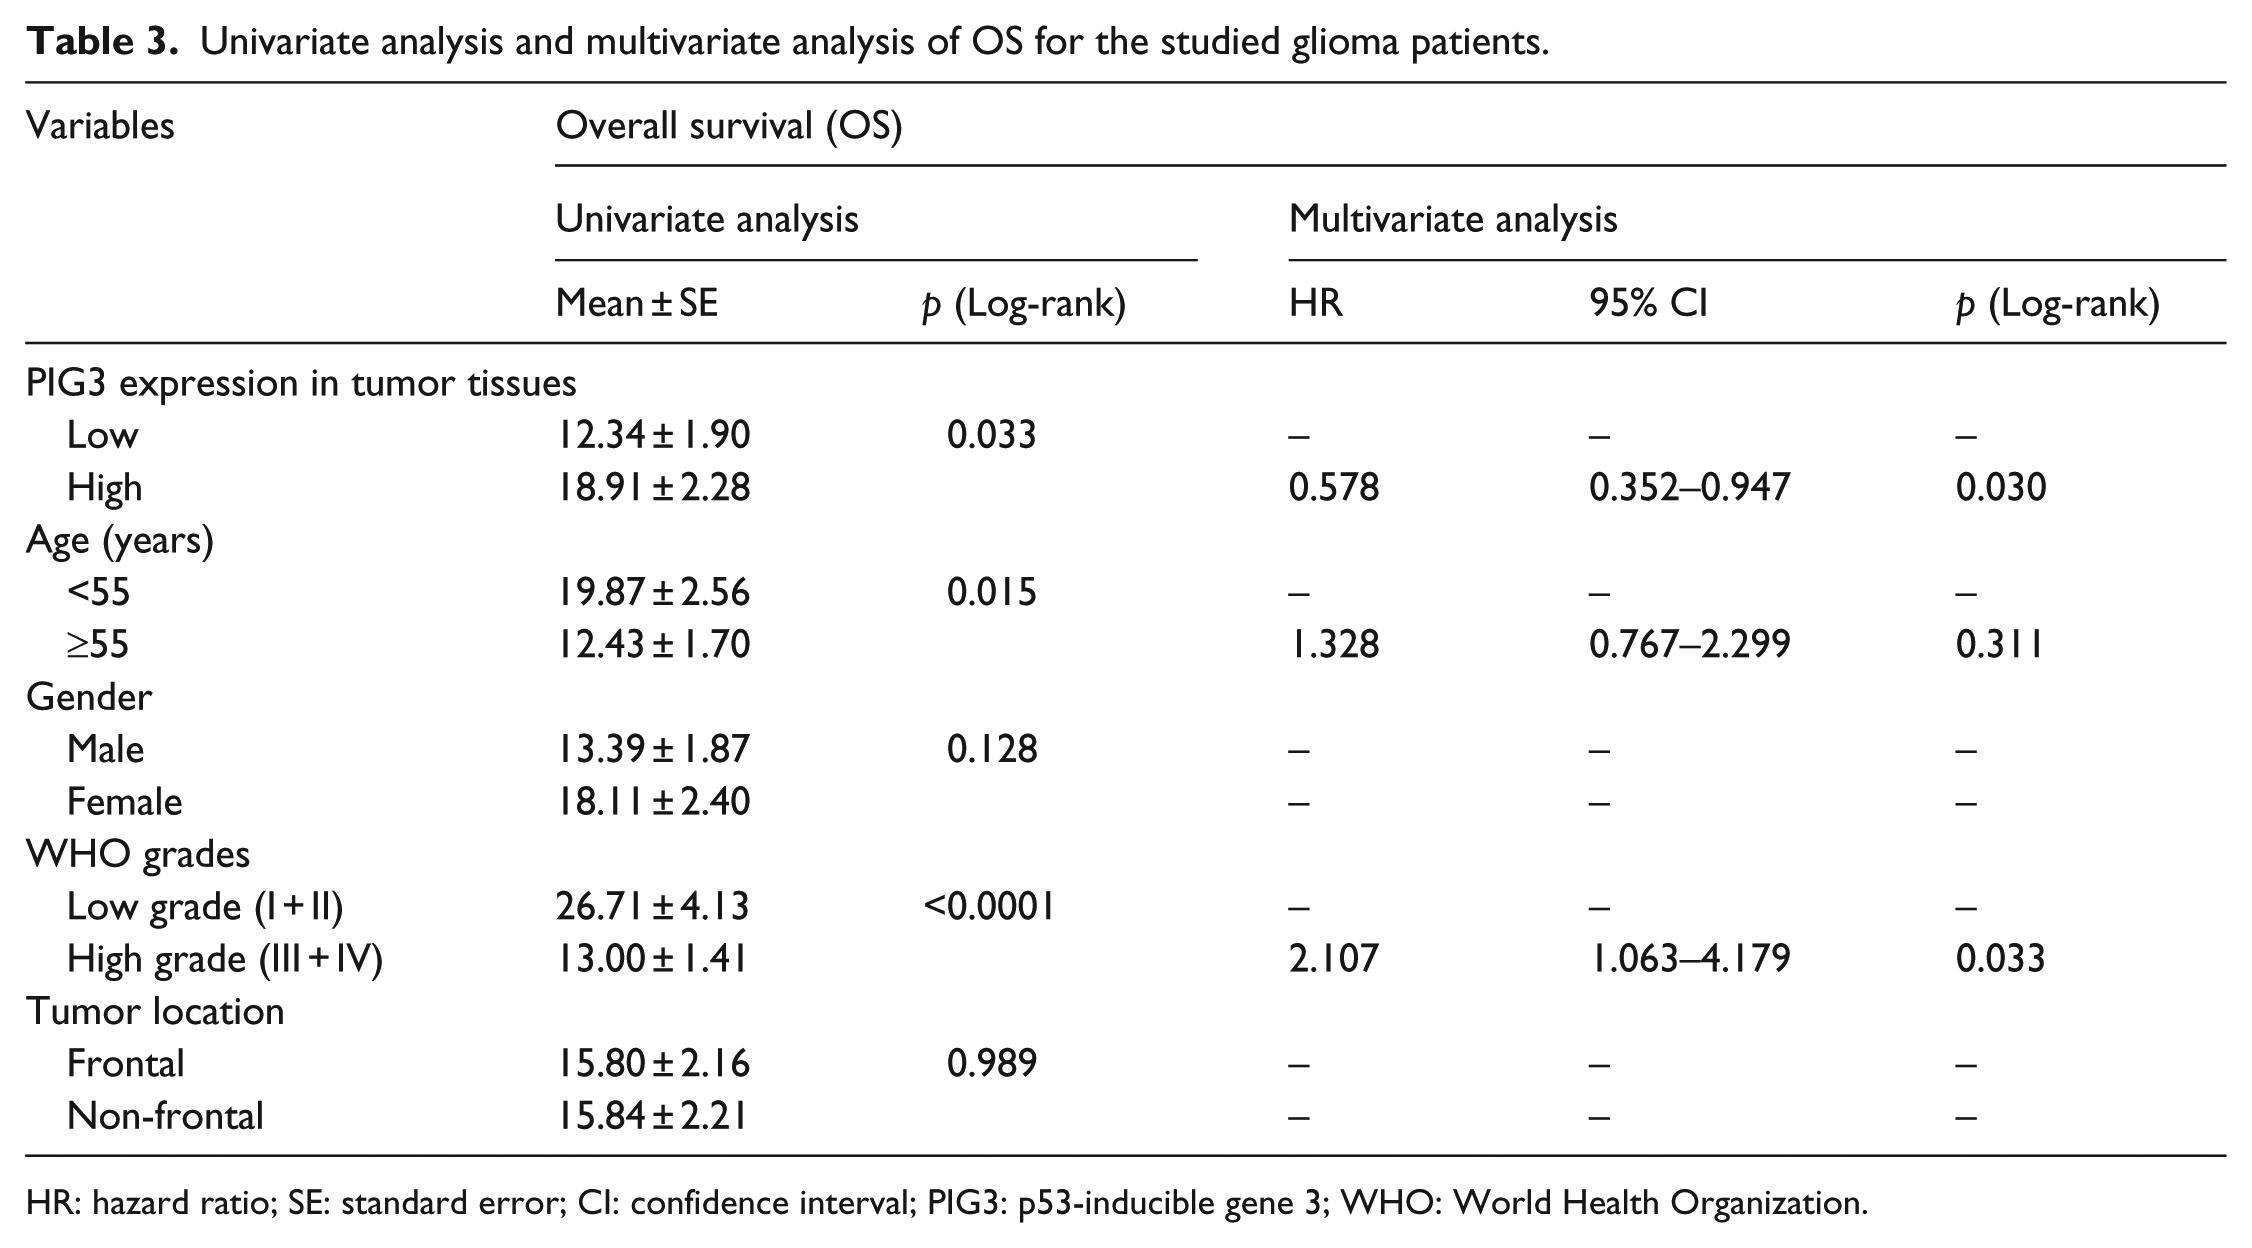
HR: hazard ratio; SE: standard error; CI: confidence interval; PIG3: p53-inducible gene 3; WHO: World Health Organization.
Suppression of PIG3 enhanced GBM proliferation and invasion ability
To illustrate the functions of PIG3 in GBM progression, we first analyzed PIG3 expression in multiple GBM cells. Both the RT-PCR and Western blotting results showed that the expression of PIG3 was much lower in U87-MG compared with A172 (Figure 2(a) and (b)). We then constructed PIG3 expression lentivirus and overexpressed PIG3 in U87-MG cells (Figure 2(c) and (d)). As shown in Figure S1A, the expression level of PIG3 affects the cell apoptosis and proliferation. The expressions of PIG3 were confirmed by Western blot (Figure S1B). We therefore established the PIG3-OE cells with relative low dosage of lentivirus-expressing PIG3 to maintain cell survival. And in consistent, we efficiently knockdown of PIG3 in A172 cells (Figure 2(e) and (f)).

Overexpression or knockdown of PIG3 expression in GBM cells. (a) RT-PCR analysis of PIG3 mRNA levels in four GBM cells. (b) Western blotting analysis of PIG3 protein levels in four GBM cells. (c) RT-PCR analysis of PIG3 overexpression in U87-MG cells. (d) Western blotting analysis of PIG3 overexpression in U87-MG cells. (e) RT-PCR analysis of PIG3 knockdown efficiency in A172 cells. (f) Western blotting analysis of PIG3 knockdown in A172 cells.
Then, the functions of PIG3 on the invasion and anchorage-independent growth ability of GBM cells were assessed. The CCK8 assay demonstrated that overexpression of PIG3 in U87-MG cells significantly decreased cell proliferation ability (Figure 3(a)). The Matrigel-Transwell invasion assay indicated that overexpression of PIG3 reduced the invasive ability of GBM cells (Figure 3(b) and (c)). On the contrary, knockdown of PIG3 significantly increased cell proliferation (Figure 3(d)). The Matrigel-Transwell invasion assay indicated that the suppression of PIG3 enhanced the invasive ability of glioma cells (Figure 3(e) and (f)). Altogether, these findings suggest that PIG3 is crucial in inhibiting the proliferation and invasive phenotype of GBM cells.

Suppression of PIG3 enhanced GBM proliferation and invasion ability. (a) CCK8 analysis of cell proliferation with or without PIG3 overexpression in U87-MG cells. (b and c) Matrigel-Transwell analysis of U87-MG cells with or without PIG3 overexpression. Images of representative staining are shown. Magnification: ×200. (d) CCK8 analysis of cell proliferation with or without PIG3 knockdown in A172 cells. (e and f) Matrigel-Transwell analysis of A172 cells with or without PIG3 knockdown. Images of representative staining are shown. Magnification: ×200. The experiments have been repeated three times.
Overexpression of PIG3 inhibits GBM progression in vivo
In order to reveal the in vivo effect of PIG3 on GBM progression, we injected PIG3 overexpression and NC U87-MG cells into the brain of nude mice to emulate the progression of GBM. Tumors were monitored by bioluminescence imaging and H&E staining. The in vivo imaging results showed that overexpression of PIG3 significantly inhibited tumor growth and invasion (Figure 4(a) and (b)). The tumor weight also reduced after PIG3 overexpression (Figure 4(c)). H&E staining confirmed the formed GBM in vivo. Taken together, these results further supported that PIG3 is critical for GBM suppression in animal model.

Overexpression of PIG3 inhibits GBM progression in vivo. (a) Representative bio-luminance appearance of nude mice at 6 weeks after cranial injection of U87-MG cells or PIG3-OE U87-MG cells. (b) Data were presented as average radiance efficiency [(photons/s/cm2/steradian)/(µW/cm2)]. Images were presented with the same scale bar. (c) Tumor weight was calculated in every group (with n = 6–8 per group). (d) Representative H&E images of GBM induced in nude mice.
PIG3 decreased MMPs expression in GBM cells
Furthermore, we detected the expression of key members associated with tumor metastasis of MMPs. The results showed that PIG3 overexpression significantly inhibited expression of MMPs including MMP-2, MMP-3, and MMP-7 (Figure 5(a)). On the contrary, knockdown of PIG3 in A172 cells increased MMPs (Figure 5(b)). We further examined these proteins in GBM tissue collected from in vivo animal models. Consistently, MMPs were significantly reduced after PIG3 overexpression (Figure 5(c)). Collectively, these results revealed that PIG3 suppresses GBM cell proliferation and invasion through down-regulating MMPs.
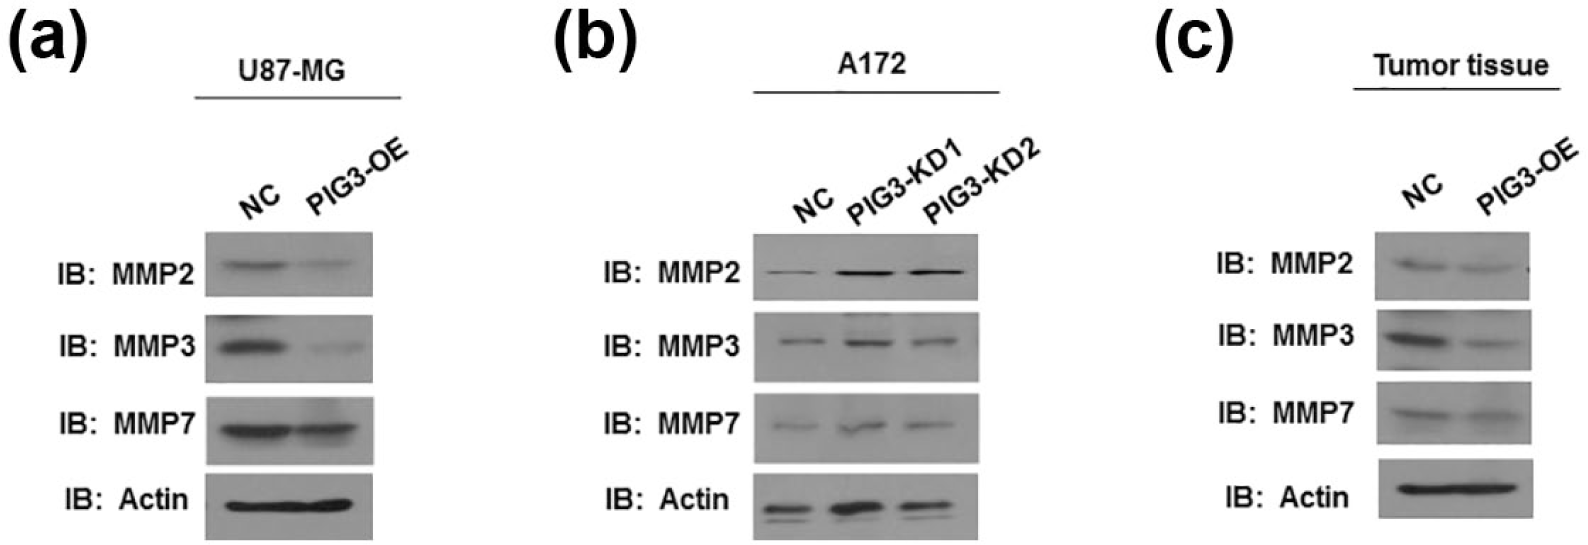
PIG3 decreased MMPs expression in GBM. (a) Western blotting analysis of MMPs expression in U87-MG cells with or without PIG3 overexpression. (b) Western blotting analysis of MMPs expression in A172 cells with or without PIG3 knockdown. (c) Western blotting analysis of MMPs expression in GBM tissue collected from in vivo animal models.
Discussion
The extremely aggressive and highly infiltrative nature of GBM restrains the effectiveness of current GBM treatments, and novel prognostic markers and targets of therapeutic response are urgently needed. In this study, we found that the expression of PIG3 was suppressed in a cohort of glioma tissues and negatively related to the WHO grades. Moreover, high PIG3 expression was associated with good prognosis, indicating that PIG3 might be a novel prognostic biomarker for GBM progression.
The function and clinical implications of PIG3 in cancer progression remain elusive. It is well established that PIG3 participates in apoptosis and stress response, which inhibits tumor progression.18–20 Consistent with reported tumor suppressor function, we found that high PIG3 expression suppressed GBM growth and invasion. And our results revealed new functions of PIG3 in in vitro and in vivo GBM models, which is regulating cancer cell proliferation and invasion. The promoter of PIG3 contains tandem repeats of pentanucleotides (TGYCC)n that is known as a p53 binding site. 9 Besides P53, prohibitin and prohibiton have been found as novel factors binding to PIG3 promoter (TGYCC)n motif. 18 Prohibitin and prohibiton up-regulated PIG3 transcription independent of p53. 18 Thus, low expression of PIG3 in GBM might result from the abnormal P53 status or other factors such as prohibitin and prohibiton. Our study provides the potential that rescue PIG3 expression in GBM might be an attractive way for GBM treatment.
Although PIG3 is a target of P53, the downstream molecular mechanisms of PIG3 are poorly understood. PIG3 has been found to regulate HIF-1α and VEGF. 16 HIF-1α contributes to hypoxia-induced pancreatic cancer cell invasion via promoting QSOX1 which subsequently activates MMP-2 and MMP-9. 21 Thus, PIG3 suppressed MMPs in GBM might also though down-regulating HIF-1α.Besides our newly found PIG3, other p53 targeted genes such as Rap21 also have been found to regulate cancer cell migration and invasion through MMPs. 22 MMPs are critical proteinases for GBM invasion and proliferation.23–26 Up-regulation of MMPs including MMP-2 and MMP-9 has been suggested as biomarkers to monitor GBM treatment and contribute to the morbidity and mortality of GBM patient.25–27 Therefore, down-regulating MMPs is crucial for GBM therapy, further supporting the hypothesis that reactivating p53-PIG3 axis in GBM might be an attractive way for GBM treatment.
In conclusion, our study found that PIG3 might function as an independent prognostic factor in gliomas. Our findings may add an additional layer to the complexity of the roles of PIG3 in cancer and provide a novel prognostic biomarker or therapeutic target in the management of glioblastoma.
Footnotes
Acknowledgements
J.Q. and Y.L. contributed equally to this work.
Declaration of conflicting interests
The author(s) declared no potential conflicts of interest with respect to the research, authorship, and/or publication of this article.
Funding
The author(s) disclosed receipt of the following financial support for the research, authorship, and/or publication of this article: This research was funded by the National Natural Science Foundation of China (Nos 81260304, 81360651, and 81160539).
References
Supplementary Material
Please find the following supplemental material available below.
For Open Access articles published under a Creative Commons License, all supplemental material carries the same license as the article it is associated with.
For non-Open Access articles published, all supplemental material carries a non-exclusive license, and permission requests for re-use of supplemental material or any part of supplemental material shall be sent directly to the copyright owner as specified in the copyright notice associated with the article.