
Abstract
Objectives:
This research aims to establish a copper homeostasis-related gene signature for predicting the prognosis of epithelial ovarian cancer and to investigate its underlying mechanisms.
Methods:
We mainly constructed the copper homeostasis-related gene signature by LASSO regression analysis. Then multiple methods were used to evaluate the independent predictive ability of the model and explored the mechanisms.
Results:
The 15-copper homeostasis-related gene (15-CHRG) signature was successfully established. Utilizing an optimal cut-off value of 0.35, we divided the training dataset into high-risk and low-risk subgroups. Kaplan-Meier analysis revealed that survival times for the high-risk subgroup were significantly shorter than those in the low-risk group (P < .05). Additionally, the Area Under the Curve (AUC) of the 15-CHRG signature achieved 0.822 at 1 year, 0.762 at 3 years, and 0.696 at 5 years in the training set. COX regression analysis confirmed the 15-CHRG signature as both accurate and independent. Gene set enrichment (GSEA), Kyoto Encyclopedia of Gene and Genome (KEGG) and Gene Ontology (GO) analysis showed that there were significant differences in apoptosis, p53 pathway, protein synthesis, hydrolase and transport-related pathways between high-risk group and low-risk group. In tumor immune cell (TIC) analysis, the increased expression of resting mast cells was positively correlated with the risk score.
Conclusion:
Consequently, the 15-CHRG signature shows significant potential as a method for accurately predicting clinical outcomes and treatment responses in patients with epithelial ovarian cancer.
Introduction
Ovarian cancer is the most lethal gynecological malignancy. Patients with epithelial ovarian cancer (EOC) account for approximately 90% of ovarian cancer patients. 1 It is challenging to recognize EOC without clinical symptoms and special laboratory tests in the early stages, so most cases are usually detected in the advanced stages. The 5-year survival rate is low, only at 30%. 2 Treatment is challenging because almost 75% of cases are diagnosed in advanced stages. 3 The current treatments include surgery, chemotherapy, immunotherapy, etc. In the surgical management of ovarian cancer, the prognosis remains challenging due to the typical late-stage diagnosis at which most patients present. At this advanced stage, patients often exhibit complications and distant lymph node metastases, with these metastatic nodes commonly located in anatomically deep positions. Consequently, many patients potentially lose the opportunity for surgical intervention or require more extensive surgeries for resection. These complexities make it difficult to fully eradicate the tumor and achieve complete lymph node removal, thereby negatively impacting the overall prognosis of ovarian cancer. In chemotherapy treatments, the adverse effects are severe, leading to a scenario where most patients succumb to infections rather than the primary disease, due to bone marrow suppression and resultant immunodeficiency. 4 Furthermore, recent studies indicate that current immunotherapy protocols have yet to demonstrate a significant enhancement in survival rates. 4 Consequently, it is still urgent to discover more optimal therapeutic target genes for EOC, offering new perspectives for prognostic prediction and a breakthrough target for treatment in the later stage of the disease.
Copper is an indispensable micronutrient for all living creatures and is critical in many biological processes, including mitochondrial respiration, antioxidant activity, and neuropeptide processing.5,6 Precise regulation of cooper homeostasis is essential to maintaining essential biological functions and preventing related diseases. Copper homeostasis imbalance can significantly affect cancer cell proliferation and metastasis. 5 Compared with normal subjects, patients with several malignancies including ovarian cancer have substantially higher copper levels in serum or tumor tissue, and the increased copper levels can lead to a poorer prognosis.7 -9 Further, it has been found that excessive accumulation of copper ions may promote the progression and migration of carcinoma by promoting tumor cell reproduction, cell metastasis and angiogenesis. In colon cancer, the inflammatory factor IL-17 can drive copper absorption by inducing the metalloreductase STEAP4, and elevated copper levels in turn activate XIAP, inhibit apoptotic protein caspase-3 activity, and promote tumorigenesis. 10 Furthermore, by reducing the concentration of copper ions, copper complexes may cause the G2 /M phase cell cycle arrested, mitochondrial dysfunction and ROS accumulation in tumor cells, eventually leading to apoptosis of tumor cells, suggesting that the effect of copper ions on cancer may be related to cell proliferation.11,12 Copper ions activate pro-angiogenic factors such as vascular endothelial growth factor (VEGF), angiopoietin, ceruloplasmin, SPARC, and NF-kB, which induce angiogenesis, promote ascites production, and enhance or trigger cell proliferation and migration, thereby worsening tumor progression and metastasis, while reducing copper levels contributes to improved prognosis in malignant tumors.5 -8,10 In summary, copper homeostasis imbalance promotes tumor advancement and metastasis, so target genes for copper homeostasis may become a new strategy for treating EOC and assessing the prognosis of EOC patients.
The expanding scale and inherent complexity of biological data have prompted the increasing use of machine learning to construct informative and predictive models of fundamental biological processes. 13 Algorithms based on machine learning have been extensively applied to clinical decision-making, 14 of which one of the most commonly utilized algorithms is the Least Absolute Shrinkage and Selection Operator (LASSO). 15 Through multiple cross-validations of the connection among genes and prognosis and fitting the prediction performance of genes according to a specific algorithm, this algorithm dramatically improves the accuracy of disease prognosis prediction, and thus is often applied to predict the prognosis of diseases. 16 In this article, we have attempted to explore genes for prognostic prediction through machine learning to construct an EOC prognostic signature on copper homeostasis-related genes (CHRGs).
Methods
Data collection and the overall design proposals
RNA-Seq data and clinic records from 381 EOC cases were extracted from the TCGA website (https://portal.gdc.cancer.gov/projects/TCGA). A univariate COX analysis and Kaplan-Meier analysis were utilized to identify potential EOC-related prognostic genes. Meanwhile, the keyword “copper homeostasis” was entered, and the CHRGs datasets were retrieved from the MalaCards Human Disease Database (https://www.malacards.org/). Venn diagram (https://www.malacards.org/) is used to identify overlapping genes between EOC-related prognostic genes and CHRGs, which are considered to be potential copper homeostasis-related prognostic genes. LASSO regression analysis was used to determine the best copper homeostasis-related prognostic genes. The best copper homeostasis-related prognostic genes were analyzed by multivariate Cox regression to construct the copper homeostasis-related gene prognosis model. According to the optimal threshold, the patients with EOC were divided into a high-risk group and a low-risk group. The prediction ability of the model is evaluated by the Kaplan-Meier survival curve, nomogram, calibration curve, time-dependent ROC curve and principal component analysis. Further research on the mechanism is done through differential gene analysis between the high-risk group and low-risk group, and then functional enrichment analysis of these genes using GO, KEGG and GSEA. In addition, TIC was measured in 2 risk groups. This comprehensive analysis further elucidates the prognostic significance of copper homeostasis in EOC and strengthens the understanding of the molecular basis of this pathology. A P-value of <.05 was considered statistically significant. All statistical analyses were conducted using R (version 4.4.0), available at (http://www.r-project.org/). Details regarding the R packages used in this study can be found on the Comprehensive R Archive Network (CRAN) at (https://cran.r-project.org/). The flow chart of the study is in Supplemental File 1.
Identification of copper homeostasis-related prognostic genes
Potential EOC-related prognostic genes were initially filtered by Kaplan-Meier analysis with the “survminer” R package (v0.4.9) and univariate COX analysis with the “survival” R package (v3.6-4). The CHRGs were retrieved from the MalaCards Human Disease Database. A Venn diagram was utilized to identify genes shared between Potential EOC-related prognostic genes and CHRGs, indicating potential genes involved in copper homeostasis that may influence prognosis. Furthermore, LASSO regression analysis by R package “glmnet” (v4.1-8) was implemented to explore the core genes for prognostic prediction. To determine the optimal penalty value for the LASSO model, we utilized cross-validation, specifically k-fold cross-validation, with k typically being 10. This method involved dividing the data set into k smaller sets or folds. The LASSO model was then trained on k-1 of these folds, while the remaining fold was used for testing the model. This process was repeated such that each fold served as the testing set once. The penalty value that minimized the average error across all k folds was considered optimal. With the minimal penalty (λ), multiple stepwise regression analyses were applied to match the predictive performance of genes. 17 Finally, the best CHRGs were obtained.
Establishment of a copper homeostasis-related prognostic gene signature
Moving forward in our investigation of the influence of copper homeostasis on EOC, multivariate Cox regression analysis with the “survival” R package (v 3.6-4) was implemented to establish a CHRG signature model.
The formula for the risk-scoring model is as follows:

Where n, xi, and coef i denote the count of hub genes, the expression level of each gene, and their corresponding regression coefficients, accordingly.
The optimal cut-off value for the risk score was determined using the highest Youden index. Subsequently, cases in the training cohort were stratified into high-risk and low-risk subgroups based on this value. We then visualized the distribution of hazard scores, overall survival (OS) status, and gene-expression profiles across these groups.
Assessment of a copper homeostasis-related prognostic gene signature
The 381 samples were distributed randomly into training or validation cohorts in a 7:3 ratio via the “caret” R package (v 6.0-94). To evaluate the prognostic ability of the 15 CHRGs signature in EOC, a variety of analysis methods, including survival analysis and receiver operating characteristic (ROC) curve, were used to evaluate the prognostic ability of the model.
(1) Survival analysis
we conducted a Kaplan-Meier survival analysis with the “survminer” R package (v0.4.9) in the training set, comparing OS between the high-risk and low-risk subgroups. The analysis yielded Kaplan-Meier curves illustrating these comparisons. 18
(2) Receiver operating characteristic curve (ROC)
The receiver operating characteristic curve was generated with the “timeROC” R package (v0.3) to appraise the forecasting efficiency of the signature. To test the feasibility and stability of the gene signature, the hazard score was computed within the validation queue following the same equation as in the training queue, after which the same verification approach as described above was executed.
(3) Nomogram
A nomogram was then established by the “nomogramFormula” R package (v1.2.0.0) to visualize the outcomes of the regression analysis, after which calibration curves evaluated the accuracy of the nomograms.
(4) Principal component analysis (PCA)
Expression patterns of genes associated with copper homeostasis in EOC cases were analyzed using PCA. This method was employed to classify and visualize the spatial distribution among high-risk and low-risk samples, utilizing the “scatterplot3d” R package (version 0.3-44).
Investigation of the mechanisms of a copper homeostasis-related prognostic gene signature
(1) GO and KEGG Functional enrichment analysis
To elucidate molecular functions and critical signaling pathways, the R package “limma” was adopted to identify Differentially Expressed Genes (DEGs) among low-risk and high-risk subgroups (log2|fold change| >1 and FDR<0.05< span> <.05). After that, functional annotation analysis of DEGs based on GO and KEGG was executed in the Metascape database (https://metascape.org/gp/index.html#/main/step1) (P < .05). GO analysis depicts the enrichment of cellular components, molecular functions, and biological processes of DEGs, while KEGG shows the enrichment of pathways.19,20
(2) Gene set enrichment analysis (GSEA)
To discover the underlying molecular mechanisms and functional pathways involving the signature, we used the GSEA software (v4.2.3) to identify the enrichment pathways among low-risk and high-risk subgroups based on the HALLMARK gene set. 21 The HALLMARK gene sets (v7.1 5) were obtained from the Molecular Signatures Database (https://www.gsea-msigdb.org/gsea/msigdb/index.jsp). And P-value < .05, FDR q-value < .25, and |NES| >1 were regarded as statistically significant.
(3) Evaluation of tumor immune cell infiltration
The CIBERSORT (https://cibersort.stanford.edu/) is an analytical tool for analyzing the cellular components of complicated tissues with expression data based on preprocessed gene-expression profiles. 22 To determine whether the signature was related to tumor immunity, the CIBERSORT algorithm was adopted to estimate the difference in TIC infiltration among the 2 subgroups. At the same time, the Spearman correlation test was applied to evaluate the relationship between the gene signature and TIC.
Result
Identification of prognostic genes associated with copper homeostasis in EOC
The Gene-expression profiles of 378 EOC cases were downloaded, and we gained 19 655 genes. Among these genes, 3446 genes were screened as potentially prognosis-related genes by Kaplan-Meier and univariate COX analyses. Meanwhile, 1581 genes involved in copper homeostasis were retrieved from the Malacards database. After that, common intersecting genes between CHRGs and EOC prognosis-related genes were identified as possible copper homeostasis-related prognosis genes in Rstudio(v4.4.0) and were presented in a Venn diagram (Figure 1A).
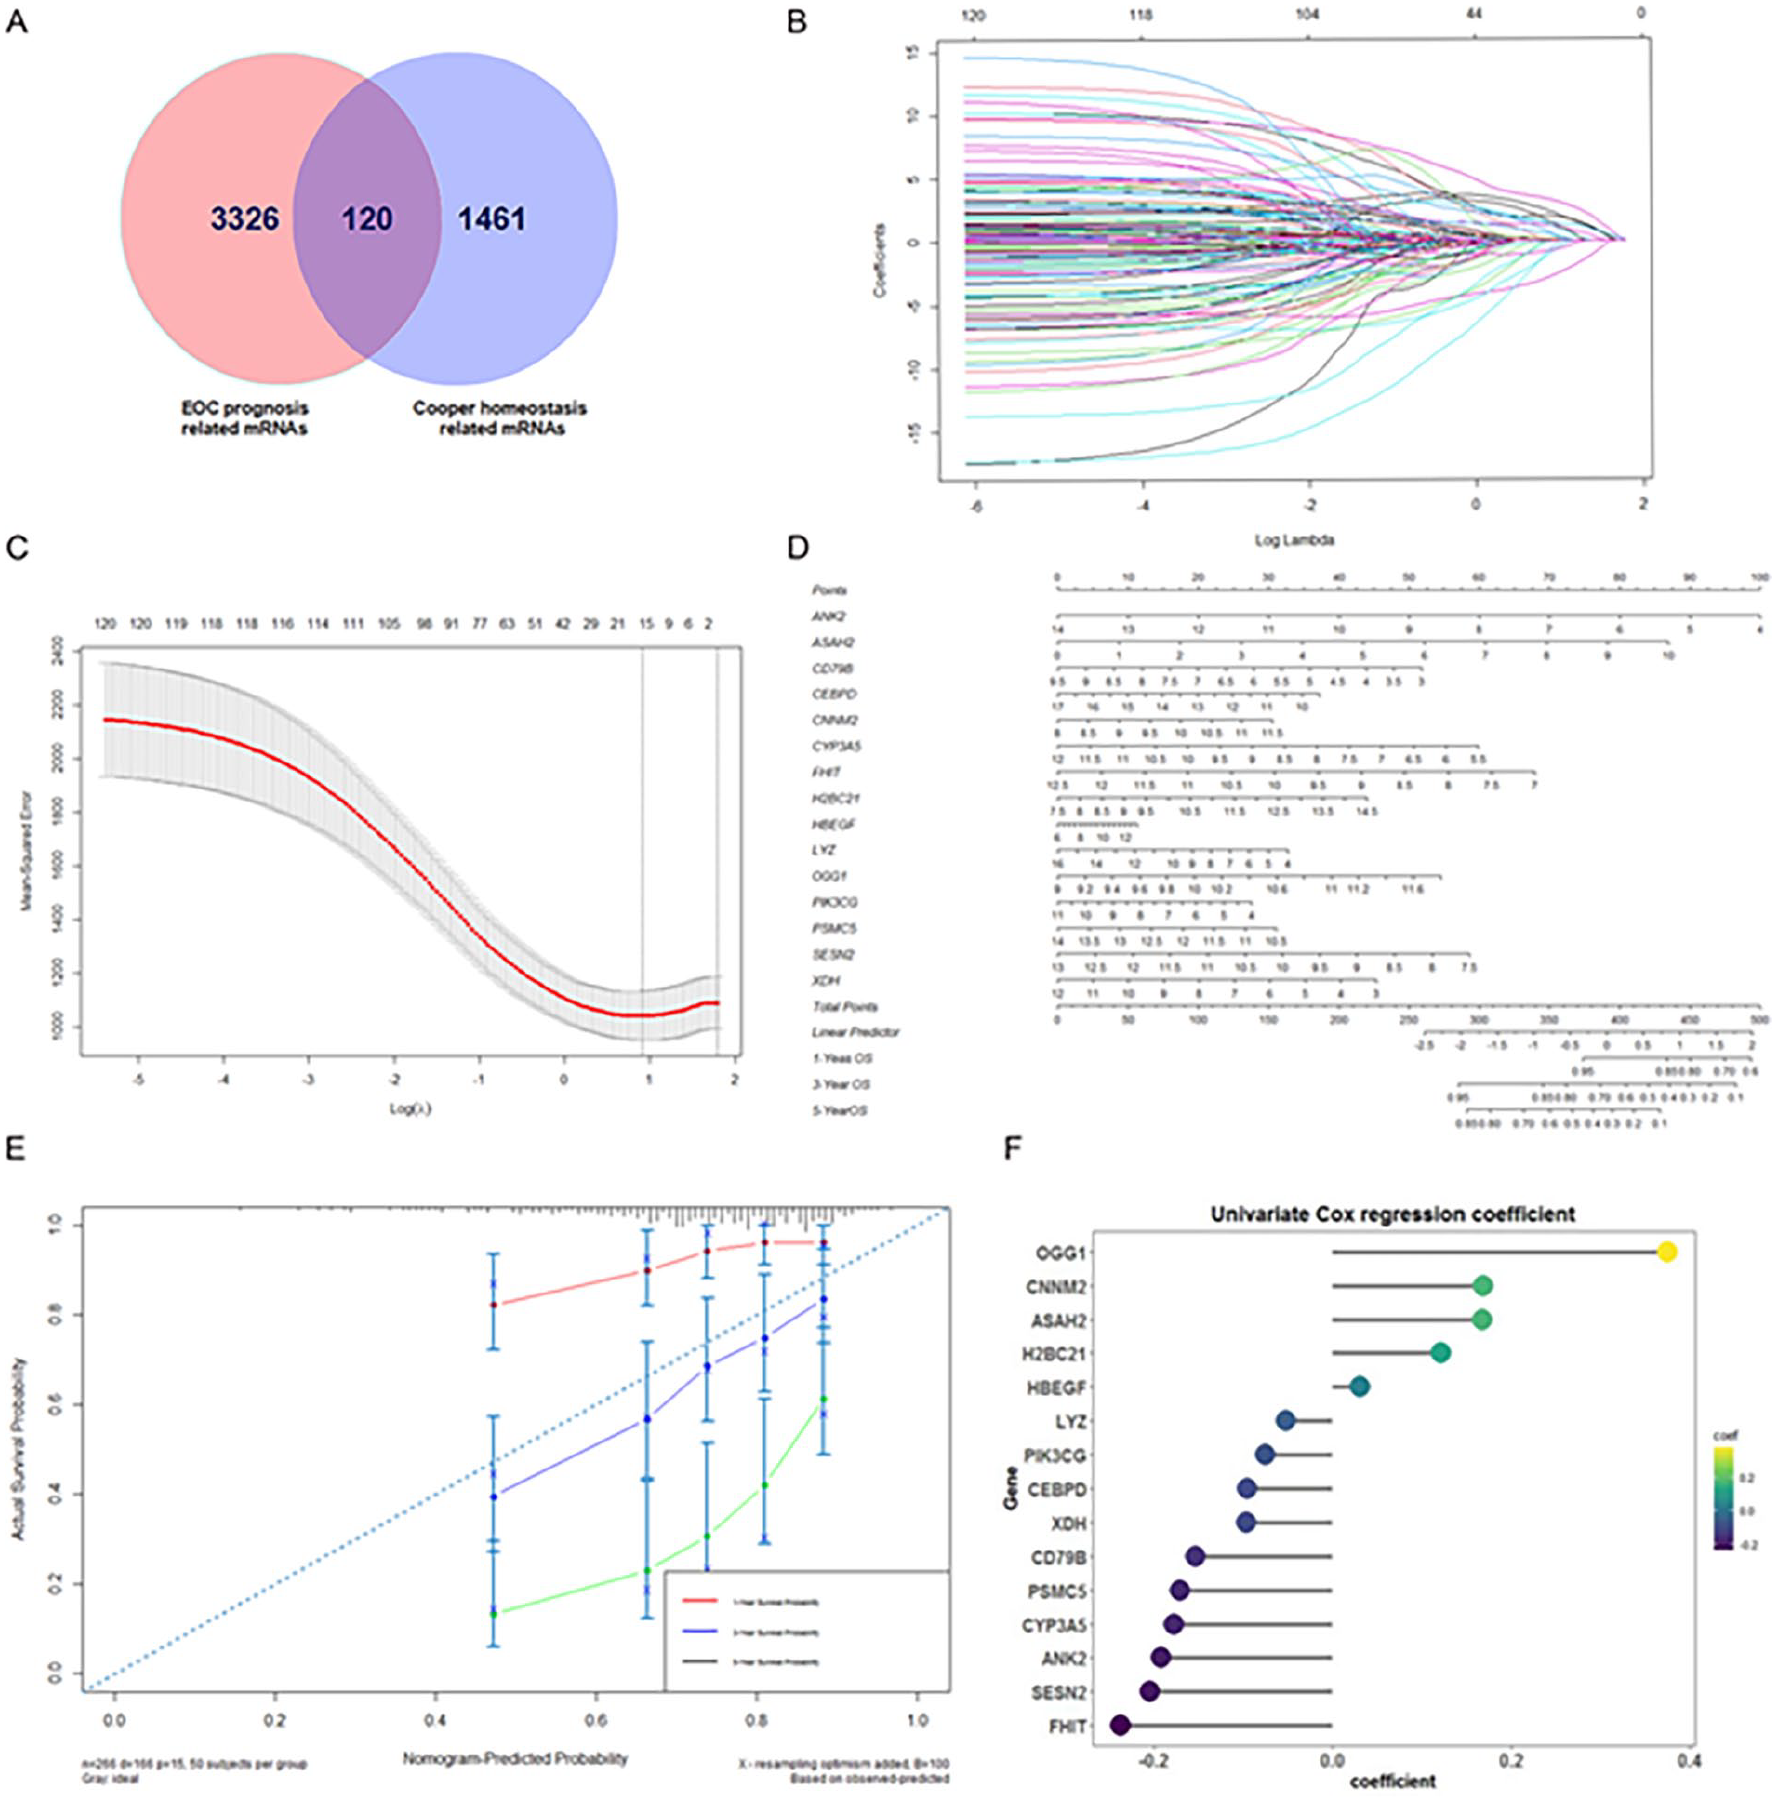
Establishment of 15-CHRG signature and validation of its predictive power on overall survival. (A) Venn diagram for the intersection of EOC prognosis-related genes and cooper homeostasis-related genes. (B) LASSO coefficient curves for 120 latent prognostic genes related to copper homeostasis. Every curve corresponds to a single gene. (C) Optimal penalty (λ) selection in LASSO-COX regression. (D) Nomogram of 15 copper homeostasis-related genes in the signature. (E) Calibration curve for evaluating the reliability of the nomogram. The gray diagonal dashed line depicts the ideal nomogram. (F) Univariate regression coefficients of 15 copper homeostasis-related genes.
Sample preparation
Overall, the dataset consists of 381 cases. For verifying the predictive value of the CHRGs signature, these cases are divided into 2 cohorts: a training cohort and a validation cohort. The training cohort comprises 266 cases, while the validation cohort consists of 115 cases. The clinic features of the overall, training team and validation team samples are shown in Table 1.
The clinic characteristics of TCGA-EOC.

Construction of cooper homeostasis-associated gene signature
As illustrated in Figure 1B and C, the 15 predictors were determined according to the LASSO regression analysis and the optimal value of penalty (λ) (i.e. ANK2, ASAH2, CD79B, CEBPD, CNNM2, CYP3A5, FHIT, H2BC21, HBEGF, LYZ, OGG1, PIK3CG, PSMC5, SESN2, and XDH). Meanwhile, a 15-CHRG signature model was established with multivariate Cox regression analysis. The risk score for each EOC individual was computed by the below equation: Risk score = (−0.193) * Expression (ANK2) + 0.167 * Expression (ASAH2) + (−0.096) * Expression (CEBPD) + (−0.177) * Expression (CYP3A5) + 0.121 * Expression (H2BC21) + 0.031 * Expression (HBEGF) + (−0.052) * Expression (LYZ) + (0.375) * Expression (OGG1) + (−0.153) * Expression (CD79B) + (0.168) * Expression (CNNM2) + (−0.238) * Expression (FHIT) + (−0.097) * Expression (XDH) + (−0.171) * Expression (PSMC5) + (−0.205) * Expression (SESN2) + (−0.076) * Expression (PIK3CG). Multivariate regression coefficients of 15 copper homeostasis-related genes were shown in Figure 1F.
Subsequently, with a risk score of 0.35 as the threshold, the training team cases were grouped into low-risk and high-risk subgroups. The distribution of hazard score, outcome status, and gene-expression profile of the 15-CHRG signature was displayed in the whole queue, training queue and validation queue(Figure 2A–C). The top half is for risk score distribution, the middle is for patient survival status, and the bottom is for a heatmap of 15 CHRGs expression profiles. The survival of patients in the high-risk subgroup was remarkably lower than those in the low-risk subgroup.

Further study on the predictive power of the 15-CHRG signature. The general performance of 15-CHRG signature in all cases, training and validation cohorts. (A–C) The top half is for risk score distribution, the middle is for patient survival status, and the bottom is for a heatmap of 15 CHRGs expression profiles. (D–F) Kaplan-Meier survival analysis of 15-CHRG signature. Time-dependent ROC curves (G–I) and time-dynamic AUC curves (J) for the whole samples, training team and validation team. (K–M) showed PCA of the training cohort, validation cohort and overall cohort.
Assessment of cooper homeostasis-associated gene signature
(1) Survival analysis
The Kaplan-Meier survival analysis demonstrated that the overall survival of the high-risk subgroup was considerably poorer than that of the low-risk subgroup in the whole queue, training queue and validation queue (Figure 2D–F).
(2) Time-dependent ROC and dynamic AUC change curves
Time-dependent ROC and dynamic AUC change curves illustrated that the AUC achieved 0.822 at 1 year, 0.762 at 3 years, and 0.696 at 5 years in the training set. The AUC for the overall sample reached 0.797 at 1 year, 0.783 at 3 years, and 0.729 at 5 years, whereas the AUC for the validation team attained 0.673 at 1 year, 0.82 at 3 years, and 0.818 at 5 years. (Figure 2G–I).Time-dynamic AUC curves
(3) Calibration curves
The calibration curves illustrated that the 15-CHRG signature was a near-ideal prediction model that correctly predicted 1-, 3-, and 5-year overall survival (Figure 1E).
(4) Nomogram
In the nomogram based on predictors (Figure 1D), the likelihood of survival for these patients was calculated by summing the scores of the 15 CHRGs on the integral scale.
(5) Principal component analysis
PCA revealed that the overall, training and validation cohort could be reasonably segmented into low-risk and high-risk subgroups (Figure 2K–M).
(6) Multivariate Cox regression analysis
For comparing the independent predictive capability of this gene signature with other clinic features such as age, race and tumor stage for EOC prognosis, Multivariate Cox regression analysis was performed. The result suggested that hazard score was remarkably associated with the overall survival of EOC patients (HR = 0.35, 95% CI = 0.26-0.46, P < .001), indicating the 15-CHRG signature is an influential independent variable for EOC prognosis (Figure 3).

Multivariate Cox regression analysis showing the hazard ratio of 15-CHRG signature and clinic characteristics.
Molecular function and pathway enrichment analysis by GSEA, GO, and KEGG
As for the underlying discrepancies in the biological functions and signaling pathways, the GSEA suggested that the low-risk subgroup was enriched in many tumor suppression-related pathways such as apoptosis and P53 pathways, as well as many immune-related pathways including IL2 pathway, IL6 pathway, interferon pathway, and TNFA pathway (Figure 4A), while many cancer mutation-associated pathways were concentrated in the high-risk subgroup, for example, DNA repair, E2F and G2M checkpoint (Figure 4B).
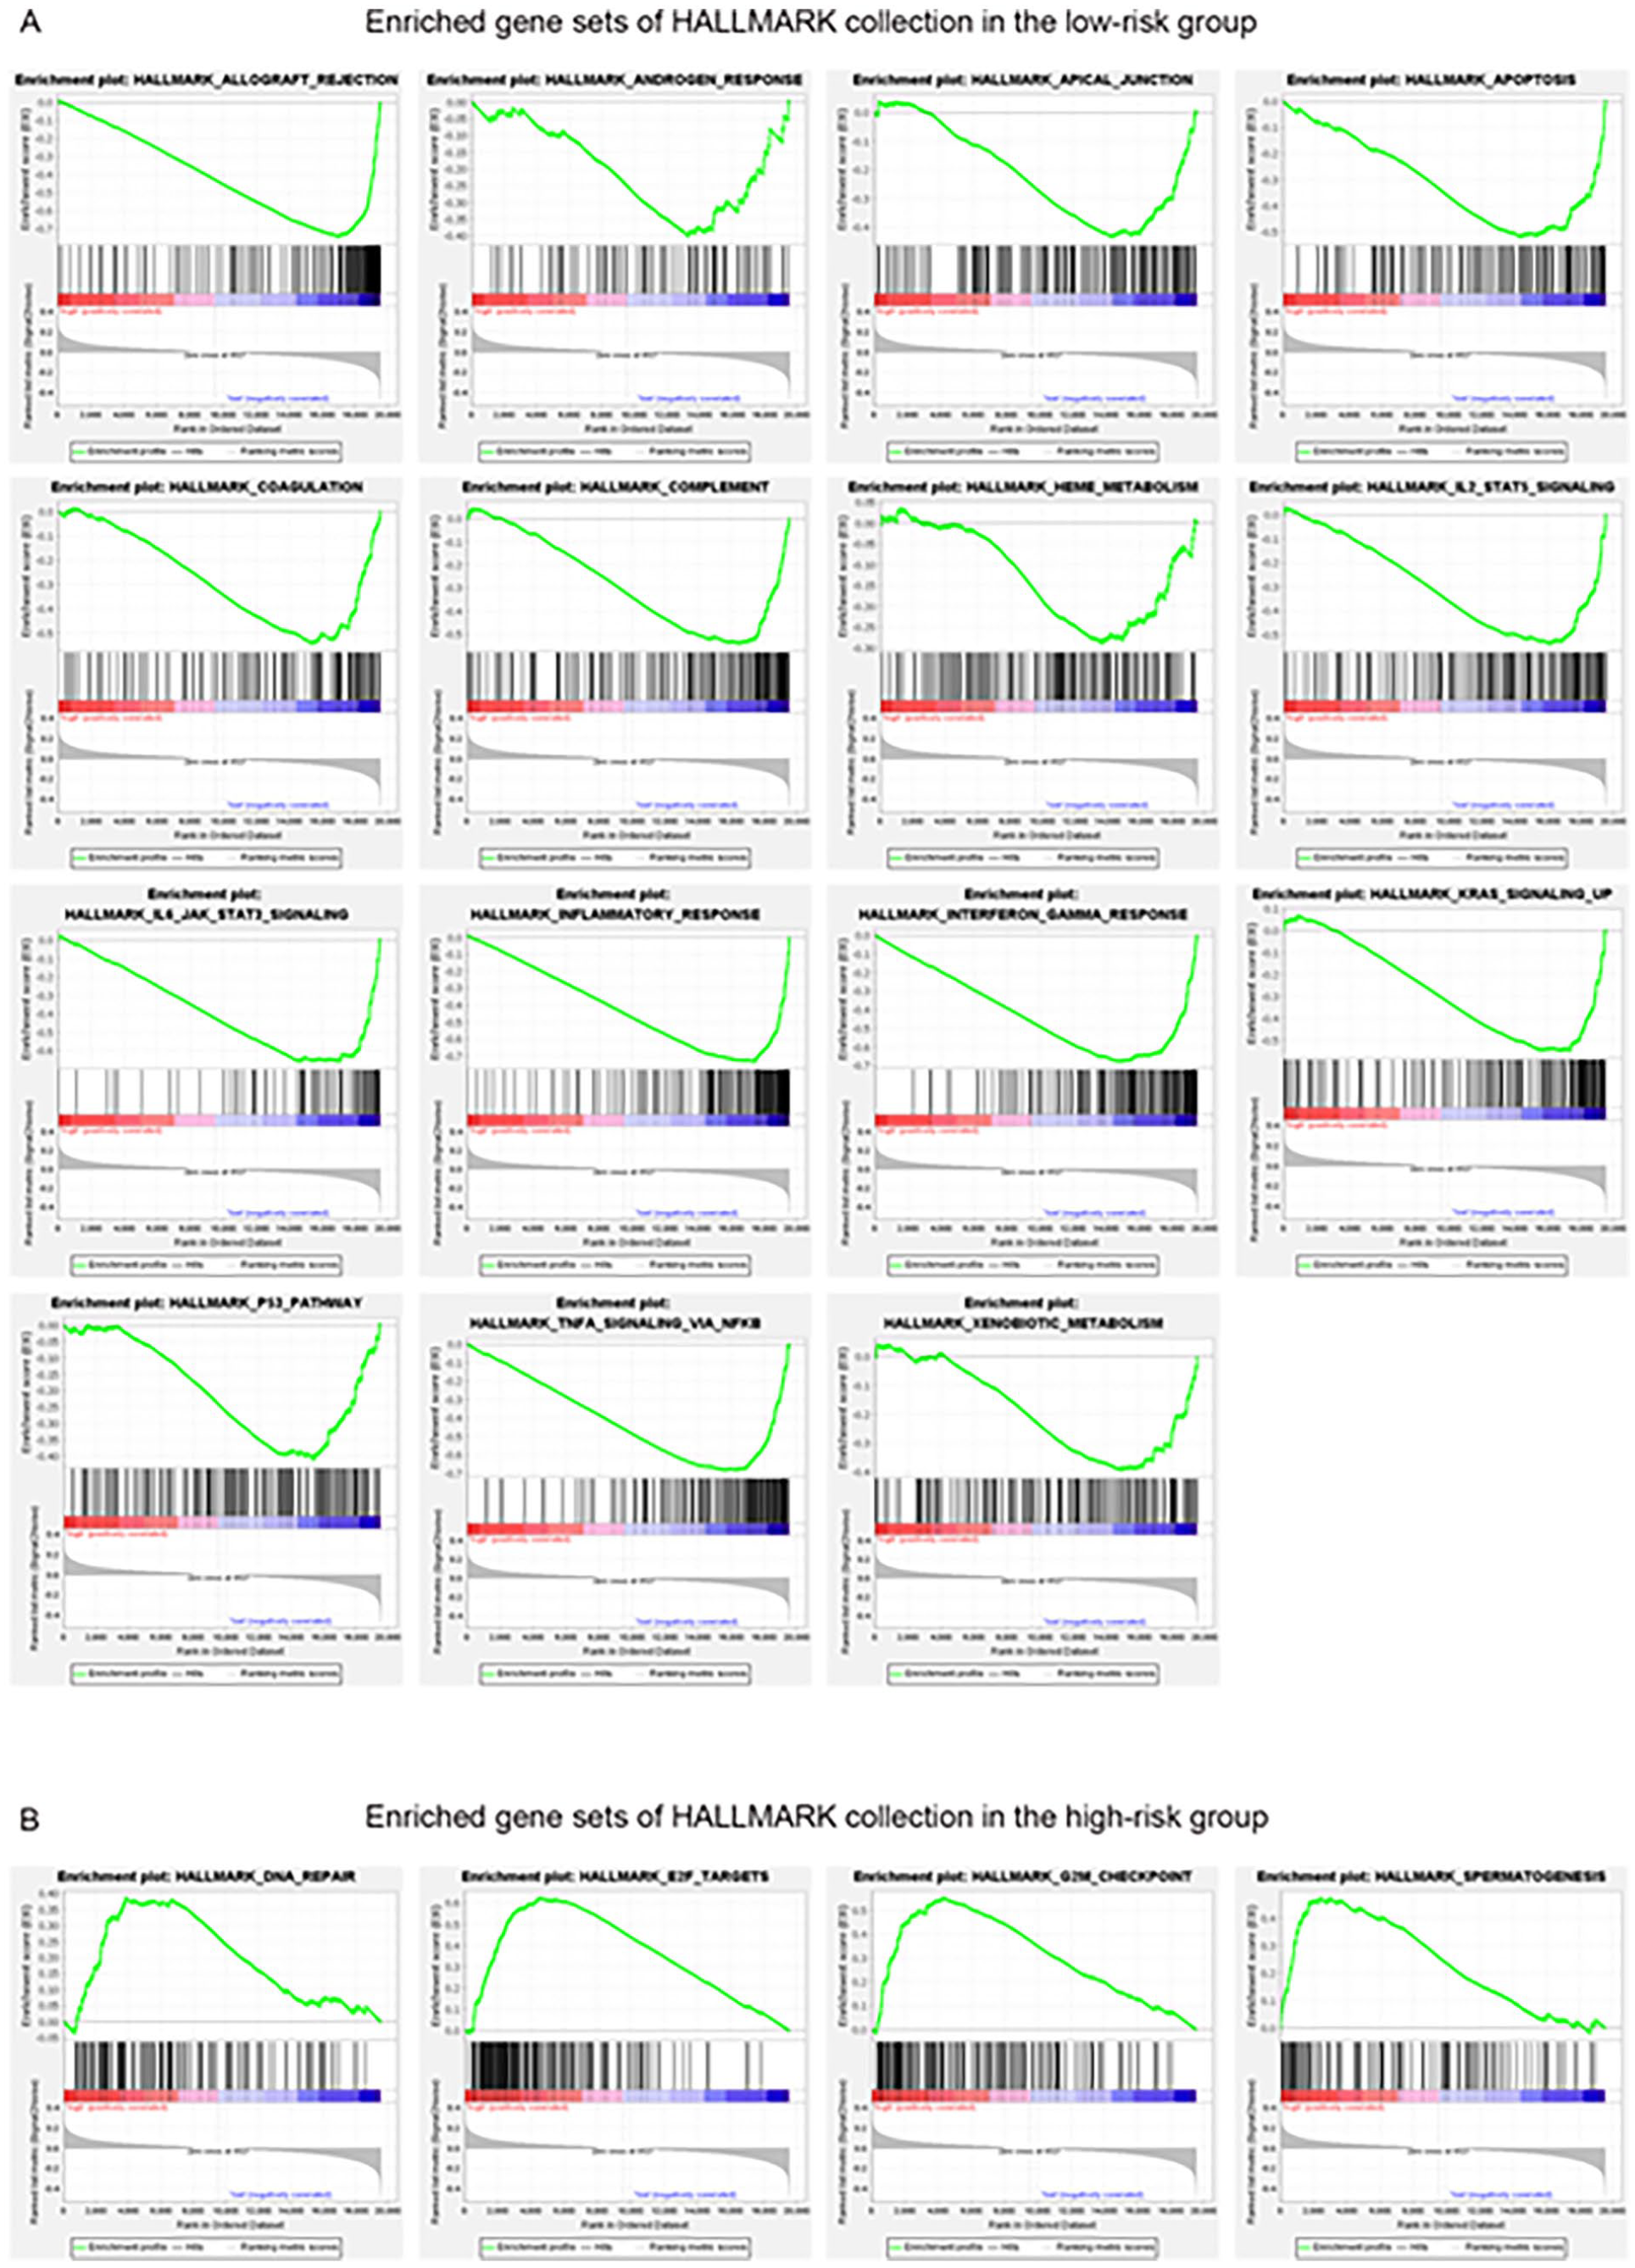
GSEA performed by HALLMARK gene set. The enrichment gene set in the low-risk (A) and high-risk (B) subgroups. (NOM P-value < .05, FDR q-value < 0.25, and | NES | >1).
For a further investigation of the differences in biological processes or pathways of DEGs among the 2 risk cohorts, GO enrichment analysis and KEGG pathway analysis were conducted on DEGs (Figure 5A). KEGG analysis suggested that DEGs were mainly concentrated in protein synthesis and hydrolysis-related pathways and transport pathways, such as protein processing in endoplasmic reticulum, ubiquitin-mediated proteolysis, ribosome, nucleocytoplasmic transport, and endocytosis (Figure 5B). At the same time, biological processes were primarily confined to protein transport and hydrolytic metabolic processes. In short, these findings implied that the 15-CHRG signature might influence the survival of EOC patients primarily by tumor suppression, tumor immunity, and protein synthesis hydrolysis

GO function enrichment and KEGG analysis of the DEGs between high-risk and low-risk subgroups. (A) Volcano plots. Red represents a significant increase in gene expression, and blue represents a substantial decrease in gene expression. (B) GO functional enrichment analysis. Biological processes, molecular function, and cellular components are included. (C) KEGG pathway analysis. The bubble size represents the number of genes enriched by the pathway, and the bubble color represents the P-value.
Immunocorrelation analysis of EOC patients with 15-CHRG signature
For the relationship between 15-CHRG signature and tumor immunity in EOC patients, TIC infiltration revealed that CD8 T cells, resting mast cells, activated CD4 memory T cells and naive B cells were differentially infiltrated (Figure 6A). At the same time, Spearman correlation analysis implied that 7 immune cells were significantly relevant to the risk score (Figure 6B). Considering the above 2 analyses together, we found resting mast cells were potentially positively related to EOC prognosis (P < .05).

Analysis of TICs infiltration in EOC patients between low- and high-risk groups based on 15 CHRGs. (A) Box plots of the differences in 22 TICs infiltration. (B) Relevance between TICs and 15-CHRG signature. Only graphs with significant correlations are plotted; P < .05.
Discussion
Ovarian cancer is the third most common gynecologic cancer worldwide, but with the highest death rate among these cancers, so it is essential to identify reliable and valid prognostic biomarkers of EOC. According to previous research, dysregulation of copper homeostasis promotes tumor development and prognosis by promoting tumor cell proliferation, metastases and angiogenesis.5 -8,10 Copper chelators could induce copper transporter protein 1 (CTR1) expression via the Cu-Sp1-CTR1 regulatory loop in non-small cell lung cancer cells to reduce copper ion concentrations, subsequently enhancing chemosensitivity to cisplatin treatment, finally enhancing the efficacy of chemotherapeutic drugs and prolonging patient survival. 23 Similarly, copper chelators could reverse platinum resistance and improve cancer patient’s prognosis.24,25 In summary, the imbalance of copper homeostasis promotes tumor progression. Therefore, we speculated that CHRGs might be closely associated with the prognosis of EOC, and we thus tried to establish a prognostic gene signature associated with copper homeostasis.
Firstly, 120 potential prognostic genes related to copper homeostasis were identified by analyzing the intersection of differential genes and copper homeostasis genes. Next, a machine learning algorithm-LASSO regression model analysis was performed on these 120 genes to construct a 15-CHRG signature associated with copper homeostasis (ANK2, ASAH2, CD79B, CEBPD, CNNM2, CYP3A5, FHIT, H2BC21, HBEGF, LYZ, OGG1, PIK3CG, PSMC5, SESN2. and XDH). Meanwhile, univariate COX analysis was performed on clinical features including age, tumor stage, and 15-CHRG signature, and the result suggested that the 15-CHRG signature was more accurate and independent. Besides, the nomogram and the calibration curve demonstrated that the 15-CHRG signature could predict the survival of patients more accurately. Furthermore, the survival analysis shows statistically significant results in the overall and training datasets, highlighting differences in survival rates between risk groups based on copper homeostasis genes. However, the validation set, likely due to the smaller sample size, shows no significant P-value, only approaching significance at .055. This marginal result suggests a potential trend that might become significant with a larger dataset or changes in population dynamics. In previous studies, the Cox proportional risk prognostic model based on differentially expressed genes was constructed, and the AUC of the model was 0.71 26 ; the model based on glucose metabolism-related genes was established, the AUC was 0.668 at 2 years, 0.785 at 3 years, and 0.744 at 4 years 27 ; the prognostic model based n lipid metabolism-related genes were constructed, the AUC was 0.706 at 2 years, 0.694 at 3 years, and 0.724 at 5 years 28 ; the model based on tumor mutation load-related genes was built, the AUC was 0.703, 0.758, and 0.777 at 1 year, 3 years, and 5 years, respectively. 29 In conclusion, the AUC of the models established in previous studies are mainly located between 0.6 and 0.77, while the AUC of the models established in this study were 0.822 at 1 year, 0.762 at 3 years, and 0.696 at 5 years. So, compared with other models, the 15-CHRG signature can better assess the prognosis of EOC.
Regarding the underlying mechanism, the toxicity of copper is manifested when its concentration surpasses thresholds maintained by evolutionarily conserved homeostatic mechanisms. Recent studies ha elucidated that excessive levels of copper may cuproptosis. This pathway characteristically involves the direct binding and subsequent accumulation of excessive copper to the lipoyl groups of proteins involved in the tricarboxylic acid (TCA) cycle of mitochondrial respiration. This accumulation leads to the destabilization and loss of iron-sulfur cluster proteins, culminating in proteotoxic stress and eventual cell death. 30 Additionally, genes associated with copper homeostasis included in the 15-CHRG signature modulate copper ion concentrations by regulating the expression of copper homeostasis genes. This modulation plays a crucial role in tumor proliferation, migration, and invasion, and has significant implications for chemotherapy resistance and tumor progression.31 -35 For example, upregulation of CEBPD also transactivates the induction of copper/zinc superoxide dismutase (SOD1) expression, reducing cisplatin-induced reactive oxygen species (ROS) and apoptosis to prevent or treat cisplatin resistance in the bladder or other malignancies, enhancing the efficacy of chemotherapeutic agents and thus improving patients’ prognosis. 36 And the HBEGF inhibitor CRM197 can significantly reverse chemoresistance in drug-resistant ovarian cancer cells by downregulating the NAC-1/Gadd45gip1/Gadd45 pathway, activating the pro-apoptotic JNK/p38MAPK pathway, and enhancing caspase-3 enzyme activity and apoptosis. 37 Therefore, the 15-CHRG signature could affect EOC’s prognosis by regulating tumor proliferation, migration and invasive processes.
To determine the model regulatory pathways, we also performed GSEA for high-risk and low-risk groups, and the results showed that the DEGs were mainly enriched in the apoptosis pathway and P53 pathway. As was reported, the upregulation of P53 could promote cancer cell apoptosis by enhancing the function of driving pro-apoptotic gene expression after cell stress or injury, which leads to favorable ovarian cancer treatment and delays disease progression. 38 Moreover, the KEGG pathway and GO enrichment analysis revealed that the DEGs were mainly concentrated in pathways associated with protein synthesis, hydrolysis metabolism and protein transport pathways. Previous studies have found that tumorigenic progression may be regulated by the metabolism of proteins such as copper transport proteins. For example, it was shown that the high-affinity copper transporter (HCtr1), copper chaperone protein (ATOX1) and copper export protein (ATP7A and ATP7B) may affect platinum uptake, intracellular shuffling and export, respectively, by regulating copper homeostasis, thus affecting platinum sensitivity in ovarian cancer patients. 39 In addition, the transcription factor Sp1 controls multiple cellular processes, including apoptosis, DNA damage response, angiogenesis and immune response, and promotes chemoresistance, metastasis and amino acid metabolism, thus affecting patient prognosis.40,41 In contrast, copper deficiency enhances the interaction of Sp1 with DNA and increases Sp1 expression, which in turn upregulates hCtr1, sensitizing ovarian cancer patients to platinum chemotherapy and prolonging their progression-free survival.40,42 Therefore, multiple enrichment analyses indicated that the 15-CHRG signature could regulate the P53 pathway, apoptosis pathway, and protein synthesis and hydrolysis pathway and thus affect the prognosis of EOC.
We also performed TIC analysis for high-risk and low-risk groups to understand immune-related mechanisms. The results of TIC analysis found that resting mast cell infiltration were increased in the high-risk group and significantly related to the risk score. However, the correlation coefficient (R-value) between them was low. Some biological phenomena, especially in complex diseases like cancer, often exhibit subtle yet biologically meaningful interactions that might not be reflected in high R values. The weak correlations could still be important, particularly when considering multifactorial influences. Previous studies have shown that any tumor-infiltrating mast cells in ovarian cancer can promote tumor immune evasion through increasing pro-tumor cell infiltration and impaired anti-tumor immune function, thus leading to poor prognosis. 43 Therefore, TIC analysis suggested that EOC patients in the high-risk group are immune tolerant, and the 15-CHRG signature may provide potential clues for patients to select more effective antitumor immunotherapy.
In this study, we constructed and validated a 15-CHRG prognostic model related to copper homeostasis, which significantly enhances the predictive accuracy of outcomes in patients with EOC. This model categorized patients into high-risk and low-risk groups based on generated risk scores, with high-risk patients exhibiting poorer prognoses. These insights deepen our understanding of the roles that copper homeostasis-related genes play in EOC, potentially guiding more personalized treatment approaches and identifying novel therapeutic targets. However, the study faces limitations such as reliance on data from TCGA, which mainly involves specific ethnic groups and a limited number of cases, and lacks external validation. This could affect the generalizability of our findings across different clinical settings. Moreover, the complexity of the CHRG gene pathways involved in EOC requires more detailed investigation to fully elucidate their roles and impacts on the disease.
Conclusion
In conclusion, a 15-CHRG signature could accurately forecast the prognosis of EOC and may act as a promising prognostic molecular signature and have therapeutic implications for EOC patients.
Supplemental Material
sj-doc-1-cix-10.1177_11769351241272400 – Supplemental material for Identification of Copper Homeostasis-Related Gene Signature for Predicting Prognosis in Patients with Epithelial Ovarian Cancer
Supplemental material, sj-doc-1-cix-10.1177_11769351241272400 for Identification of Copper Homeostasis-Related Gene Signature for Predicting Prognosis in Patients with Epithelial Ovarian Cancer by Ping Yan, Yueqin Tian, Xiaojing Li, Shuangmei Li, Haidong Wu and Tong Wang in Cancer Informatics
Footnotes
Acknowledgements
The authors express their gratitude to the participants and investigators of the repository study.
Funding:
The author(s) disclosed receipt of the following financial support for the research, authorship, and/or publication of this article: This research was funded by the National Natural Science Foundation of China (No. 81070125, 81270213, 81670306); the Science and Technology Foundation in Guangdong Province (No. 2010B031600032, 2014A020211002); the National Natural Science Foundation of Guangdong Province (No. 2017A030313503); the Science and Technology Foundation in Guangzhou City (No. 201806020084); the Fundamental Research Funds for the Central Universities (No. 13ykzd16, 17ykjc18); the Futian District Health and Public Welfare Research Project of Shenzhen City (No. FTWS2019001, FTWS2021016, FTWS2022018, FTWS2023064), the Shenzhen Fundamental Research Program (No. JCYJ20190808101405466, JCYJ20210324115003008, JCYJ20220530144404009).
Declaration Of Conflicting Interests:
The author(s) declared no potential conflicts of interest with respect to the research, authorship, and/or publication of this article.
Author Contribution
TW and HW contributed to the overall design, concept, and oversight. PY, YT and XL developed the methods, conducted the analyses, and wrote the manuscript. YT, XL and SL provided advice on machine learning and statistical analysis. All authors reviewed and approved the manuscript.
Availability of Data and Materials
The Gene-expression profiles of 378 EOC cases and their corresponding clinic records were extracted from the Cancer Genome Atlas (TCGA) website (https://portal.gdc.cancer.gov/projects/TCGA). Genes involved in copper homeostasis were retrieved from the Malacards database (![]() ).
).
Ethics Approval and Consent to Participate
This study used publicly available summary statistics from public repositories. All original studies involved by public repositories were approved by the appropriate ethical review boards and participants provided informed consent. In addition, no individual-level data were analyzed in this study. Therefore, no new ethical review board approval was required.
Consent for Publication
Not applicable.
Supplemental Material
Supplemental material for this article is available online.
References
Supplementary Material
Please find the following supplemental material available below.
For Open Access articles published under a Creative Commons License, all supplemental material carries the same license as the article it is associated with.
For non-Open Access articles published, all supplemental material carries a non-exclusive license, and permission requests for re-use of supplemental material or any part of supplemental material shall be sent directly to the copyright owner as specified in the copyright notice associated with the article.