
Abstract
Vigorous angiogenesis is one of the reasons for the poor prognosis of glioma. A number of studies have shown that long non-coding RNA can affect a variety of biological behaviors of tumors. However, the influence of long non-coding RNAs on glioma vascular endothelial cells remains unclear. To simulate the glioma microenvironment, we applied glioma-conditioned medium to human cerebral microvascular endothelial cells. The long non-coding RNA PVT1 was found to be highly expressed in glioma vascular endothelial cells. Cell Counting Kit-8, migration, and tube formation assays showed that PVT1 overexpression promoted glioma vascular endothelial cells proliferation, migration, and angiogenesis. We also found that PVT1 overexpression upregulated the expression of the autophagy-related proteins Atg7 and Beclin1, which induced protective autophagy. Bioinformatics software and dual-luciferase system analysis confirmed that PVT1 acts by targeting miR-186. In addition, our study showed that miR-186 could target the 3′ untranslated region of Atg7 and Beclin1 to decrease their expression levels, thereby inhibiting glioma-conditioned human cerebral microvascular endothelial cell autophagy. In conclusion, PVT1 overexpression increased the expression of Atg7 and Beclin1 by targeting miR-186, which induced protective autophagy, thus promoting glioma vascular endothelial cell proliferation, migration, and angiogenesis. Therefore, PVT1 and miR-186 can provide new therapeutic targets for future anti-angiogenic treatment of glioma.
Introduction
Glioma is the most common intracranial malignant tumor. Due to its invasive growth, glioma can rarely be totally resected, and thus, radiotherapy and chemotherapy are typical after surgery. Even after standard treatment, the prognosis of glioblastoma remains poor, with an average survival time of only 12–15 months. 1 The failure of traditional radiotherapy and chemotherapy to improve patient survival past this window has led to increased attention paid to developing therapies directed at molecular targets.2–4 As a prototypical angiogenesis-dependent solid tumor, glioma characteristically promotes the growth of tumor blood vessels, which is one of the main reasons for the failure of conventional therapy. 5 Developing anti-angiogenic targeted chemotherapy by exploring the regulatory factors of tumor suppressor genes is promising for glioma treatment.
Angiogenesis is the formation of new blood vessels from original ones, which is the main mechanism of tumor blood supply delivery and closely correlates with malignant biological behaviors including growth, invasion, and metastasis.6,7 This specific process includes hydrolysis of the extracellular matrix; endothelial cell proliferation, migration, and differentiation; and tube formation. 8 In the glioma microenvironment, tumor cells can directly affect the biological behavior of glioma microvascular endothelial cells by secreting multiple angiogenesis regulating factors such as vascular endothelial cell growth factor (VEGF) and basic fibroblast growth factor (bFGF). Tumor cells can also indirectly modulate endothelial cell function by altering the endogenous expression of target genes in endothelial cells, such as miR-144 and Krüppel-like factor 6, thus regulating tumor angiogenesis.9–12
With a length between 200 bp and 100 kb, long non-coding RNA (lncRNA) plays important role in gene function regulation, such as epigenetic regulation and transcriptional regulation.13,14 Clinically, abnormalities in lncRNA are associated with various tumor and non-tumor diseases. Studies have shown that expression of lncRNA-HOTAIR is upregulated in colorectal cancer, hepatocellular carcinoma, pancreatic cancer, and gastric cancer, and positively correlated with malignant biological behaviors of tumor.15–18 As for vascular endothelial cells, the research of Cai et al. 11 showed that lncRNA-TUG1 regulated blood-tumor barrier permeability in glioma by targeting miR-144. Located at 8q24, lncRNA-PVT1 has been identified as a candidate oncogene. It was found to be highly expressed in a series of human tumors, including breast and ovarian cancers, acute myeloid leukemia, and Hodgkin lymphoma.19–21 Nonetheless, the expression and biological effect of PVT1 on glioma vascular endothelial cells remain unknown.
MicroRNA (miRNA) is single non-coding RNA of about 22 bp in length that takes part in cell proliferation, apoptosis, differentiation, and other basic processes.22,23 The relationship between miRNA and tumorigenesis has gained wide attention. For instance, miR-195-5p was shown to inhibit prostate cancer cell migration and invasion. 24 For vascular endothelial cells, miR-497 induced apoptosis of human umbilical vein endothelial cells (HUVECs) through interaction with VEGFR2 and the downstream PI3K/AKT pathway. 25 miR-186, located on 1p31.1, has shown both oncogenic and tumor suppressive effects. It is upregulated in pancreatic and endometrial cancers, but downregulated in non-small cell lung cancer, glioma, and medulloblastoma.26–30 However, the function of miR-186 in glioma vascular endothelial cells remains unclear.
Autophagy is a dynamic physical reaction that helps to maintain ecological balance in which abnormal protein and organelles are degraded and essential nutrients are supplied when cells are under stress. With further study, increasing evidence has shown that autophagy exists in various organs and systems, and modulates multiple diseases. 31 Researchers have found in an ischemia reperfusion model that both mechanistic target of rapamycin (mTOR)-dependent and mTOR-independent autophagy was induced by rapamycin, and lithium carbonate inhibited brain microvascular endothelial cell apoptosis, decreased reactive oxygen species (ROS) levels and maintained the integrity of the blood–brain barrier. 32 Whether autophagy affects the biological behaviors of glioma vascular endothelial cells is yet to be determined.
In this study, we aimed to investigate the expression levels of PVT1 and miR-186 in glioma microvascular endothelial cells and determine their modulation effects on endothelial cells autophagy and angiogenesis as well as the underlying mechanisms of the process.
Materials and methods
Reagents and antibodies
Endothelial basal medium-2 (EBM-2) was purchased from Lonza (Walkersville, MD, USA). Fetal bovine serum (FBS) “Gold” and 10 mM 4-(2-hydroxyethyl)-1-piperazineethanesulfonic acid (HEPES) were purchased from PAA Laboratories GmbH (Pasching, Austria). Penicillin-streptomycin and chemically defined lipid concentrate were purchased from Invitrogen (Life Technologies Corporation, Carlsbad, CA, USA). Cultrex rat collagen I was obtained from R&D Systems (Minneapolis, MN, USA). Human bFGF, hydrocortisone, 3-methyladenine (3-MA), and ascorbic acid were obtained from Sigma-Aldrich (St. Louis, MO, USA). High-glucose Dulbecco’s modified Eagle medium (DMEM), DMEM F12 mixed medium, and FBS were purchased from Gibco (Life Technologies Corporation). Cell Counting Kit-8 (CCK-8) was purchased from Beyotime Institute of Biotechnology (Jiangsu, China). Antibodies such as LC3, p62/SQSTM1, Beclin1, and Atg7 were purchased from Abcam (Cambridge, MA, USA). Antibodies against glyceraldehyde-3-phosphate dehydrogenase (GAPDH) and secondary antibodies were purchased from Santa Cruz Biotechnology (Santa Cruz, CA, USA).
Cell culture and treatment
The human cerebral microvascular endothelial cell line hCMEC/D3 was kindly provided by Dr Couraud (Institut Cochin, Paris, France). Cells (passage 30–35) were cultured in tissue culture flasks coated with 150 µg/mL of cultrex rat collagen I. Primary glioma cells were derived from intraoperative tissue samples from patients who were diagnosed with primary glioblastoma. Primary astrocytes derived from patients undergoing temporal lobe resection for the surgical treatment of intractable epilepsy were used as negative controls (NCs). Detailed culture methodology has been described previously.33,34 Immunohistochemistry against glial fibrillary acidic protein (GFAP) and beta-tubulin III was used to identify glioma cells (or astrocytes). Cells were stained with anti-GFAP (1:100, Abcam, Cambridge, MA, USA) and anti-beta-tubulin III (1:100). Cells were also counterstained with DAPI (4′,6-diamidino-2-phenylindole) to identify nuclei.
Glioma-conditioned medium (GCM) was collected from the indicated primary human glioma cells grown in 100-mm-diameter Petri dishes. Primary astrocyte-conditioned medium (ACM) was used as a NC. Conditioned medium was prepared from glioblastoma (or astrocyte) cell culture grown to near confluency. After being washed twice with serum-free medium, cells were incubated in serum-free EBM-2 medium in a humidified incubator at 37°C and 5% CO2 for 24 h. The supernatant was harvested, centrifuged at 2000g at 4°C for 10 min, and supplemented with 5% FBS “Gold,” 1% penicillin-streptomycin, 1% chemically defined lipid concentrate, 1 ng/mL bFGF, 1.4 µM hydrocortisone, 5 µg/mL ascorbic acid and 10 mM HEPES, epidermal growth factor (EGF), and hydrocortisone prior to use. Primary ACM was used as a NC.
For autophagy inhibition by 3-MA, cells were incubated in medium containing 5 mM 3-MA for 24 h. For apoptosis inhibition by Z-VAD-FMK, cells were incubated in medium containing 50 µΜ Z-VAD-FMK for 24 h.
Quantitative real-time and reverse transcription polymerase chain reaction
Total RNA were extracted from cells using Trizol reagent (Life Technologies Corporation). RNA concentration and quality were determined by the 260/280 nm ratio using a NanoDrop Spectrophotometer (ND-100). The One-Step SYBR PrimeScript RT-PCR Kit (Perfect Real Time; Takara Bio, Inc., Otsu, Japan) was used for quantitative real-time and reverse transcription polymerase chain reaction (qRT-PCR). The primers for PVT1 were 5′-GGGGAATAACGCTGGTGGAA-3′ and 5′-CCCATGGACATCCAAGCTGT-3′; those for GAPDH were 5′-GGTGAAGGTCGGAGTCAACG-3′ and 5′-CCATGTAGTTGAGGTCAATGAAG-3′. The TaqMan MicroRNA Reverse Transcription Kit (Applied Biosystems, Foster City, CA, USA) was used for miRNA reverse transcription, and qRT-PCR was conducted using TaqMan Universal Master Mix II with TaqMan miRNA assays for miR-186-5p and U6, respectively. U6 and GAPDH were used as endogenous controls for miRNA and gene expression detection, respectively. Expressions were normalized to endogenous controls and the relative quantification (2−ΔΔCt) method was used to calculate fold change.
Cell transfection
PVT1 full length (pEX2-PVT1) plasmid, eight PVT1 short hairpin RNA plasmids (sh-PVT1, PVT1-homo-132, PVT1-homo-176, PVT1-homo-242, PVT1-homo-857, PVT1-homo-911, PVT1-homo-1055, PVT1-homo-1379, and PVT1-homo-1666) and their respective non-targeting sequence (negative control, NC); and miR-186-5p plasmid, sh-miR-186-5p plasmid and their respective non-targeting sequence (negative control, NC) were synthesized (GenePharma, Shanghai, China). The sequence of sh-PVT1 was 5′-CACCGGGTTGAGATCTCTGTTTACTTTCAAAGAGAAGTAAACAGAGATCTCAACCCTTTTTTG-3′, 5′-GATCCAAAAAAGGGTTGAGATCTCTGTTTACTTCTCTTGAAAGTAAACAGAGATCTCAACCC-3′. The sequence of sh-NC was 5′-CACCGTTCTCCGAACGTGTCACGTCAAGAGATTACGTGACACGTTCGGAGAATTTTTTG-3′, 5′-GATCCAAAAAATTCTCCGAACGTGTCACGTAATCTCTTGACGTGACACGTTCGGAGAAC-3′. The sequence of miR-186-5p was 5′-CACCGCAAAGAATTCTCCTTTTG GGCTTTCAAGAGAAGCCCAAAGAGAATTCTTTGTTTTTG-3′, 5′-GATCCAAAAAACAAAGAATTCTCTTTGGGCTTCTCTTGAAAGCCCAAAAGGAGAATTCTTTGC-3′. The sequence of sh-miR-186-5p was 5′-CACCGCGCCCAA AAGGAGAATTCTTTGTTCAAGAGACAAAGAATTCCTTTTGGGCTTTTTTTG-3′, 5′-GATCCAAAAAAAGCCCAAAAGGAATTCTTTGTCTCTTGAACAAAGAATTCTCCTTTTGGGCTC-3′. The sequence of the NC for miR-186-5p and sh-miR-186-5p (pGPU6-NC) was 5′-CACCGTTCTCCGAACGTGTGT CACGTCACGTCAAGAGATTACGTGACACGTTCGGAGAATTTTTG-3′, 5′-GATCCAAAAAATTCTCCGAACGTGTCACGTGTCACGTAATCTCTTGACGTGACACGTTCGGAGAAC-3′. Cells were seeded into 24-well plates (Corning, NY, USA) until they were at 50%–70% confluence and then transfected using Opti-MEM I and Lipofectamine 2000 reagent (Life Technologies Corporation). After 6-h incubation, the medium was replaced with EBM-2 medium with 10% FBS. The applicable stably transfected cells were selected using G418 screening. Overexpression and silencing efficiency were analyzed using qRT-PCR. To determine the effect of PVT1 on glioma-conditioned hCMECs, cells were divided into five groups: the control, pEX2-PVT1-NC (transfected with empty plasmid), pEX2-PVT1, sh-NC, and sh-PVT1. To determine the effect of miR-186-5p on glioma-conditioned hCMECs, cells were divided into four groups: the control, pGPU6-NC (transfected with empty plasmid), pGPU6-miR-186 (transfected with miR-186-5p plasmid), and pGPU6-sh-miR-186 (transfected with sh-miR-186-5p plasmid). To determine whether PVT1-mediated regulation of miR-186 expression could regulate the behavior of endothelial cells, cells were divided into nine groups: the control, PVT1(+)-NC+miR-186(+)-NC (transfected with both pEX2-PVT1-NC and pGPU6-NC), PVT1(+)+miR-186(+) (transfected with both pEX2-PVT1 and miR-186-5p), PVT1(+)-NC+miR-186(−)-NC (transfected with both pEX2-PVT1-NC and pGPU6-NC), PVT1(+)+miR-186(−) (transfected with both pEX2-PVT1 and sh-miR-186-5p), PVT1(−)-NC+miR-186(+)-NC (transfected with both sh-NC and pGPU6-NC), PVT1(−)+miR-186(+) (transfected with both sh-PVT1 and miR-186-5p), PVT1(−)-NC+miR-186(−)-NC (transfected with both sh-NC and pGPU6-NC), and PVT1(−)+miR-186(−) (transfected with both sh-PVT1 and sh-miR-186-5p).
Cell proliferation assay
Endothelial cells (ECs) were seeded in 96-well plates at a density of 2000 cells/well, and cell viability was assayed using the CCK-8 (Beyotime Institute of Biotechnology) according to the instructions provided by the manufacturer. 10 µL of CCK-8 was added into each well and cells were incubated for another 2 h in a humidified incubator. Optical density was measured at 450 nm. Five replicate wells were set up in each group and three independently repeated experiments were performed.
Cell migration assay
EC migration in vitro was assayed using a Transwell chamber (Costar, Corning, NY, USA) with a polycarbonic membrane (6.5 mm in diameter and 8 µm pore size). ECs were trypsinized and suspended into single cells in serum-free medium at a density of 5 × 10⁵ cells/mL. 100 µL of the cell suspension was added to the upper chamber, and 600 µL of GCM supplemented with 10% FBS was added to the lower chamber. Cells were incubated for 12 h at 37°C. Non-migrating cells on the top surface of the membrane were removed with cotton swabs. Cells that migrated to the lower surface of the membrane were fixed with 3:1 methanol:glacial acetic acid, stained with 20% Giemsa solution for 30 min at 37°C, and washed twice with phosphate buffer saline (PBS). Stained cells were observed under an inverted microscope to count the cell number within five randomly chosen fields at 200 × magnification, and the average number was calculated.
Tube formation assay
We used a standard Matrigel assay to evaluate in vitro angiogenesis activity by quantifying tube formation as previously described. 35 In total, 48-well culture plates were coated with 200 µL Matrigel (BD Biosciences, Bedford, MA, USA) per well and then allowed to polymerize for 30 min at 37°C. Confluent cells were suspended in fresh GCM at a density of 1.5 × 10⁵ cells/mL. 100 µL of the cell suspension was seeded in the wells of a 48-well culture plate with polymerized Matrigel and incubated at 37°C for 12 h. Each culture was photographed at 100 × magnification using an Olympus DP71 immunofluorescence microscope (Olympus, Tokyo, Japan), and total tubule length and number of tubule branches were measured using Chemi Imager 5500 V2.03 software.
Immunofluorescence assay
An immunofluorescence assay was performed to detect the expression and distribution of LC3. Cells were cultured on insert filters, fixed with 4% paraformaldehyde for 20 min and permeabilized for 10 min in PBS containing 0.2% Triton X-100, followed by incubation in 5% bovine serum albumin (BSA) blocking buffer for 2 h at room temperature. Subsequently, cells were incubated with primary antibody for LC3 (1:50; Abcam, Cambridge, UK) diluted in blocking buffer overnight at 4°C. After three washes with PBS, cells were incubated with Alexa Fluor 555-labeled goat anti-rabbit IgG secondary antibody (1:500; Beyotime Institute of Biotechnology) for 1 h. Nuclei were counterstained with 0.5 µg/mL DAPI. Staining was analyzed using immunofluorescence microscopy (Olympus) and merged with Chemi Imager 5500 V2.03 software.
Transmission electron microscopy
To morphologically demonstrate the induction of autophagy in endothelial cells, we performed an ultrastructural analysis as described by Liu et al. 36 Cells were fixed in ice-cold 2.5% glutaraldehyde (electron microscopy grade) in PBS overnight at 4°C. Fixed samples were washed three times with PBS. After fixation, samples were post-fixed in 1% osmium tetroxide containing 0.1% potassium ferricyanide for 1 h and then subjected to electron microscopy analysis. Representative areas were chosen for ultrathin sectioning and viewed with a Philips EM 400 transmission electron microscope at an accelerating voltage of 80 kV. Digital images were obtained by an AMT imaging system (Advanced Microscopy Techniques Corp., Danvers, MA, USA).
Western blot assay
Cells were lysed and protein in supernatant extracts was quantified using a BCA Protein Assay Kit (Beyotime Institute of Biotechnology). Total cell lysates containing 40 µg of protein were fractionated using SDS-PAGE (sodium dodecyl sulfate–polyacrylamide gel electrophoresis) and transferred onto polyvinylidene fluoride (PVDF) membranes (Millipore, Billerica, MA, USA). After blocking with 5% non-fat dry milk in Tris BufferedSalineTween-20 (TBST) for 2 h, membranes were incubated with primary antibody (anti-GAPDH antibody diluted at 1:1000; anti-Atg7, anti-Beclin1, and anti-LC3 antibodies diluted at 1:500) at 4°C overnight. After three washes with PBS-Tween (20 mM Tris, 137 mM NaCl, 0.1% Tween-20; pH 7.6), membranes were incubated with the corresponding horseradish peroxidase (HRP)-conjugated secondary antibody (1:5000) at room temperature for 2 h. Protein bands were visualized with enhanced chemiluminescence (ECL; Santa Cruz Biotechnology) and detected using the ECL detection system (Thermo Scientific, Waltham, MA, USA). Protein bands were then scanned using Chemi Imager 5500 V2.03 software, and integrated light density values (IDVs) were calculated with Fluor Chen 2.0 software and normalized with those of GAPDH.
Reporter vector construction and luciferase assays
PVT1, Atg7, and Beclin1 3′-UTR sequences were amplified by PCR and cloned into a pmirGlo Dual-luciferase miRNA Target Expression Vector (Promega, Madison, WI, USA) to construct 3′-UTR-luciferase reporter vectors (PVT1-WT, Atg7-WT, and Beclin1-WT; GenePharma). The sequence of the putative binding site was replaced as indicated (PVT1-Mut, Atg7-Mut, and Beclin1-Mut) to mutate the putative binding site of miR-186 in the 3′-UTR-containing vector. HCMECs were seeded in 96-well plates and cells were co-transfected with PVT1-WT (or PVT1-Mut), Atg7-WT (or Atg7-Mut) or Beclin1-WT (or Beclin1-Mut), and miR-186 plasmids when they reached 50%–70% confluence. Luciferase activity was measured 48 h after transfection using a Dual-Luciferase Reporter Assay Kit (Promega). Cells were divided into five groups, respectively: the control, PVT1-Wt+miR-186(+)NC, PVT1-Wt+miR-186(+), PVT1-Mut+miR-186(+)NC, and PVT1-Mut+miR-186(+); the control, Atg7-WT+miR-186-NC, Atg7-WT+miR-186, Atg7-Mut+miR-186-NC, and Atg7-Mut+miR-186; or the control, Beclin1-WT+miR-186-NC, Beclin1-WT+miR-186, Beclin1-Mut+miR-186-NC, and Beclin1-Mut+miR-186.
RNA-binding protein immunoprecipitation assay
RNA-binding protein immunoprecipitation (RIP) was assayed using a Magna RNA-binding Protein Immunoprecipitation Kit (Millipore) according to the instructions provided by the manufacturer. Briefly, glioma vascular endothelial cells were lysed in complete RNA lysis buffer. Whole cell lysate was incubated with RIP buffer containing magnetic beads conjugated with human anti-Argonaute2 (Ago2) antibody (Millipore) or NC normal mouse IgG (Millipore). Samples were incubated with Proteinase K and then immunoprecipitated RNA was isolated. RNA concentration was measured by a spectrophotometer (NanoDrop, Thermo Scientific), and RNA quality was assessed using a bioanalyzer (Agilent, Santa Clara, CA, USA). Purified RNAs were extracted and analyzed by qRT-PCR to demonstrate the presence of the binding targets.
Statistical analysis
Statistical analysis was performed using SPSS 18.0 statistical software (IBM, Armonk, NY, USA). One-way analysis of variance (ANOVA) followed by Bonferroni post-hoc analysis was used to analyze differences between groups. Data are presented as means ± standard deviations (SDs). The value of p < 0.05 was considered statistically significant.
Results
PVT1 is highly expressed and miR-186 is minimally expressed in glioma vascular endothelial cells
PVT1 and miR-186 expression levels in hCMECs grown in primary ACM and GCM were detected by qRT-PCR. PVT1 expression in hCMECs grown in GCM increased as compared to hCMECs grown in ACM (p < 0.05; Figure 1(a)). The miR-186 expression in hCMECs grown in GCM decreased as compared to hCMECs grown in ACM (p < 0.05; Figure 1(b)).

PVT1 and miR-186 expression in hCMEC cultured by primary astrocyte-conditioned medium and glioma-conditioned medium: (a) expression levels of PVT1 in hCMEC cultured by astrocyte-conditioned medium and glioma-conditioned medium and (b) expression levels of miR-186 in endothelial cells cultured by astrocyte-conditioned medium and glioma-conditioned medium. Data are presented as the mean ± SD (n = 5, each group). *p < 0.05 versus astrocyte-conditioned medium.
PVT1 overexpression promoted proliferation, migration, and tube formation of glioma vascular endothelial cells
After determining the expression level of PVT1 in glioma vascular endothelial cells, we further investigated the effect of PVT1 on proliferation, migration, and tube formation of glioma vascular endothelial cells. Stably transfected endothelial cell lines with overexpression and knockdown of PVT1 were established; the expression of PVT1 was 108.8% higher in the pEX2-PVT1 group than in the pEX2-PVT1-NC group and 68.72% lower in the sh-PVT1 group than in the sh-NC group (p < 0.01; Figure 2(a)). Next, a CCK-8 assay was performed to measure the effect of PVT1 on proliferation. The viability of the pEX2-PVT1 group was higher than that of the pEX2-PVT1-NC group, while viability was lower in the sh-PVT1 group than in the sh-NC group (p < 0.05; Figure 2(b)). A cell migration assay demonstrated that, as compared to the pEX2-PVT1-NC group, the pEX2-PVT1 group showed an increase in migrated cell number, whereas the sh-PVT1 group showed a decrease in migrated cell number as compared to the sh-NC group (p < 0.05; Figure 2(c)). The results of the tube formation assay showed that relative tubule length and number of branches were higher in the pEX2-PVT1 group than in the pEX2-PVT1-NC group, while the relative tubule length and number of branches were lower in the sh-PVT1 group as compared to the sh-NC group (p < 0.05; Figure 2(d)).
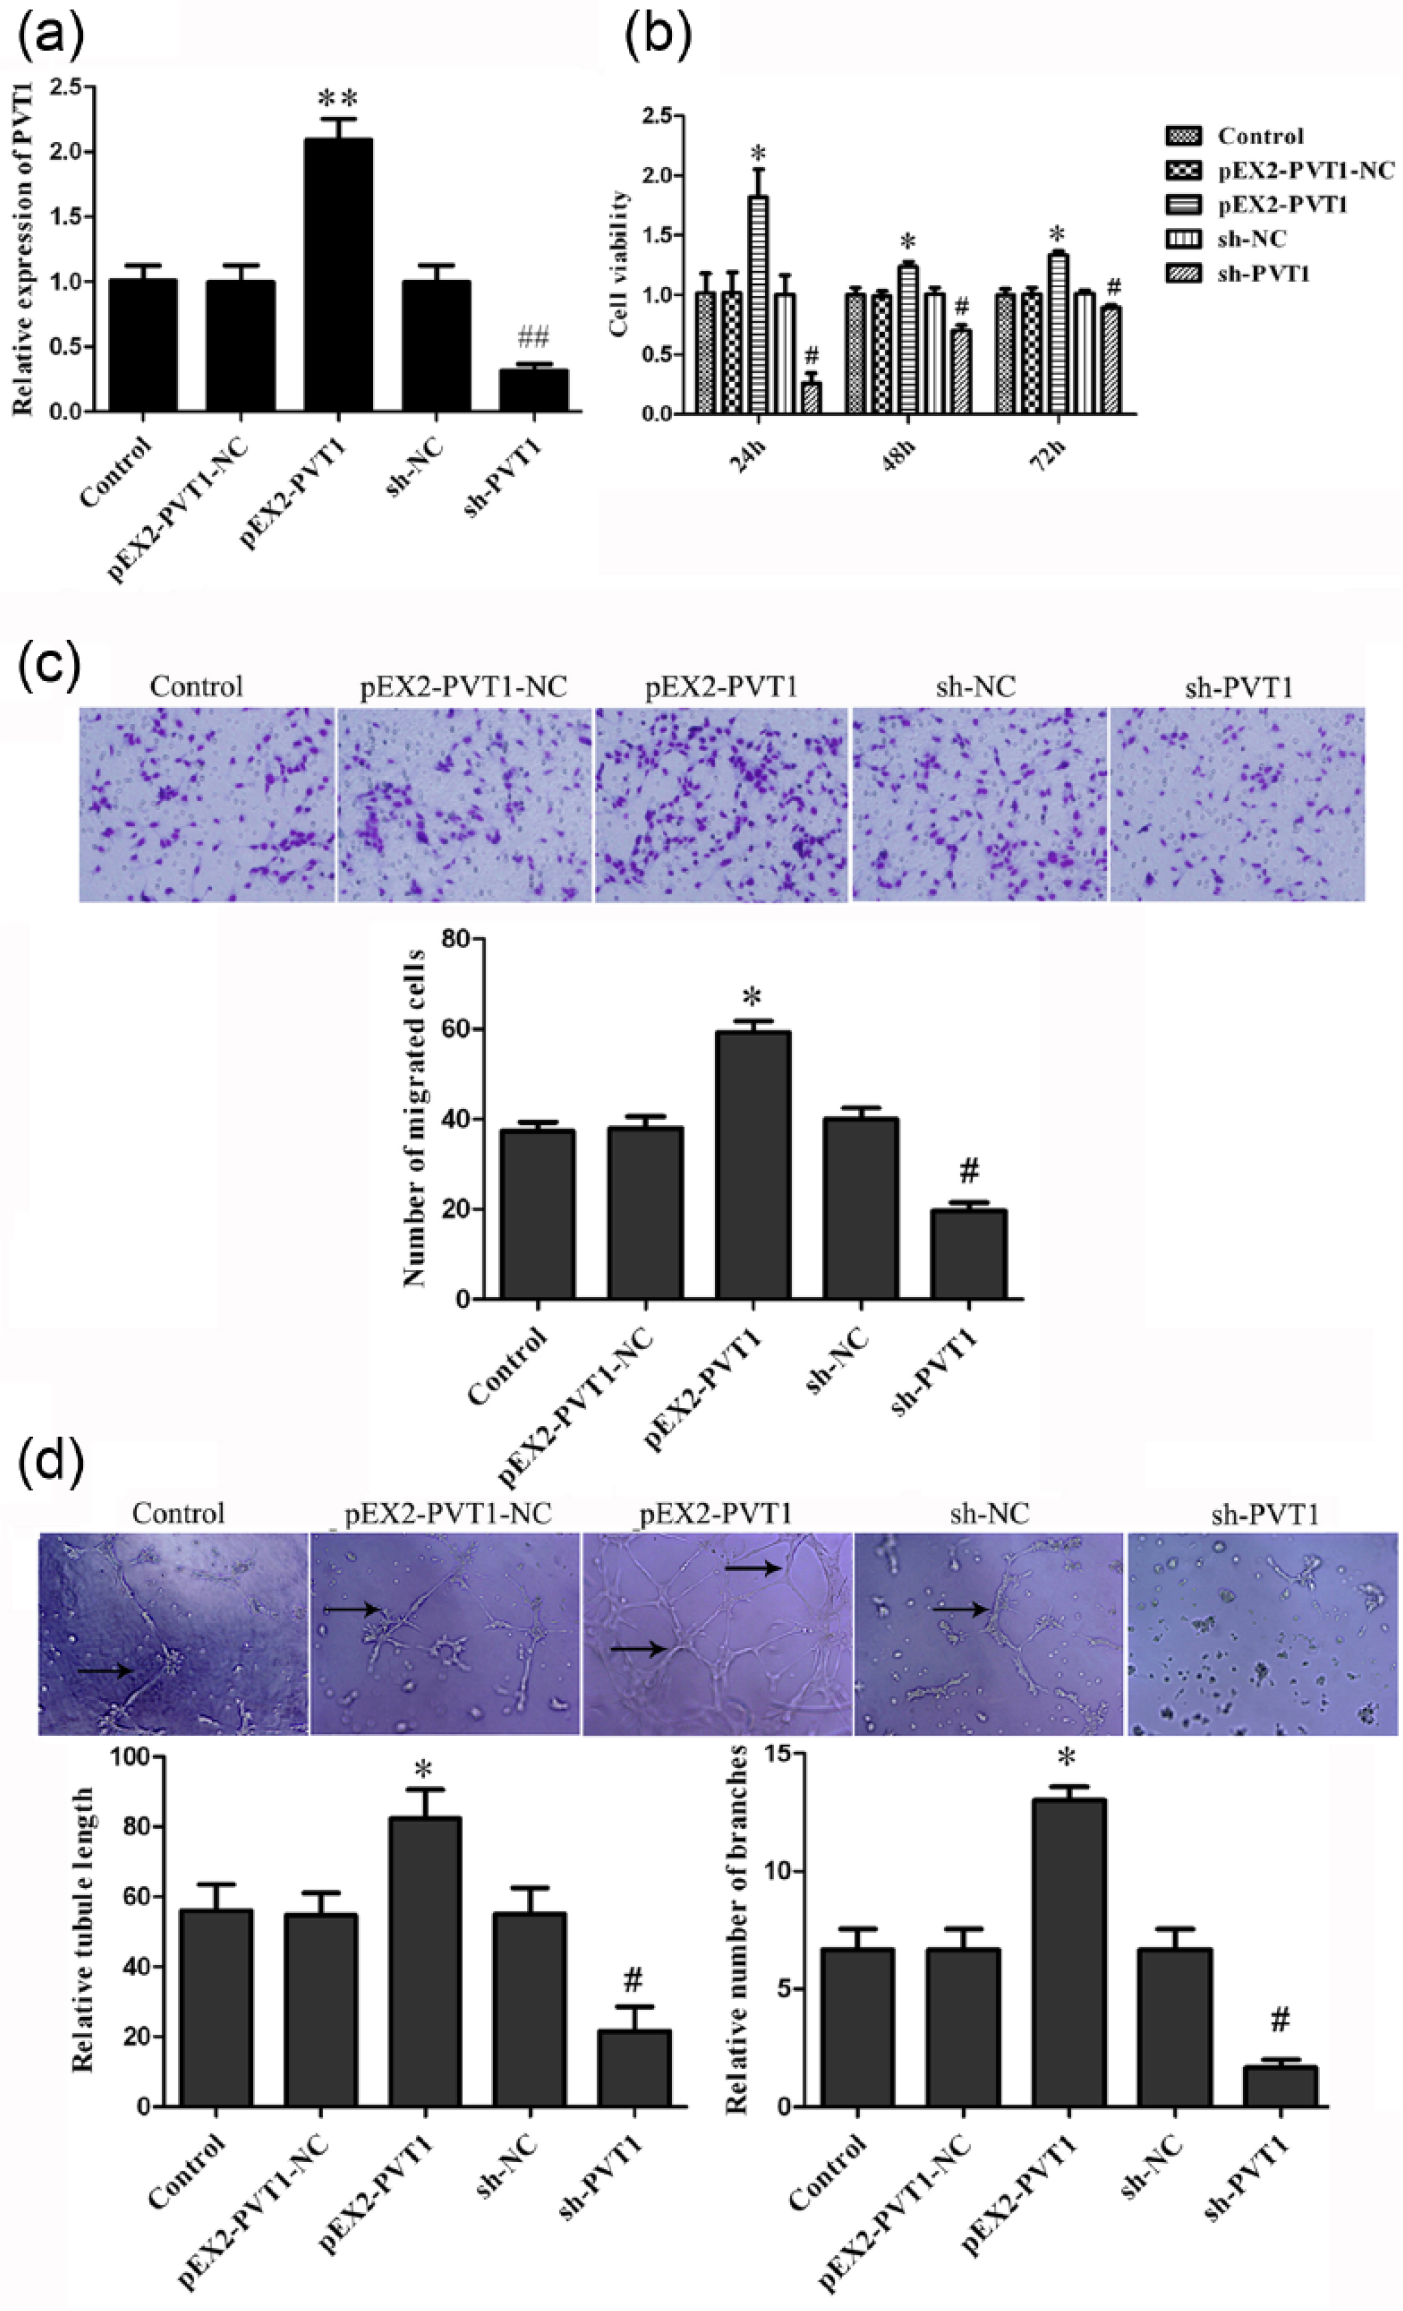
Effect of PVT1 on proliferation, migration, and tube formation of glioma vascular endothelial cells: (a) transfection efficiency of PVT1 was confirmed by real-time PCR analysis, (b) CCK-8 assay was applied to evaluate the proliferation effect of PVT1 on endothelial cells, (c) quantification of migration cells with different expression levels of PVT1, and (d) tube formation analysis of relative tubule length and number of branches of endothelial cells with different expression levels of PVT1. Representative images and accompanying statistical plots were presented. Data are presented as mean ± SD (n = 5, each). *p < 0.05 versus pEX2-PVT1-NC group; **p < 0.01 versus pEX2-PVT1-NC group; #p < 0.05 versus sh-NC group; ##p < 0.01 versus sh-NC group.
Knockdown of miR-186 promoted proliferation, migration, and tube formation of glioma vascular endothelial cells
After investigating miR-186 expression in glioma vascular endothelial cells, we further analyzed its effect on endothelial cell proliferation, migration, and tube formation. The expression of miR-186 was 107.4% higher in the pGPU6-miR-186 group than in the pGPU6-NC group and 67.52% lower in the pGPU6-sh-miR-186 group than in the pGPU6-NC group (p < 0.01; Figure 3(a)). A CCK-8 assay found that the proliferation rate was significantly lower in the pGPU6-miR-186 group (p < 0.01; Figure 3(b)) and higher in the pGPU6-sh-miR-186 group (p < 0.05; Figure 3(b)) as compared to the pGPU6-NC group. Cell migration assay results demonstrated that the pGPU6-miR-186 group had fewer migrated cells while the pGPU6-sh-miR-186 group had more migrated cells as compared to the pGPU6-NC group (p < 0.05; Figure 3(c)). The results of the tube formation assay showed that the pGPU6-miR-186 group had decreased relative tubule length and number of branches while the pGPU6-sh-miR-186 group had enhanced tube formation in vitro (p < 0.05; Figure 3(d)).

Effect of miR-186 on proliferation, migration, and tube formation of glioma vascular endothelial cells: (a) transfection efficiency of miR-186 was confirmed by real-time PCR analysis, (b) CCK-8 assay was applied to evaluate the proliferation effect of miR-186 on endothelial cells, (c) quantification of migration cells with different expression levels of miR-186, and (d) tube formation analysis of relative tubule length and number of branches of endothelial cells with different expression levels of miR-186. Representative images and accompanying statistical plots were presented. Data are presented as mean ± SD (n = 5, each). *p < 0.05 versus pGPU6-NC group; **p < 0.01 versus pGPU6-NC group.
Autophagy inhibitor 3-MA could reverse the effect of PVT1 overexpression on proliferation of glioma vascular endothelial cells
To further explore the underlying mechanism of the effect of PVT1 on endothelial cells, we applied the autophagy inhibitor 3-MA and the apoptosis inhibitor Z-VAD-FMK to the PVT1 overexpression group before performing a CCK-8 assay to test proliferation. The viability of the pEX2-PVT1 group was higher than that of the control group, as described above (p < 0.05; Figure 4). However, the viability of the 3-MA+pEX2-PVT1 group was lower than that of the pEX2-PVT1 group (p < 0.05; Figure 4) but was not significantly different from that of the control group (p > 0.05; Figure 4). The viability of the Z-VAD-FMN+pEX2-PVT1 group was higher than that of the control group (p < 0.05; Figure 4) but not significantly different from that of the pEX2-PVT1 group (p > 0.05; Figure 4).

Effect of 3-MA and Z-VAD-FMK on PVT1 overexpression of glioma vascular endothelial cells. CCK-8 assay was applied to evaluate the proliferation effect of autophagy inhibitor 3-MA and apoptosis inhibitor Z-VAD-FMK on PVT1 overexpression endothelial cells. Data are presented as mean ± SD (n = 5, each). *p < 0.05 versus Control group.
PVT1 bound to and negatively regulated by miR-186
According to bioinformatics databases (RNAhybrid), we predicted that PVT1 might be associated with miR-186 binding sites. Furthermore, a dual-luciferase gene reporter assay showed that PVT1 could bind to miR-186 at the predicted binding sites. Quantitative RT-PCR demonstrated that miR-186 expression was downregulated in the pEX2-PVT1 group as compared to the pEX2-PVT1-NC group, whereas it was upregulated in the sh-PVT1 group as compared to the sh-NC group (p < 0.01; Figure 5(a)). A dual-luciferase gene reporter assay showed that luciferase activity in the PVT1-Wt+miR-186(+) group was lower than that in the PVT1-Wt+miR-186(+)NC group (p < 0.05; Figure 5(b)), indicating that PVT1 binds to miR-186 and negatively regulates its expression. To determine whether PVT1 is associated with the RNA-induced silencing complex (RISC) complex, we performed an RIP assay. The RNA levels of PVT1 and miR-186 were higher in the anti-Ago2 group than that in anti-normal IgG group (p < 0.01; Figure 5(c)).

Effect of PVT1 on the formation of autophagosome as well as the expression of miR-186, Atg7, Beclin1, LC3, and P62: (a) real-time PCR analysis for PVT1 regulated miR-186 expression of glioma vascular endothelial cells and (b) luciferase reporter assay of glioma vascular endothelial cells co-transfected with miR-186(+) or miR-186(+)NC and PVT1-Wt or the PVT1-Mut. Data are presented as the mean ± SD (n = 5, each group). *p < 0.05 versus PVT1-Wt+miR-186(+)NC groups. (c) RIP assay was performed using input from cell lysate, normal mouse IgG, or anti-Ago2. Relative expression levels of PVT1 and miR-186 were detected by quantitative real-time PCR. Data are represented as mean ± SD (n = 5, each group). &&p < 0.01 versus anti-normal IgG group. (d) High magnification of punctate aggregates were found in pEX2-PVT1 group by LC3 immunofluorescence staining, and (e) western blot analysis for PVT1 regulated Atg7, Beclin1 LC3, and P62 expression in glioma vascular endothelial cells. The IDVs of Atg7, Beclin1, and P62 are shown using GAPDH as an endogenous control. Data are presented as the mean ± SD (n = 5, each group). *p < 0.05 versus pEX2-PVT1-NC group; #p < 0.05 versus sh-NC group; **p < 0.01 versus pEX2-PVT1-NC group; ##p < 0.01 versus sh-NC group.
PVT1 overexpression induced formation of an autophagosome; upregulated the expression of Atg7, Beclin1, and LC3-II/LC3-I; and downregulated the expression of P62
LC3 immunofluorescence staining demonstrated high magnification of punctate aggregates of LC3 staining in the pEX2-PVT1 group, indicating the formation of an autophagosome (Figure 5(d)).
A western blot of autophagy-related proteins Atg7, Beclin1, LC3, and P62 found that, as compared to the pEX2-PVT1-NC group, the pEX2-PVT1 group had increased Atg7 and Beclin1 expression and decreased P62 expression (p < 0.05; Figure 5(e)), as well as an elevated LC3-II/LC3-I ratio (p < 0.01; Figure 5(e)). The sh-PVT1 group had decreased Atg7 and Beclin1 expression and LC3-II/LC3-I ratio but higher P62 expression as compared to the sh-NC group (p < 0.05; Figure 5(e)).
Knockdown of miR-186 induced formation of an autophagosome; upregulated the expression of Atg7, Beclin1, and LC3-II/LC3-I; and downregulated the expression of P62
Immunofluorescence assays and transmission electron microscopy found high magnification of punctate aggregates of LC3 staining in the pGPU6-sh-miR-186 group (Figure 6(a)).

Effect of miR-186 on the formation of autophagosome as well as the expression of Atg7, Beclin1, LC3, and P62: (a) high magnification of punctate aggregates was found in pGPU6-sh-miR-186 group by LC3 immunofluorescence staining and (b) western blot analysis for miR-186 regulated Atg7, Beclin1, LC3, and P62 expression of glioma vascular endothelial cells. The IDVs of Atg7, Beclin1, and P62 are shown using GAPDH as an endogenous control. Data are presented as the mean ± SD (n = 5, each group). *p < 0.05 versus pGPU6-NC group; **p < 0.05 versus pGPU6-NC group.
Western blot analysis of Atg7, Beclin1, LC3, and P62 showed decreased Atg7 and Beclin1 expression and LC3-II/LC3-I ratio (p < 0.05, Figure 6(b)) but increased P62 expression (p < 0.01, Figure 6(b)) in the pGPU6-miR-186 group as compared to the pGPU6-NC group, while the pGPU6-sh-miR-186 group showed the opposite (p < 0.05; Figure 6(b)).
MiR-186 binds to the 3′ untranslated regions of Atg7 and Beclin1
To investigate the targeted binding effect of miR-186 on Atg7 and Beclin1, we searched a bioinformatics database (Targetscan, miRanda). Using Targetscan, we found two putative binding sites for miR-186 in the 3′ untranslated region (UTR) of Atg7 and selected the conserved site for screening. Using miRanda, we found one putative binding site for miR-186 in the 3′UTR of Beclin1. To verify binding of miR-186 to the 3′UTRs of Atg7 and Beclin1, we performed a dual-luciferase reporter assay. The luciferase activity of the Atg7-Wt+miR-186 and Beclin1-Wt+miR-186 groups was lower than those of the Atg7-Wt+miR-186-NC and Beclin1-Wt+miR-186-NC groups, respectively, (p < 0.05, Figure 7). No significant differences were found in the Atg7-Mut+miR-186 or Beclin1-Mut+miR-186 group as compared to the Atg7-Mut+miR-186-NC or Beclin1-Mut+miR-186-NC group, respectively, (p > 0.05, Figure 7). Collectively, these data indicate that miR-186 binds to the 3′UTRs of both Atg7 and Beclin1 through the putative binding sites.

MiR-186 regulated Atg7 and Beclin1 by targeting Atg7 and Beclin1’s 3′-UTR. The predicted miR-186 binding sites in the 3′-UTR region of Atg7 (Atg7-3′-UTR-Wt) or Beclin1 (Beclin1-3′-UTR-Wt) and the designed mutant sequence (Atg7-3′UTR-Mut or Beclin1-3′UTR-Mut) were indicated. Luciferase reporter assay of HEK 293T cells transfected with Atg7-3′UTR-Wt (Atg7-WT) or the Atg7-3′UTR-Mut (Atg7-Mut)/Beclin1-3′UTR-Wt (Beclin1-WT) or the Beclin1-3′UTR-Mut (Beclin1-Mut) and the indicated miRNAs. Data are presented as the mean ± SD (n = 5, each group). *p < 0.05 versus Atg7-WT and miR-186 NC groups and Beclin1-WT and miR-186 NC groups.
PVT1 overexpression affects biological behavior of glioma vascular endothelial cells by negative regulation of miR-186
To investigate whether PVT1 affected biological behavior of glioma-conditioned hCMECs through the regulation of miR-186 and its mechanism, we simultaneously transfected endothelial cells with overexpression or knockdown vectors of both PVT1 and miR-186. A CCK-8 assay result showed that the viability of the PVT1(+)+miR-186(−) group was higher than those of both the PVT1(+)+miR-186(−)-NC (p < 0.01; Figure 8(a)) and PVT1(+)+miR-186(+) groups (p < 0.05; Figure 8(a)), while the PVT1(−)+miR-186(+) group showed lower viability than both the PVT1(−)+miR-186(+)-NC (p < 0.05; Figure 8(a)) and PVT1(−)+miR-186(−) groups (p < 0.01; Figure 8(a)).

Effect of PVT1 and miR-186 on proliferation, migration, tube formation, autophagy, and expression of Atg7, Beclin1, LC3, and P62 of glioma vascular endothelial cells: (a) CCK-8 assay was applied to evaluate the proliferation effect of PVT1 and miR-186 on endothelial cells, (b) quantification of migration cells with different expression levels of PVT1 and miR-186, and (c) tube formation analysis of relative tubule length and number of branches of endothelial cells with different expression levels of PVT1 and miR-186. *p < 0.05 versus PVT1(+)+miR-186(−)-NC group; #p < 0.05 versus PVT1(−)+miR-186(+)-NC group; pp < 0.05 versus PVT1(+)+miR-186(+) group; &p < 0.05 versus PVT1(−)+miR-186(−) group; **p < 0.01 versus PVT1(+)+miR-186(−)-NC group; &&p < 0.01 versus PVT1(−)+miR-186(−) group.
A cell migration assay showed that the PVT1(+)+miR-186(−) group had an increased number of migrated cells as compared to the PVT1(+)+miR-186(−)-NC and PVT1(+)+miR-186(+) groups (p < 0.05; Figure 8(b)), while the PVT1(−)+miR-186(+) group showed a decreased number of migrated cells as compared to the PVT1(−)+miR-186(+)-NC and PVT1(−)+miR-186(−) groups (p < 0.05; Figure 8(b)).
A tube formation assay demonstrated that the PVT1(+)+miR-186(−) group had higher relative tubule length and branch number than the PVT1(+)+miR-186(−)-NC and PVT1(+)+miR-186(+) groups (p < 0.05; Figure 8(c)), while the PVT1(−)+miR-186(+) group showed decreased relative tubule length and branch number as compared to the PVT1(−)+miR-186(+)-NC and PVT1(−)+miR-186(−) groups (p < 0.05; Figure 8(c)).
PVT1 overexpression affects autophagy-related protein expression in glioma vascular endothelial cells by negative regulation of miR-186
Immunofluorescence assays and transmission electron microscopy found high magnification of punctate aggregates of LC3 staining and autophagic vacuoles containing lamellar structures or residual digested components in the PVT1(+)+miR-186(−) group. Few autophagic ultrastructures were detected in images of other groups (Figure 9(a) and (b)).

Effect of PVT1 and miR-186 on autophagy and expression of Atg7, Beclin1, LC3, and P62 of glioma vascular endothelial cells: (a) high magnification of punctate aggregates was found in PVT1(+)+miR-186(−) group by LC3 immunofluorescence staining, (b) ultrastructural features of glioma vascular endothelial cells. An arrow and arrowhead indicate autophagosomes, and (c) western blot analysis for PVT1 and miR-186 regulated Atg7, Beclin1, LC3, and P62 expression in glioma-conditioned hCMECs. The IDVs of Atg7, Beclin1, and P62 are shown using GAPDH as an endogenous control. Representative images and accompanying statistical plots were presented. Data are presented as mean ± SD (n = 5, each). *p < 0.05 versus PVT1(+)+miR-186(−)-NC group; **p < 0.01 versus PVT1(+)+miR-186(−)-NC group; ##p < 0.01 versus PVT1(−)+miR-186(+)-NC group; ▲p < 0.05 versus PVT1(+)+miR-186(+) group; &p < 0.05 versus PVT1(−)+miR-186(−) group; ▲▲p < 0.01 versus PVT1(+)+miR-186(+) group; &&p < 0.01 versus PVT1(−)+miR-186(−) group.
Western blot analysis found that the PVT1(+)+miR-186(−) group had upregulated Atg7 and Beclin1 expression as well as LC3-II/LC3-I ratio but downregulated P62 expression as compared to the PVT1(+)+miR-186(−)-NC and PVT1(+)+miR-186(+) groups (p < 0.05; Figure 9(c)). The PVT1(−)+miR-186(+) group showed the opposite result as compared to the PVT1(−)+miR-186(+)-NC and PVT1(−)+miR-186(−) groups (p < 0.05; Figure 9(c)).
Discussion
In this study, we found that PVT1 was highly expressed in glioma vascular endothelial cells, while miR-186 had low expression in glioma vascular endothelial cells. PVT1 overexpression or knockdown of miR-186 promoted proliferation, migration, tube formation and protective autophagy, and increased the expression of Beclin1 and Atg7. PVT1 was capable of binding to miR-186 and negatively regulating its function. miR-186 targeted the 3′UTRs of Atg7 and Beclin1, inhibiting their expression. PVT1 affected proliferation, migration, angiogenesis, and autophagy through negative regulation of miR-186.
Angiogenesis is indispensable for the blood supply of a solid tumor when its diameter exceeds 2 cm. 37 As a prototypical angiogenesis-dependent solid tumor, high microvessel density in glioma correlates with tumor grade and is regarded as an independent marker of poor patient prognosis. 38 The most important components of tumor vascularity, endothelial cells, are the main target through which glioma regulates angiogenesis by secretion of multiple pro-angiogenic growth factors such as VEGF, transforming growth factor-β (TGFβ), platelet-derived growth factor-B (PDGF-B), and pleiotrophin. 1 Recent research showed that the glioma microenvironment also triggered a change in vascular endothelial cell gene expression; whether this change takes part in glioma angiogenesis remains controversial.39,40
There is increasing evidence that lncRNAs not only affect the biological behaviors of tumor cells directly but also regulate the function of tumor vascular endothelial cells. PVT1 was found to be overexpressed in various types of tumors and involved in the regulation of the biological behaviors of tumor cells. Yang et al. 41 demonstrated that knockdown of PVT1 inhibits cell proliferation, migration, and invasion of non-small cell lung cancer cells. Schiffman et al. 42 found greater than 10-fold of genomic amplifications of PVT1 in grade 3 and 4 astrocytomas. To investigate whether PVT1 affects glioma vascular endothelial cells, we first detected the expression level of PVT1 in glioma-conditioned endothelial cells and found out that PVT1 was highly expressed in glioma-conditioned hCMECs. We further studied the effect of PVT1 on glioma vascular endothelial cell function, finding that PVT1 overexpression promotes proliferation, migration, and tube formation in vitro, whereas knockdown of PVT1 inhibited such behaviors. In recent years, a growing number of studies demonstrated that lncRNAs were involved in the regulation of various biological behaviors of endothelial cells. Michalik et al. 43 verified that lncRNA-MALAT1 inhibited HUVEC migration but promoted endothelial cell proliferation and angiogenesis. He et al. 44 confirmed that lncRNA-p21 induced vascular endothelial cell apoptosis. Similarly, in our study, PVT1 promoted glioma vascular endothelial cell proliferation, migration, and tube formation in vitro. These findings highlighted the important role of lncRNAs in the regulation of vascular endothelial cell functions.
MiRNA takes part in a variety of biological processes of tumor and vascular endothelial cells. miR-186 displays a dual function as both an oncogene and a tumor suppressor gene. For example, miR-186 expression is upregulated in non-small cell lung cancer and bladder cancer but downregulated in pancreatic cancer and endometrial carcinoma.26–29 miR-186 was reported to be minimally expressed in glioma and exhibits a tumor suppressive effect, inhibiting glioma stem cell proliferation, migration, and invasion. 45 To study the effect of miR-186 on glioma vascular endothelial cells, we detected the expression level of miR-186 in glioma-conditioned vascular endothelial cells and found that miR-186 expression was downregulated in glioma-conditioned hCMECs. Further study using overexpression of miR-186 showed that it suppresses proliferation, migration, and angiogenesis of endothelial cells, which suggests that the abnormal decrease in miR-186 expression possibly contributes to the growth of glioma vascularity. Recently, increasing attention has been paid to the influence of miRNAs on endothelial cell function. miR-542-3p was found to inhibit angiogenesis of vascular endothelial cells both in vivo and in vitro. 46 Moreover, miR-18a inhibited proliferation and migration of choroid endothelial cells. 47 Our study showed that overexpression of miR-186 inhibited proliferation, migration, and in vitro tube formation of glioma vascular endothelial cells, suggesting that miR-186 could become a potential target for glioma anti-angiogenic therapy.
Autophagy, a dynamic physical reaction to maintain cellular ecological balance, modulates cell status by degrading abnormal proteins and organelles. Protective autophagy of vascular endothelial cells promotes cell survival, thus contributing to blood vessel growth. Reports have confirmed that a hypoxic environment induces endothelial progenitor cell autophagy accompanied by upregulation of the autophagy-related proteins Beclin1 and LC3 and the formation of autophagic ultrastructure, which, in turn, promotes cell proliferation and differentiation, inhibiting apoptosis. 48 In addition, bevacizumab, the mainstay of current anti-angiogenic therapy for glioma, induces tumor cell autophagy and inhibits angiogenesis, which results in protective autophagy promoting tumor cell survival. However, inhibiting the expression of Atg7, an essential gene for autophagy, together with the use of bevacizumab successfully leads to a switch between autophagy and apoptosis, efficiently alleviating the resistance of tumor cells to anti-angiogenic therapy. 49 To investigate whether autophagy and apoptosis were involved in the effect of PVT1 on endothelial cell biological behavior, we applied the autophagy inhibitor 3-MA and the apoptosis inhibitor Z-VAD-FMK to endothelial cells overexpressing PVT1. 3-MA reversed the proliferation-promoting effect of PVT1 on endothelial cells, while Z-VAD-FMK showed no obvious influence, suggesting that the autophagy reaction induced by PVT1 is protective to endothelial cells, whereas a change in apoptosis is not involved in this process. Similarly, Ge et al. 50 revealed that lncRNA-FLJ11812 affects autophagy of HUVECs through regulation of miR-4459, which targets the autophagy-related gene Atg13. Furthermore, autophagy plays various roles in vascular endothelial cell function. Du et al. 51 confirmed that autophagy significantly promoted aortic endothelial cell migration and angiogenesis, the underlying mechanism of which includes ROS production and AKT pathway activation. Likewise, Nishikawa et al. 52 found out that inhibiting autophagy with 3-MA enhances the anti-angiogenic effect of sulforaphane, an apoptosis-inducing therapy. Additionally, Maes et al. 53 showed that, after injection of cancer cells into Atg5 knockout mice, these autophagy-deficient mice developed tumors that were obviously smaller and infiltrated with blood vessels that were smaller and more tortuous than those in control mice. In our study, PVT1 overexpression and knockdown of miR-186 induced autophagy, which, in turn, promoted endothelial cell proliferation, migration, and tube formation in vitro, suggesting that lncRNAs may affect vascular endothelial cell function through regulation of autophagy-related genes.
Transmission electron microscopy detection of autophagosomes, punctate aggregates of LC3 staining in immunofluorescence assays, and elevation of the LC3-II/LC3-I ratio has been considered the golden standard for autophagy detection. Using this standard, we found that PVT1 overexpression and knockdown of miR-186 induced autophagy of endothelial cells. The expression of P62 decreased when autophagy levels elevated, indicating that P62 was normally degraded by the autophagy-lysosome pathway and that the autophagy process was integrated. 54 In addition, we found that PVT1 overexpression and knockdown of miR-186 increased the expression levels of Atg7 and Beclin1, while knockdown of PVT1 and overexpression of miR-186 downregulated Atg7 and Beclin1. Atg7 and Beclin1 are essential for the formation of the autophagy-lysosome.55,56 In the autophagy process, Beclin1 is a multifunctional protein that binds to different proteins including Vps34 (the catalytic subunit of Class III PI3K), mTOR, BCL-2, and BCLXL.57,58 Pan et al. 59 confirmed that knockdown of Smad promotes endothelial capillary sprout by upregulation of Beclin1. Atg7 is an important autophagy-related gene located on 3p25.3, whose main functions include the formation of the autophagosome, mediation of the Atg5 and Atg12 complex, and modification of LC3.55,60,61 Our results suggest that Atg7 and Beclin1 are involved in the effect of PVT1 and miR-186 on autophagy.
MiRNA can modulate target gene expression by binding to the 3′UTRs of target genes. Using a bioinformatics database (Targetscan, miRanda), we identified binding sites for miR-186 in the 3′UTRs of Atg7 and Beclin1. We further confirmed the combination between miR-186 and the Atg7 and Beclin1 3′UTRs with a dual-luciferase reporter assay, suggesting that miR-186 negatively regulates the expression of Atg7 and Beclin1, thus blocking the formation of the autophagy-lysosome and inhibiting autophagy. Modulation of endothelial cell autophagy by miRNA may also be seen in other studies. For instance, Menghini et al. 62 confirmed that miR-216a suppresses protective autophagy in HUVECs through targeted combination with Beclin1.
LncRNAs can interact with miRNAs, as lncRNAs function as endogenous sponges or bait, thus negatively regulating the expression and activity of miRNAs. 63 In this study, we found a controversial effect of PVT1 and miR-186 on endothelial cell function. Our study also showed that PVT1 overexpression in vascular endothelial cells leads to a significant decrease in miR-186 expression, indicating that miR-186 is involved in the effect of PVT1 on endothelial cells. We found a binding site between PVT1 and miR-186 using a bioinformatics database (RNAhybrid). We further confirmed that PVT1 is capable of binding to miR-186 using a dual-luciferase reporter assay. The results of a RIP assay also support the involvement of the RISC in this reciprocal repression process, which indicates that PVT1 might affect the function of endothelial cells by regulating miR-186. To investigate whether PVT1 affects the biological behavior and autophagy of endothelial cells through regulation of miR-186, we simultaneously transfected cells with overexpression or knockdown vectors of both PVT1 and miR-186, respectively. The results indicated that PVT1 overexpression together with knockdown of miR-186 promotes the greatest level of endothelial cell proliferation, migration, angiogenesis, autophagy, and the expression of Atg7 and Beclin1. Overexpression of miR-186 reversed the promoting effect of PVT1 on endothelial cell function and expression of Atg7 and Beclin1. These results suggest that PVT1 affects glioma-conditioned vascular endothelial cells through negative regulation of miR-186. Interacting with miRNA is a common mechanism of lncRNA function in vascular endothelial cells. Aside from the study of Ge et al. mentioned above, Yan et al. 64 showed that lncRNA-MIAT binds to miR-150-5p to affect proliferation, migration, and angiogenesis of vascular endothelial cells.
In summary, this is the first study that has demonstrated that PVT1 is highly expressed in glioma vascular endothelial cells, while miR-186 has low expression in glioma vascular endothelial cells. PVT1 negatively regulates the expression of miR-186, and miR-186 negatively regulates the expression of Atg7 and Beclin1. This induces autophagy of glioma vascular endothelial cells and, in turn, promotes endothelial cell proliferation, migration, and tube formation in vitro. Therefore, we suggest that PVT1 and miR-186 could provide novel targets for glioma anti-angiogenic therapy.
Footnotes
Declaration of conflicting interests
The author(s) declared no potential conflicts of interest with respect to the research, authorship, and/or publication of this article.
Funding
This work was supported by the Natural Science Foundation of China (Grant Nos 81672511, 81573010, 81372484, and 81573010), Liaoning Science and Technology Plan Project (No. 2015225007), Shenyang Science and Technology Plan Projects (Nos F15-199-1-30 and F15-199-1-57), and outstanding scientific fund of Shengjing hospital (No. 201304).