
Abstract
Recent research indicates that the C-terminal Eps15 homology domain 1 is associated with epithelial growth factor receptor–mediated endocytosis recycling in non-small-cell lung cancer. The aim of this study was to determine the clinical significance of Eps15 homology domain 1 gene expression in relation to phosphorylation of epithelial growth factor receptor expression in patients with breast cancer. Primary breast cancer samples from 306 patients were analyzed for Eps15 homology domain 1, RAB11FIP3, and phosphorylation of epithelial growth factor receptor expression via immunohistochemistry. The clinical significance was assessed via a multivariate Cox regression analysis, Kaplan–Meier curves, and the log-rank test. Eps15 homology domain 1 and phosphorylation of epithelial growth factor receptor were upregulated in 60.46% (185/306) and 53.92% (165/306) of tumor tissues, respectively, as assessed by immunohistochemistry. The statistical correlation analysis indicated that Eps15 homology domain 1 overexpression was positively correlated with the increases in phosphorylation of epithelial growth factor receptor (r = 0.242, p < 0.001) and RAB11FIP3 (r = 0.165, p = 0.005) expression. The multivariate Cox proportional hazard model analysis demonstrated that the expression of Eps15 homology domain 1 alone is a significant prognostic marker of breast cancer for the overall survival in the total, chemotherapy, and human epidermal growth factor receptor 2 (−) groups. However, the use of combined expression of Eps15 homology domain 1 and phosphorylation of epithelial growth factor receptor markers is more effective for the disease-free survival in the overall population, chemotherapy, and human epidermal growth factor receptor 2 (−) groups. Moreover, the combined markers are also significant prognostic markers of breast cancer in the human epidermal growth factor receptor 2 (+), estrogen receptor (+), and estrogen receptor (−) groups. Eps15 homology domain 1 has a tumor suppressor function, and the combined marker of Eps15 homology domain 1/phosphorylation of epithelial growth factor receptor expression was identified as a better prognostic marker in breast cancer diagnosis. Furthermore, RAB11FIP3 combines with Eps15 homology domain 1 to promote the endocytosis recycling of phosphorylation of epithelial growth factor receptor.
Keywords
Introduction
Breast cancer (BC) is the most common malignant tumor that causes female deaths, and its incidence has increased every year; thus, it constitutes the greatest threat to the health of females.1,2 It has been reported that epithelial growth factor (EGFR) is an independent factor overexpressed in BC.2,3 The gene amplification of EGFR accounted for 6% of BC and is related to its increased protein expression. 4
EGFR is a transmembrane receptor tyrosine kinase. It is activated by epithelial growth factor (EGF) and subsequently induces tyrosine kinase activity in the intracellular domain by triggering dimerization; the downstream signal transduction pathways are subsequently activated to complete the transmembrane signal transduction process.5–8 EGFR signals, which enter cells, may arrive late lysosome and degradation, the termination of the signal transduction process, or through dephosphorylation, followed by endocytosis-recycling return to the plasma membrane for recycling. Many studies have demonstrated that EGFRs are increased in tumor tissues. However, it remains unclear whether this increase is a result of increased EGFR expression or an increased speed of return to the cell membrane via endocytosis recycling.
EGFR-mediated endocytosis recycling is a highly organized transport process regulated by numerous proteins, including the Rab family of small guanosine triphosphate (GTP)-binding proteins and the C-terminal Eps15 homology domain (EHD)-containing proteins.7,9–16 The C-terminal EHD/receptor-mediated endocytosis (RME)-1 family is a new type of endosomal scaffolding molecules. Many studies across species, which have examined the normal cells of plants, fruit flies, and mammals, have demonstrated that it adjusts the recycling of membrane cargo from endocytosis recycled vesicles (ERC) to the plasma membrane.17–21 However, in tumors, EHD1 expression has only been demonstrated to be increased in lung cancer.22,23
Rab proteins play major roles in vesicle budding, delivery, tethering, and fusion, and Rab11FIP3 abounds in the Rab11-positive ERC. During interphase, FIP3 localizes to the ERC and maintains the structural integrity of the ERC.15,16,24,25 During cell division, FIP3 participates in membrane delivery from the ERC to the site of membrane insertion.15,25–27 The Rab11 GTPase effector protein FIP3 interacts with a part of the motor protein complex and subsequently drives membrane transport from the periphery sorting endosome to the central ERC. 28
In BC, whether Rab protein and EHD1 are involved in the regulation of endocytosis recycling, as well as the function of EHD1 and Rab11FIP3, are unclear. This article will address these issues.
Materials and methods
Primary tumor specimens
A total of 50 pairs of primary BC and adjacent non-tumorous tissues were collected by snap freezing immediately following surgical resection at the Third Affiliated Hospital of Harbin Medical University (Heilongjiang, China). The tissue samples used in this study were approved by The Hospital Ethics Committee for Ethical Review of Research Involving Human Subjects at Harbin Medical University (Harbin, China).
Tissue microarray and immunohistochemistry
Archives of paraffin blocks from 306 patients, including 50 adjacent normal tissues with female BC, were obtained from the Third Affiliated Hospital of Harbin Medical University (Heilongjiang, China; age: 27–82 years, median age: 49 years; operated on between January 2007 and December 2007). None of the patients in this study had received radiation or chemotherapy prior to surgery. The tissue microarray (TMA) blocks were constructed according to a previously described method. BC TMAs used for immunohistochemical (IHC) were analyzed for this study based on the data from 306 tumor samples and 50 adjacent normal tissues. Primary cancers were evaluated in accordance with the seventh edition of the American Joint Committee on Cancer (AJCC) staging system (tumor/node/metastasis (TNM)). Estrogen receptor (ER)-positive, progesterone receptor (PR)-positive, human epidermal growth factor receptor 2 (HER2)-positive, P53-positive, and Ki67-positive patients were identified by pathology reports. The median follow-up time for overall survival (OS) of the 306 patients was 68.27 months (range: 3.85–75.02 months), and the median follow-up time for disease-free survival (DFS) of the 306 patients was 69.41 months (range: 2.14–75.02 months). Follow-ups for all patients were conducted until December 2013 or the time of death. The clinicopathological characteristics of the 306 included patients are summarized in Table 1.
Comparison of EHD1, RAB11FIP3, and pEGFR expression between BC and adjacent normal tissues.
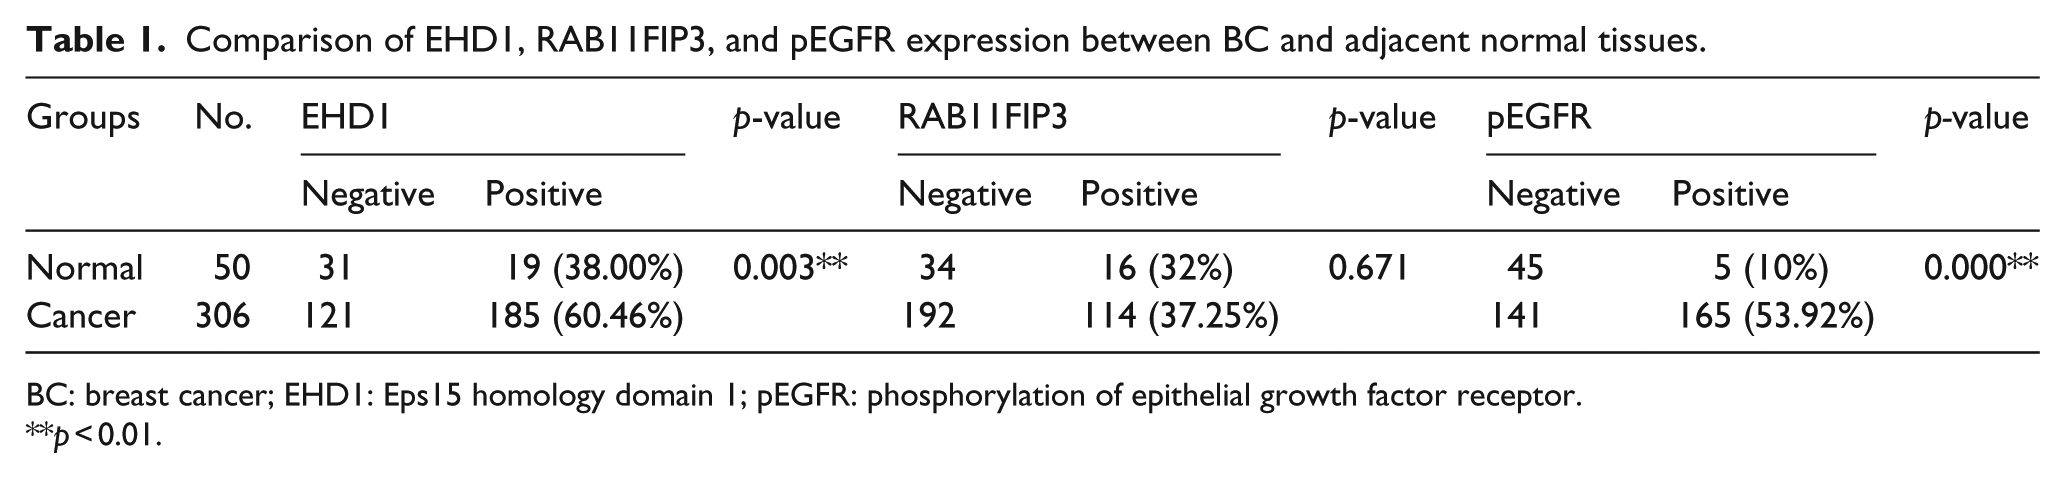
BC: breast cancer; EHD1: Eps15 homology domain 1; pEGFR: phosphorylation of epithelial growth factor receptor.
p < 0.01.
In brief, paraffin-embedded BC TMA sections were deparaffinized and rehydrated. The TMA sections were subsequently submerged in citrate (pH 6.0) and autoclaved at 120°C for 2 min. The samples were then quenched with 3% H2O2 for 10 min and blocked with goat serum for 10 min at room temperature; a cooling period of 30 min preceded the primary antibody incubation. The samples were incubated with the following primary antibodies overnight at 4°C: a rabbit polyclonal antibody for EHD1 (ab51504; Abcam, Hong Kong), diluted at 1:80; a rabbit monoclonal instant antibody for pEGFR ([EP774Y] (ab40815); Abcam’s RabMAb® technology), diluted to 1:200; and a mouse monoclonal RAB11FIP3 (ZM-0442; ZSGB-BIO, China). Following incubation with horseradish peroxidase–linked secondary antibody for 20 min at room temperature, the tissues were counterstained with hematoxylin, dehydrated in alcohol, and mounted. The degree of immunostaining was determined and scored separately for all samples by two independent investigators without prior knowledge of the clinicopathological data. IHC staining was scored according to the following criteria: −, 0%–5%; +, 6%–25%; ++, 26%–50%; and +++, 51%–100% of the cells stained. To optimally balance the multitude of the two sides divided based on the positive staining rate, a cutoff of 25% was used for RAB11FIP3 and pEGFR, and 5% was used for EHD1. “Positive” indicates that the positive staining cell rates were increased compared with the cutoff value, whereas “negative” indicates that the rate was lower or equal to the cutoff value. Two independent observers determined the percentage of stained cells and interpreted the results in a blinded fashion.
Western blot analysis
A total of 30 pairs of primary BC fresh tissues and cells were lysed with radioimmunoprecipitation assay (RIPA) lysis buffer (strong; Beyotime, China) in the presence of protease inhibitors (Roche). Equal amounts of cellular proteins were loaded into each well and resolved using 10% sodium dodecyl sulfate polyacrylamide gel electrophoresis (SDS-PAGE) gels. The samples were heated for 5 min at 95°C. Polyvinylidene fluoride membrane blotting was subsequently performed under standard conditions. For immunoblotting, the following primary antibodies were used against pEGFR (ab40815; Abcam, US), EHD1 (ab51504; Abcam, Hong Kong), RAB11FIP3 (ZM-0442; ZSGB-BIO, China), and glyceraldehyde 3-phosphate dehydrogenase (GAPDH; Sigma). The primary antibody solution was diluted 1:1000 and incubated with the membrane overnight at 4°C. The primary antibody against GAPDH (Sigma) solution was diluted 1:5000 and incubated with the membrane overnight at 4°C. The membrane was subsequently washed three times for 10 min with a mixture of tris-buffered saline and Tween 20 (TBS-T) prior to adding a 1:5000 dilution of the secondary antibody, which was diluted in the TBS-T solution at room temperature. The membrane was then incubated on a swing bed for 1 h prior to three 10-min washes with TBS-T.
Statistical analysis
Statistical calculations were conducted with the SPSS statistical software package (Version 17.0; SPSS, Inc.). The p-values of <0.05 were considered statistically significant. Correlations between expression levels were identified using Pearson coefficients. Chi-square tests were used to analyze the relationships among EHD1, other proteins, and clinicopathological features. Cumulative OS curves were generated according to the Kaplan–Meier method, and the relationship between each variable and survival was assessed using a log-rank test in a univariate analysis. The parameters were subsequently tested via a multivariate Cox proportional hazard model, which was performed to identify independent variables that predict survival.
Results
Expression of cytoplasmic EHD1, pEGFR, and RAB11FIP3 in BC tissues
EHD1 expression is frequently up-regulated in human BC tissues. To determine whether EHD1 also plays a role in EGFR-mediated endocytosis recycling of human primary BC, we determined the expression patterns of EHD1, pEGFR, and RAB11FIP3 and their clinicopathological features in breast carcinoma patients. Using IHC, we first determined the EHD1, pEGFR, and RAB11FIP3 expression levels in the cytosol in a sample of patients. As shown in Figure 1 and Table 1, we determined that the protein levels of EHD1 and pEGFR were significantly increased in the BC tissue (p = 0.003 and p < 0.001, respectively). RAB11FIP3 was not significantly different in the tumor tissues compared with the adjacent normal tissues. IHC analysis indicated that the cytosolic EHD1 expression was increased 60.46% in the BC samples, whereas EHD1 up-regulation only occurred in 38.00% of the tumor-adjacent normal tissues. The frequencies of positive staining were 53.92% for pEGFR and 37.25% for RAB11FIP3 in the BC samples.

(a) IHC analysis of protein expression in cancer tissues and adjacent normal tissues. Note high EHD1 and high pEGFR. Representative samples of EHD1, pEGFR expression, and RAB11FIP3 expression (brown color staining in cytoplasm) were detected by IHC in a pair of breast cancer tissues and paired non-tumor breast tissues. (b) IHC analysis of protein expression in normal tissues (n = 50) and breast cancer tissues (n = 306). Compared with normal tissues, breast cancer tissues expressed significantly more EHD1 (p < 0.001), more pEGFR (p < 0.001), and no significantly RAB11FIP3.
Clinical significance of EHD1, pEGFR, and RAB11FIP3 expression in BC tissues
The protein levels of the variables are associated with the known clinicopathological characteristics of BC (Table 2). The expression level of EHD1 in BC was correlated with nodal metastasis (p = 0.011), TNM clinical stage (p = 0.012), histology type (p = 0.016), and HER2 expression (p = 0.005); however, there was no correlation with the other clinical parameters. The expression of pEGFR was positively correlated with HER2 expression (p = 0.015) and Ki67 expression (p = 0.015); however, the combined expression of EHD1 and pEGFR markers was not correlated with the clinical pathological correlation.
Clinicopathological characteristics of EHD1, pEGFR, and RAB11FIP3 expression in breast cancer tissues.

EHD1: Eps15 homology domain 1; pEGFR: phosphorylation of epithelial growth factor receptor; IDC: invasive ductal carcinoma; AJCC: American Joint Committee on Cancer; HER2: human epidermal growth factor receptor 2; ER: estrogen receptor; PR: progesterone receptor; cluster A: pEGFR+ and EHD1+; cluster B: non-pEGFR+ and EHD1+.
p < 0.05; **p < 0.01.
The IHC scores indicated that the overexpression of EHD1 was strongly correlated with increased expression of pEGFR (r = 0.242, p < 0.001) and RAB11FIP3 (r = 0.165, p = 0.005) (Table 3). Thus, these findings suggest that a high expression of EHD1 is associated with an increase in EGFR-mediated endocytosis recycling, which likely contributes to the aggravation of EGFR-mediated endocytosis recycling in breast carcinoma. Consistent with the immunohistochemistry results, the Western blot analyses of the 30 pairs of primary BC and non-tumor samples indicated that mutant EGFRs exhibited increased levels of pEGFR, EHD1, and RAB11FIP3. The EHD1 expression increased to 36.67% (11/30) in the BC tissues compared with 86.67% (26/30) in the adjacent normal tissues from the control group (p < 0.001). Moreover, an up-regulation of pEGFR was identified in the BC tissues compared with their corresponding normal samples, which ranged from 83.33% (25/30) to 33.33% (10/30), respectively (p < 0.001; Figure 2(a) and (b)).
Correlation of EHD1, RAB11FIP3, and pEGFR.
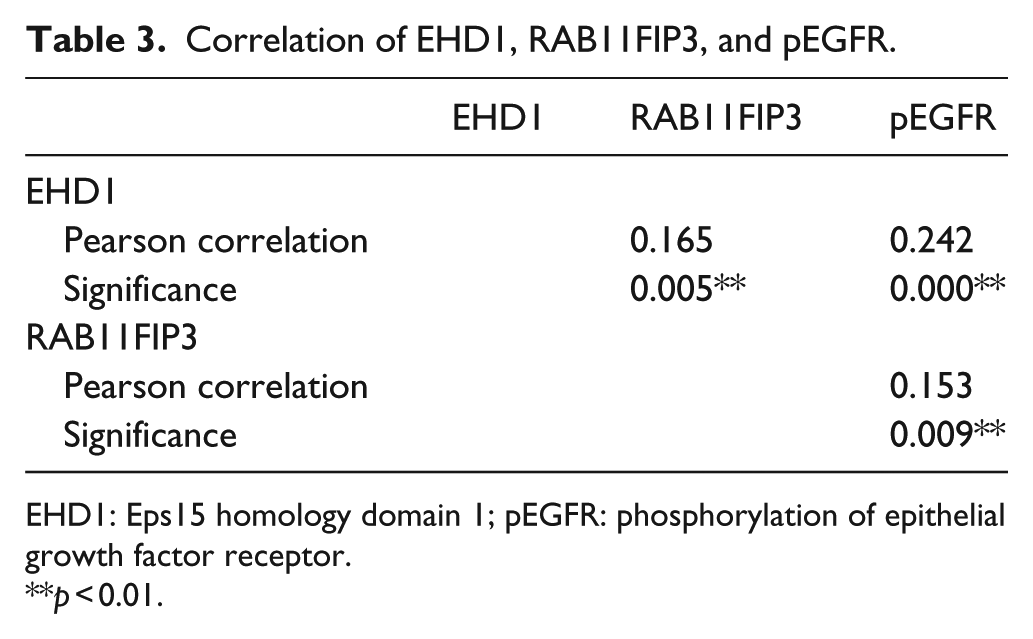
EHD1: Eps15 homology domain 1; pEGFR: phosphorylation of epithelial growth factor receptor.
p < 0.01.
Patient baseline and disease characteristics.

IDC: invasive ductal carcinoma; AJCC: American Joint Committee on Cancer; HER2: human epidermal growth factor receptor 2; ER: estrogen receptor; PR: progesterone receptor.
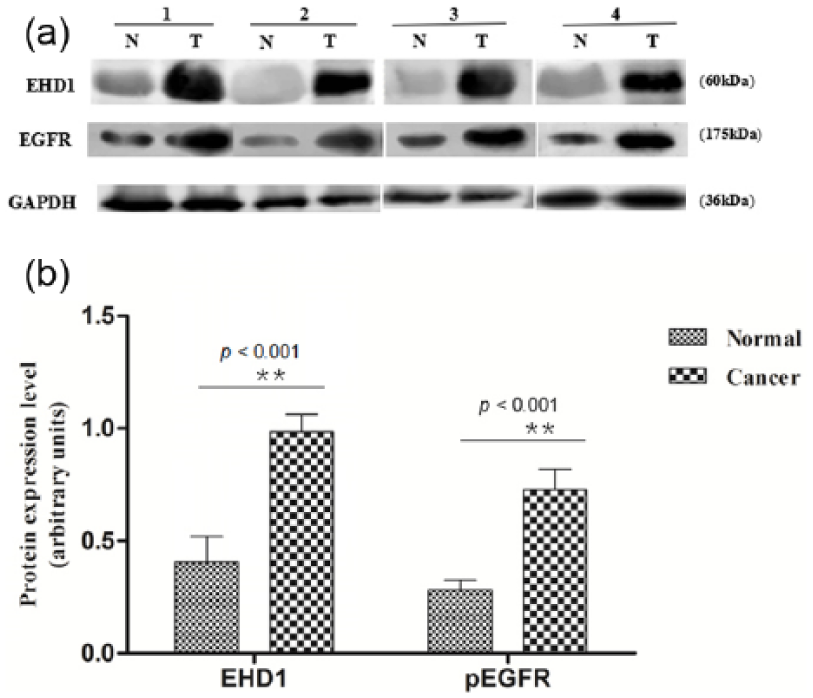
(a) A total of 30 paired cancers and adjacent normal tissues were analyzed for EHD1 and pEGFR expression by Western blotting, and 4 representative paired tumor (T) and normal (N) tissues are shown. EHD1 and EGFR expression were normalized by internal control GAPDH. (b) The average relative expression in these tumor tissues (0.932933687 ± 0.0684552125, 0.669859840 ± 0.1527648285, respectively) was significantly higher than that in paired non-tumorous tissues (0.410655140 ± 0.0948683612, 0.406692196 ± 0.1037403755, respectively). Statistical analysis confirmed the Western blotting results (p < 0.001). Statistical analysis was performed by t-test.
OS/DFS univariate and multivariate analyses
The expression level of EHD1 was closely associated with BC prognosis in the total group. To determine the prognosis of EHD1 in EGFR-mediated endocytosis recycling in the study population, we subsequently examined the associations among the expression of EHD1, pEGFR, and RAB11FIP3 proteins and patient survival. We analyzed both the DFS and OS. In the univariate analysis, most characteristics were significant (Figures 4–13, Tables 5–7). In general, the average DFS and OS durations in the patients with EHD1 up-regulation in the tumors were significantly shorter than the patients with overexpression of EHD1 in the tumors (Figure 3). In the multivariate analyses using a stratified Cox’s regression, differentiation (poor/moderate vs well hazard ratio (HR) 3.421, 95% confidence interval (CI): 1.403–8.339), TNM clinical stage (III/IV vs II/I; HR: 2.795, 95% CI: 1.573–4.965), P53 expression (positive vs negative; HR: 1.977, 95% CI: 1.149–3.400), EHD1 expression (positive vs negative; HR: 3.147, 95% CI: 1.376–7.168), and pEGFR expression (positive vs negative; HR: 2.084, 95% CI: 1.109–3.915) were identified as independent prognostic factors for unfavorable OS in the total cohort (n = 306; Figure 4). As a consequence of the described results, the DFS rates were significantly lower in the patients with poor/moderate differentiation (poor/moderate vs well; HR: 5.163, 95% CI: 1.883–14.158), a more advanced TNM clinical stage (III/IV vs II/I; HR: 4.393, 95% CI: 3.735–14.635), P53-positive expression (positive vs negative; HR: 2.463, 95% CI: 1.269–4.778), and cluster A (pEGFR+ and EHD1+) combined markers (cluster A vs cluster B; HR: 5.174, 95% CI: 2.452–10.916; Figure 5).
Univariate and multivariate analyses of overall survival in patients with BC in ER positive group (n = 196).
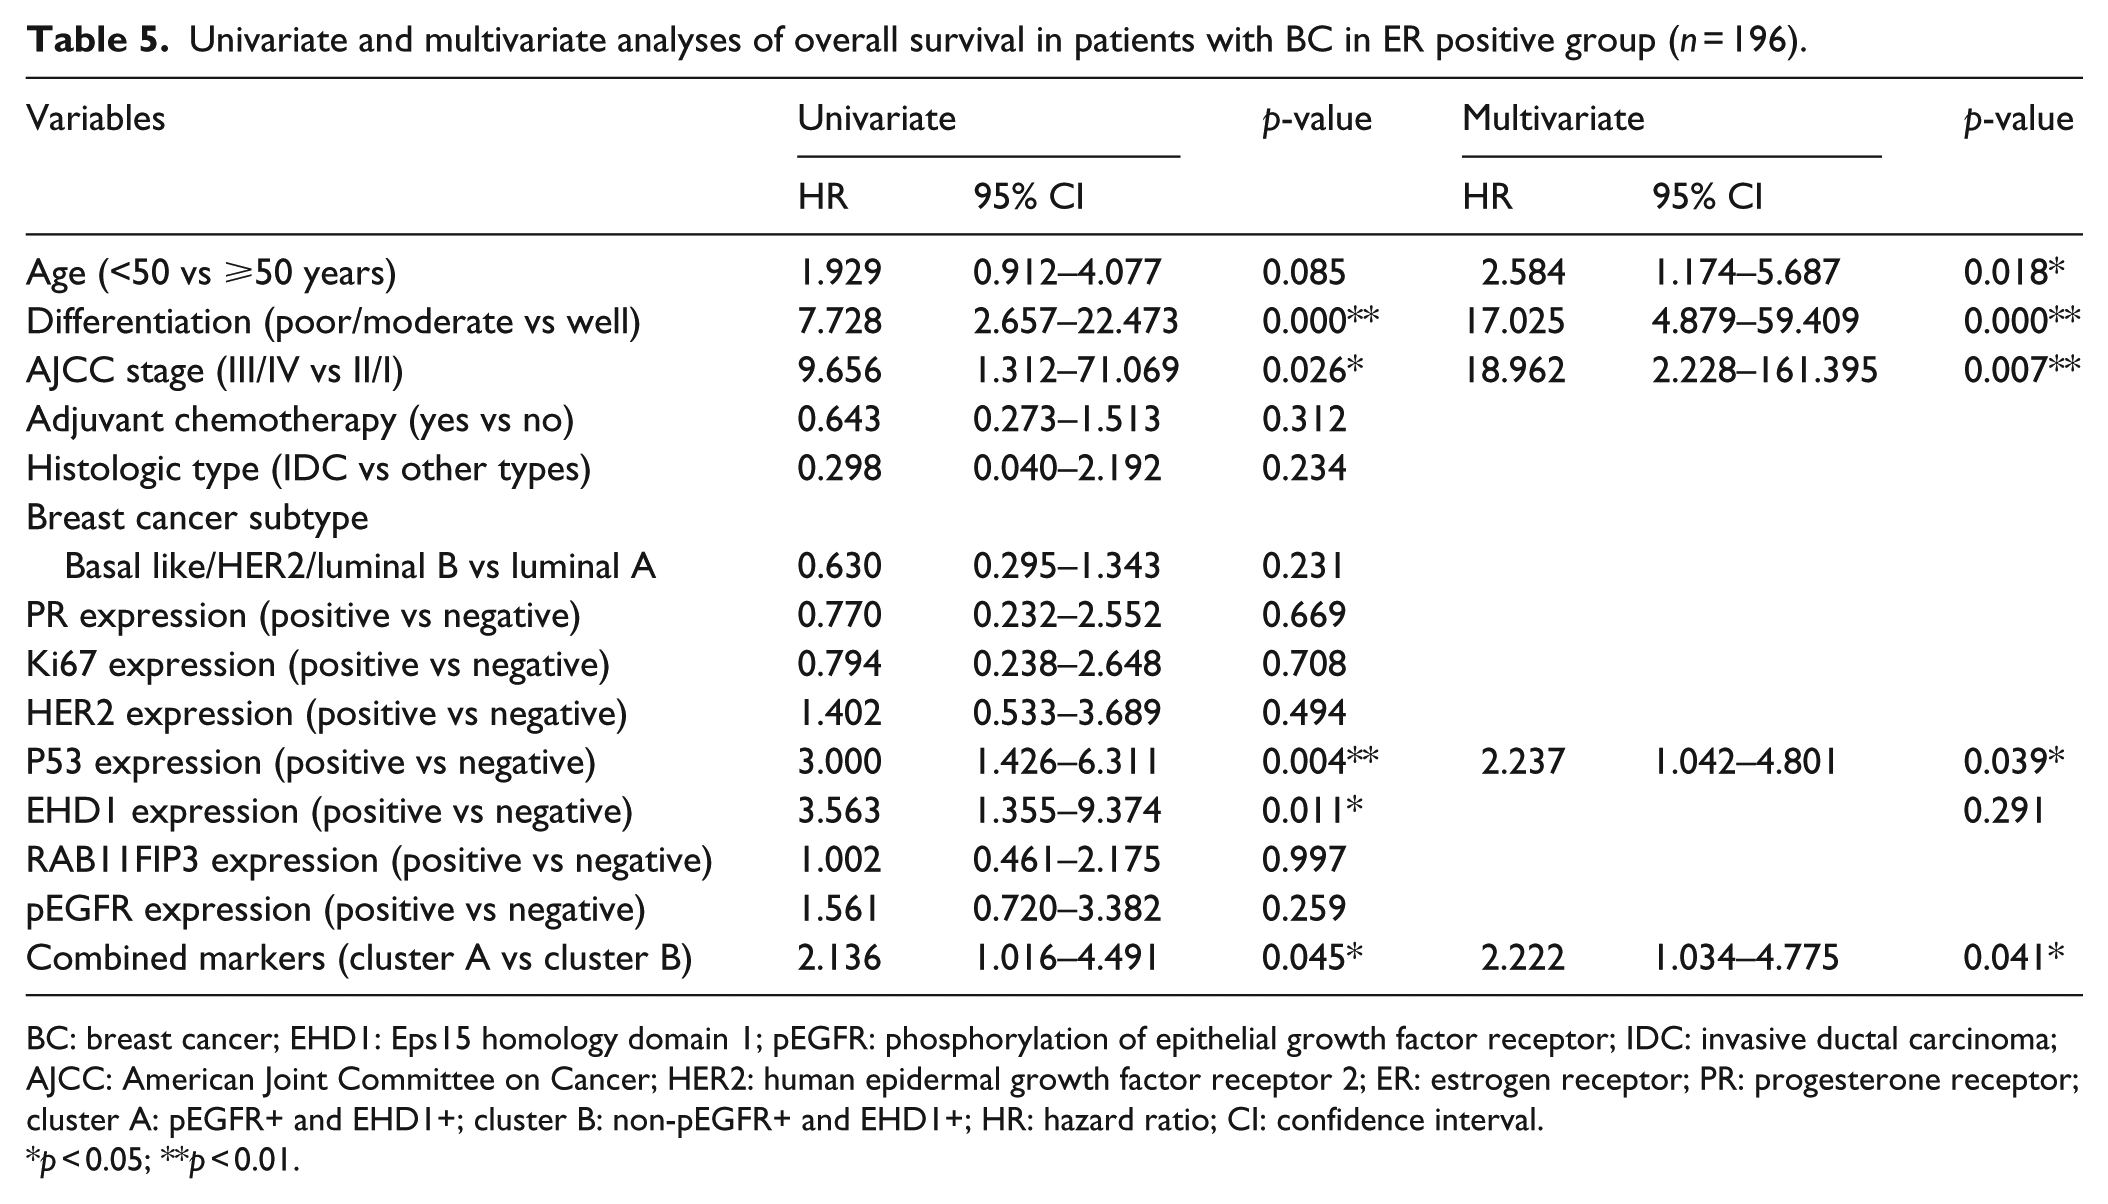
BC: breast cancer; EHD1: Eps15 homology domain 1; pEGFR: phosphorylation of epithelial growth factor receptor; IDC: invasive ductal carcinoma; AJCC: American Joint Committee on Cancer; HER2: human epidermal growth factor receptor 2; ER: estrogen receptor; PR: progesterone receptor; cluster A: pEGFR+ and EHD1+; cluster B: non-pEGFR+ and EHD1+; HR: hazard ratio; CI: confidence interval.
p < 0.05; **p < 0.01.
Univariate and multivariate analyses of disease-free survival in patients with BC in ER positive group (n = 196).

BC: breast cancer; EHD1: Eps15 homology domain 1; pEGFR: phosphorylation of epithelial growth factor receptor; IDC: invasive ductal carcinoma; AJCC: American Joint Committee on Cancer; HER2: human epidermal growth factor receptor 2; ER: estrogen receptor; PR: progesterone receptor; cluster A: pEGFR+ and EHD1+; cluster B: non-pEGFR+ and EHD1+; HR: hazard ratio; CI: confidence interval.
p < 0.05; **p < 0.01.
Univariate and multivariate analyses of overall survival in patients with BC in ER-negative group (n = 110).

BC: breast cancer; EHD1: Eps15 homology domain 1; pEGFR: phosphorylation of epithelial growth factor receptor; IDC: invasive ductal carcinoma; AJCC: American Joint Committee on Cancer; HER2: human epidermal growth factor receptor 2; ER: estrogen receptor; PR: progesterone receptor; cluster A: pEGFR+ and EHD1+; cluster B: non-pEGFR+ and EHD1+; HR: hazard ratio; CI: confidence interval.
p < 0.05; **p < 0.01.
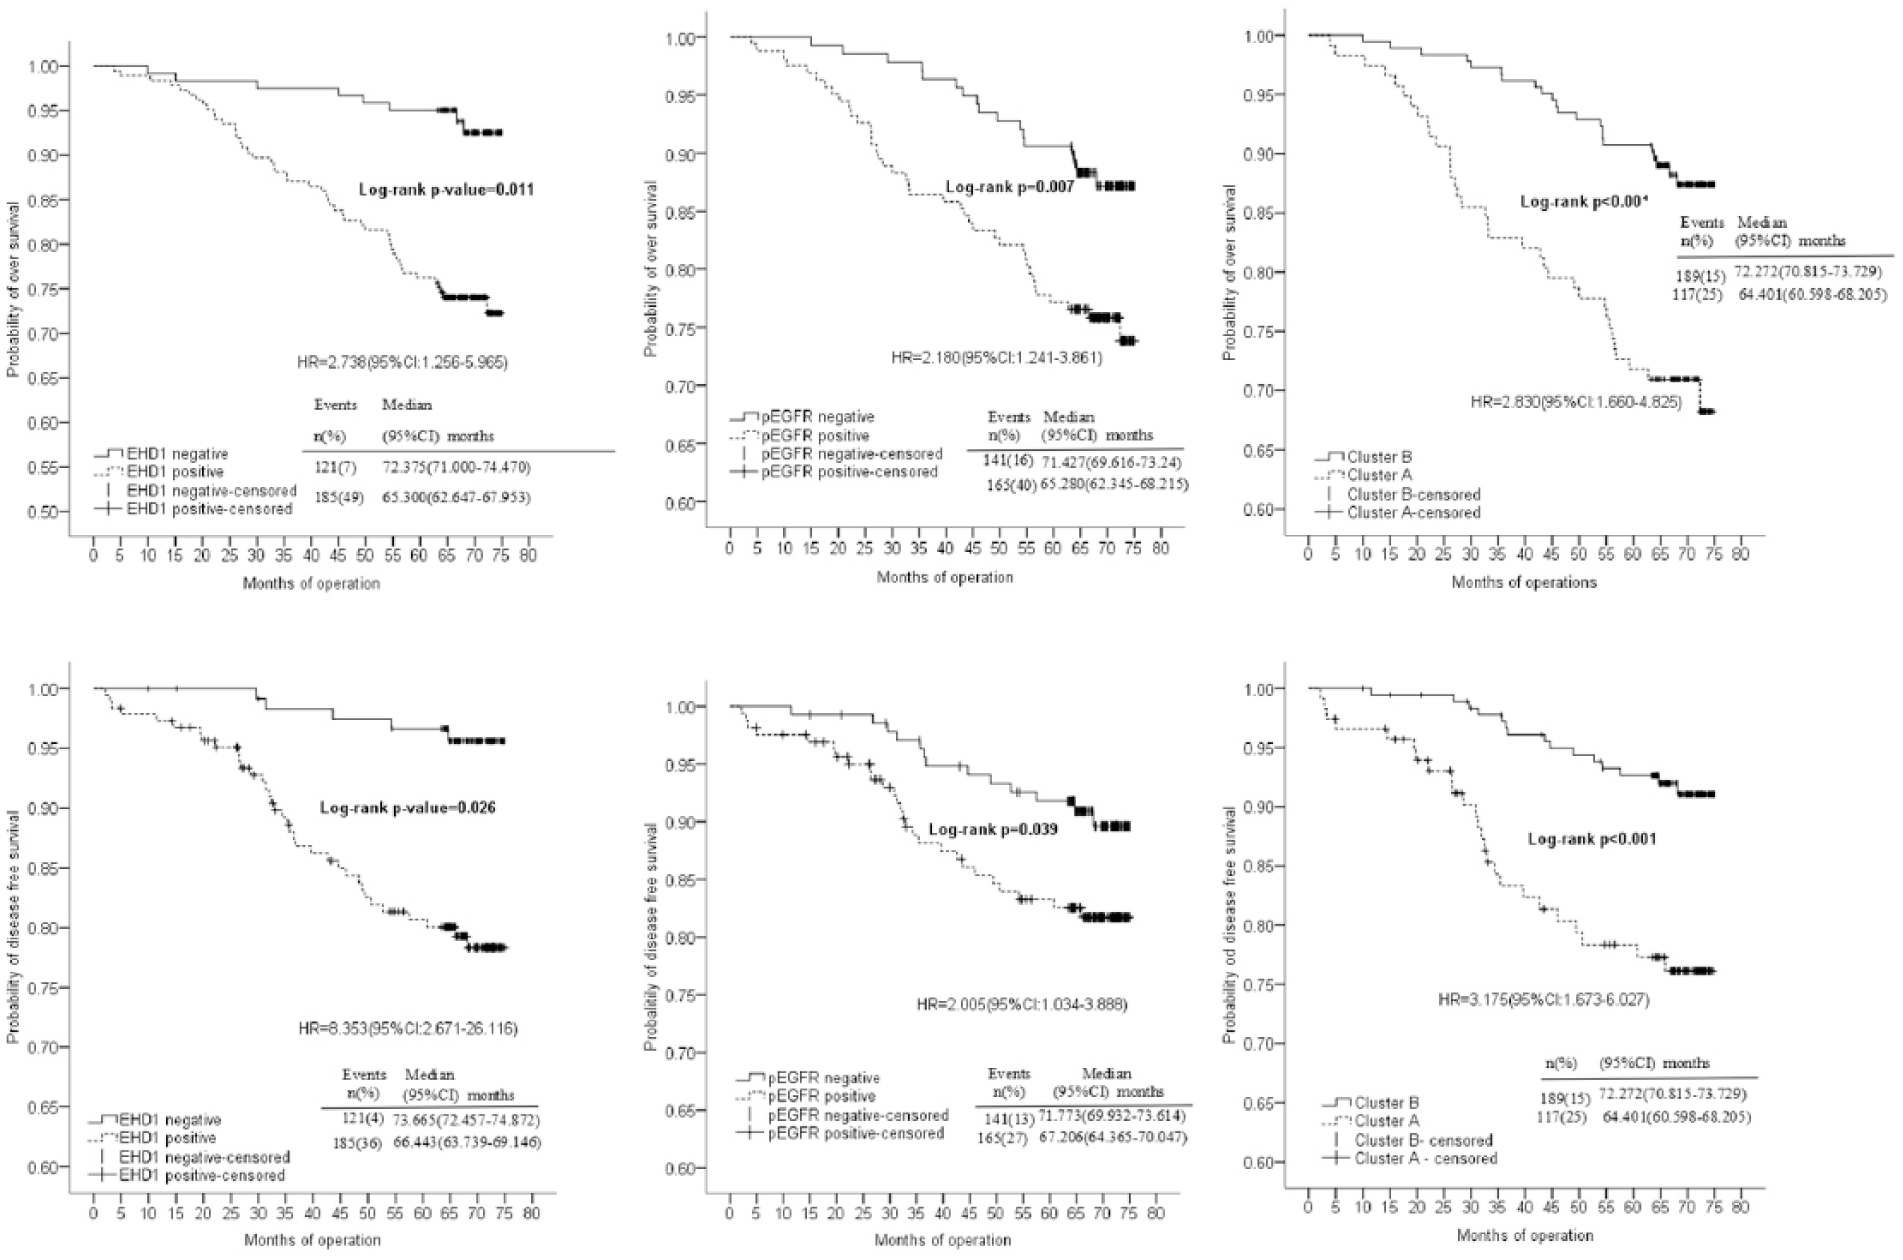
Kaplan–Meier survival plot of OS and DFS stratified according to EHD1 and pEGFR expression in all patients. The positive EHD1, positive pEGFR, and cluster A (EHD1+ and pEGFR+) groups were associated with significantly shorter OS and DFS than the negative EHD1, negative pEGFR, and cluster B (non-EHD1+ and pEGFR+) groups.
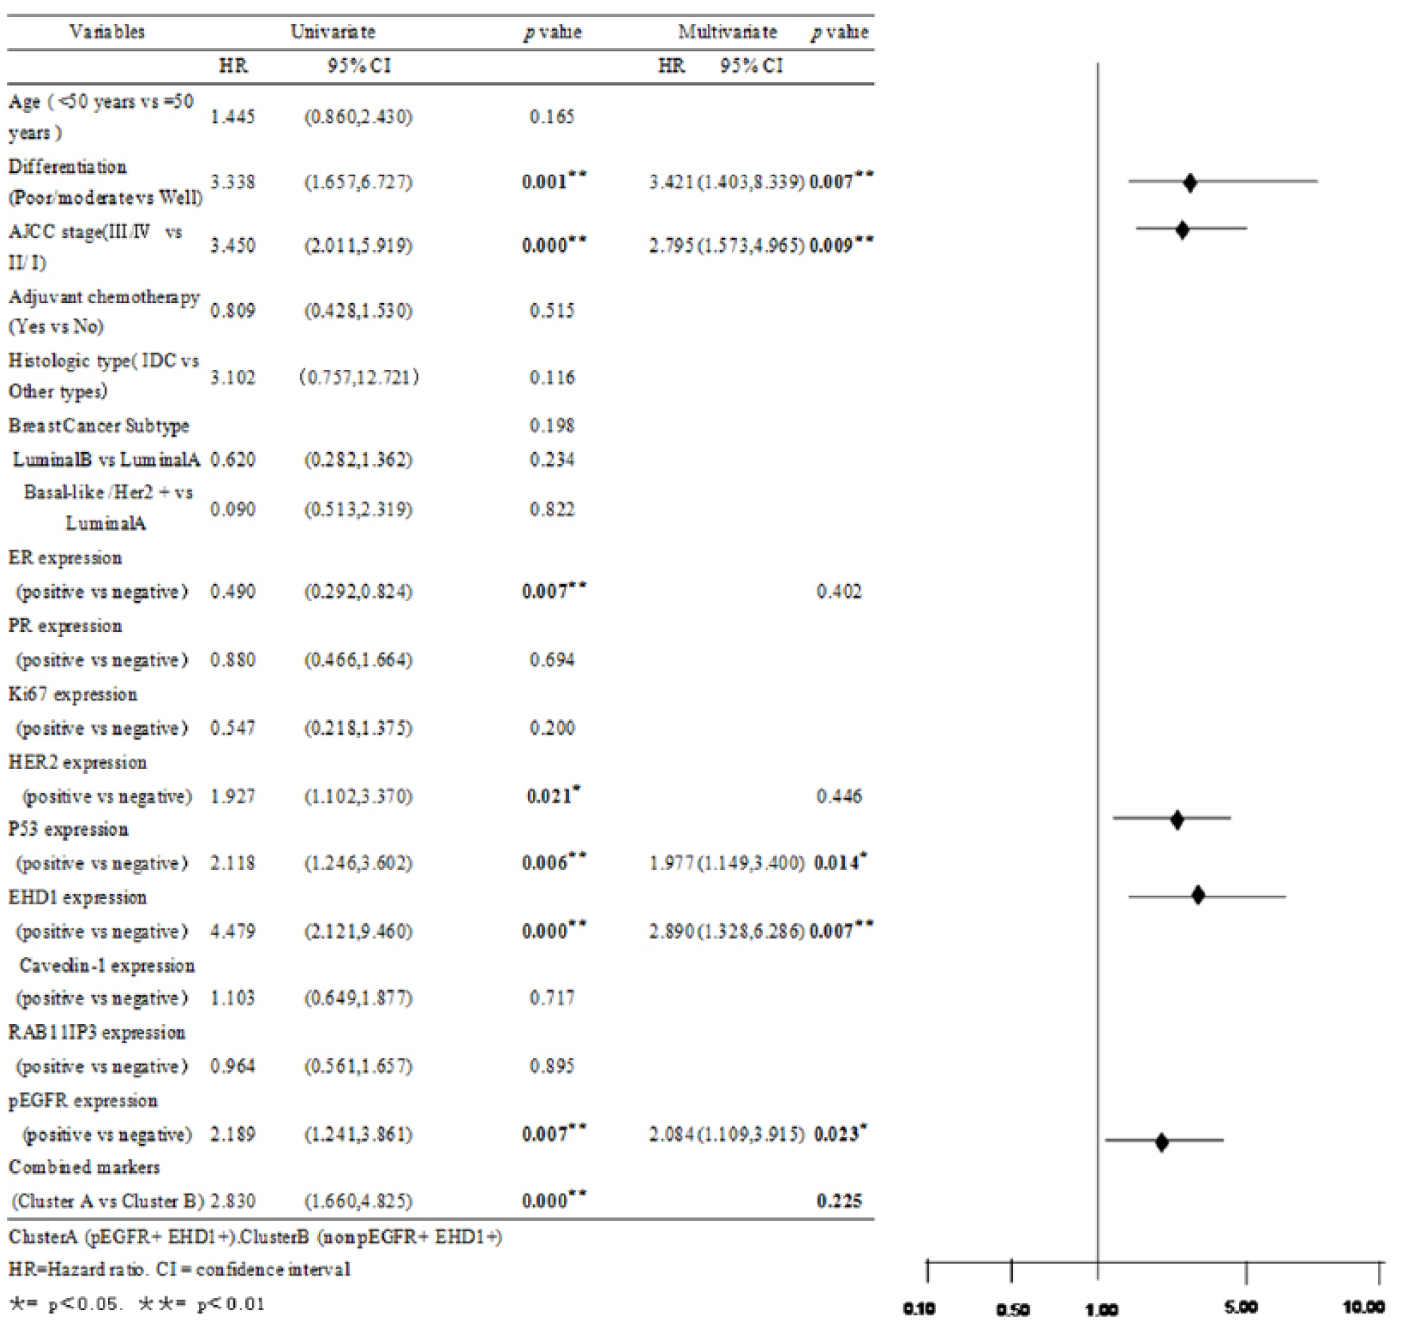
Univariate and multivariate analyses of overall survival in all patients with BC (n = 306).

Univariate and multivariate analyses of disease-free survival in all patients with BC (n = 306).
The survival curves are shown in Figure 6. The four subgroups were classified according to the combined expression status of the two proteins (Figure 6). For the OS and DFS, the patients with concordant increased pEGFR and EHD1 expression (n = 117) were distinctly isolated from the other three groups (p < 0.001 and p = 0.001, respectively), including low pEGFR/high EHD1 (n = 70), high pEGFR/low EHD1 (n = 49), and low pEGFR/low EHD1 (n = 70). To simplify the data and illustrate a mechanistic framework, we consolidated the four groups into cluster A (pEGFR+ and EHD1+, n = 117) and cluster B (either pEGFR− or EHD1−, n = 189). Regarding the clinicopathological variables, there was no significant difference.

The line of OS and DFS representing concurrent EHD1 (+) and pEGFR (+) was isolated and separated from the other three lines (p < 0.001, p < 0.001, respectively).
We divided the patients into two groups (adjuvant chemotherapy-treated patients, n = 252; non-adjuvant chemotherapy-treated patients, n = 54) based on whether they received adjuvant chemotherapy immediately following surgery resection. In the multivariate analyses using a stratified Cox’s regression (Figure 7), the OS of the adjuvant chemotherapy-treated patients had a significantly worse prognosis in the patients with poor/moderate differentiation (poor/moderate vs well; HR: 3.042, 95% CI: 1.179–7.845), a higher TNM clinical stage (III/IV vs II/I; HR: 11.583, 95% CI: 1.590–84.375), P53-positive expression (positive vs negative; HR: 2.523, 95% CI: 1.359–4.689), and EHD1-positive expression (positive vs negative; HR: 4.723, 95% CI: 1.848−12.071; Figure 8). Differentiation, AJCC stage, P53 expression, and combined expression of EHD1 and pEGFR markers were significant independent prognostic factors for the DFS of the adjuvant chemotherapy-treated patients with HRs of 3.834 (95% CI: 1.277–11.512), HRs of 10.285 (95% CI: 1.400–75.552), HRs of 2.853 (95% CI: 1.405–5.794), and HRs of 4.625 (95% CI: 2.130–10.041). Notably, the combined marker expression was the strongest independent prognostic factor in the multivariate analysis (Figure 9). For the non-adjuvant chemotherapy-treated patients, pEGFR, EHD1, and combined expression of EHD1 and pEGFR markers were not significantly correlated with the OS in the multivariate analysis.

Kaplan–Meier survival plot of OS and DFS stratified according to EHD1 and pEGFR expression in patients with chemotherapy.

Univariate and multivariate analyses of overall survival in BC patients with chemotherapy (n = 249).

Univariate and multivariate analyses of disease-free survival in BC patients with chemotherapy (n = 249).
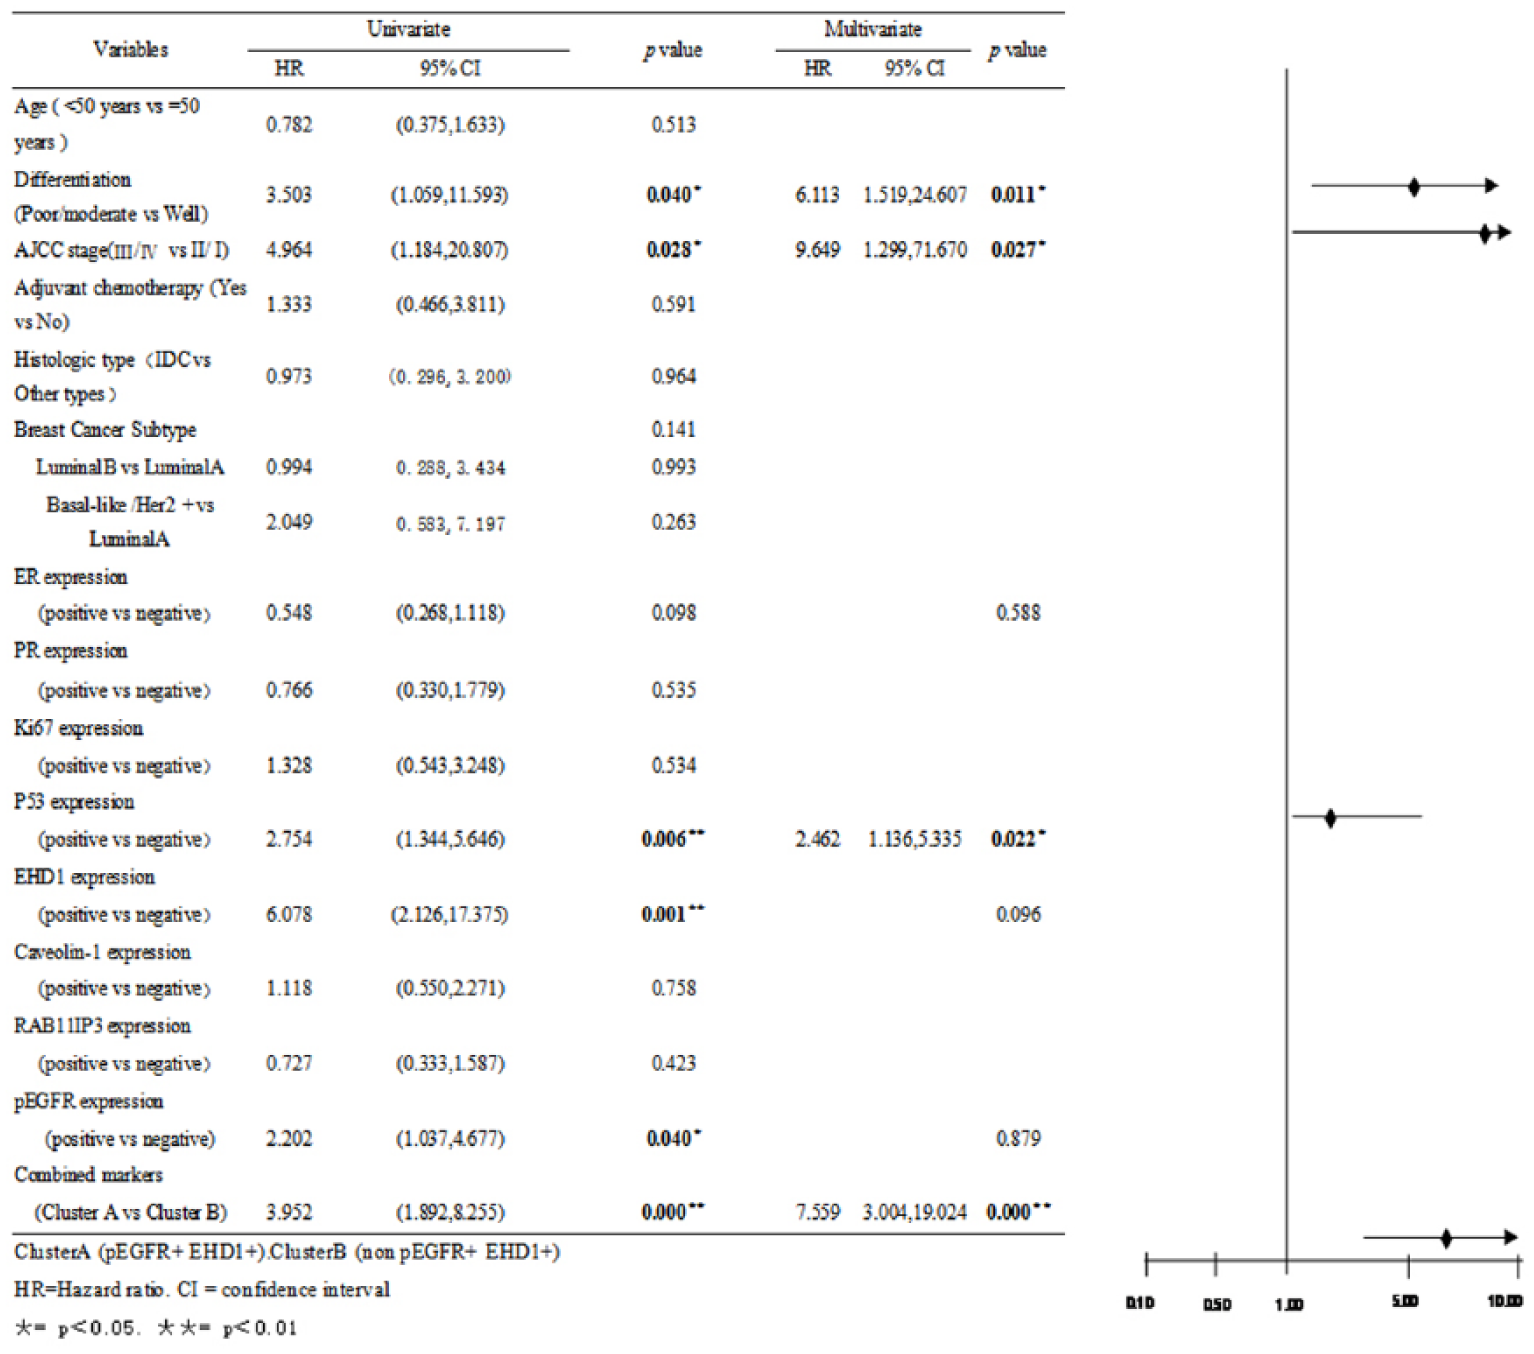
We also divided the patients into two groups (HER2-positive patients, n = 252; HER2-negative patients, n = 54) based on the HER2 status (Figure 10). The multivariate analysis indicated that differentiation, TNM clinical stage, P53 expression, EHD1 expression, and pEGFR expression were significantly independent prognostic factors for the OS of HER2 positive with HRs of 4.656 (95% CI: 1.406–15.414), HRs of 12.085 (95% CI: 1.640–89.065), HRs of 2.025 (95% CI: 1.019–4.022), HRs of 2.945 (95% CI: 1.253–6.923), and HRs of 2.230 (95% CI: 1.022–4.866; Figure 11). Poor/moderate differentiation (HR: 6.113, 95% CI: 1.519–24.607), a high TNM clinical stage (HR: 9.649, 95% CI: 1.299–71.670), P53-positive expression (HR: 2.462, 95% CI: 1.136–5.335), and combined expression of EHD1 and pEGFR markers (HR: 7.559, 95% CI: 3.004–19.024) were identified as independent prognostic factors for an unfavorable OS in the HER2-positive patients (n = 252; Figure 12). The pEGFR, EHD1, and combined expression of EHD1 and pEGFR markers were not significantly correlated with the OS in the HER2-negative patients (n = 54).

Kaplan–Meier survival plot of OS and DFS stratified according to EHD1 and pEGFR expression in patients with negative HER2 expression.

Univariate and multivariate analyses of overall survival in BC patients with HER2-negative expression (n = 196).
Univariate and multivariate analyses of disease-free survival in BC patients with HER2-negative expression (n = 196).
Using the same method in the ER-positive patients (n = 196), the multivariate analysis indicated that age, differentiation, AJCC stage, P53 expression, and combined expression of EHD1 and pEGFR markers were significant independent prognostic factors for the OS with HRs of 2.584 (95% CI: 1.174–5.687), 17.025 (95% CI: 4.879–59.409), 18.962 (95% CI: 2.228–161.395), 2.237 (95% CI: 1.042–4.801), and 2.222 (95% CI: 1.034–4.775; Table 5, Figure 13). The DFS rates of the ER-positive patients were significantly lower in the patients with poor/moderate differentiation (HR: 20.099, 95% CI: 4.133–97.931), a higher TNM clinical stage (HR: 9.901, 95% CI: 1.122–87.374), PR-positive expression (HR: 0.184, 95% CI: 0.049–0.693), P53-positive expression (HR: 4.389, 95% CI: 1.611–11.959), and combined markers (cluster A: pEGFR+ and EHD1+; HR: 7.21, 95% CI: 2.265–22.947; Table 6, Figure 13). A statistically significant improvement in the OS was identified in the ER-negative patients with a higher TNM clinical stage (III/IV vs II/I; HR: 3, 95% CI: 1.255–60.235) and combined markers (cluster A: cluster A vs cluster B; HR: 3.547, 95% CI: 1.613–7.800; Table 7, Figure 14). However, for the DFS of the ER-negative patients, the pEGFR, EHD1, and combined expression of EHD1 and pEGFR markers were not significantly correlated with the OS in the multivariate analysis (Table 8, Figure 14).

Kaplan–Meier survival plot of OS and DFS stratified according to EHD1 and pEGFR expression in patients with positive ER expression.

Kaplan–Meier survival plot of OS and DFS stratified according to EHD1 and pEGFR expression in patients with negative ER expression.
Univariate and multivariate analyses of disease-free survival in patients with BC in ER-negative group (n = 110).

BC: breast cancer; EHD1: Eps15 homology domain 1; pEGFR: phosphorylation of epithelial growth factor receptor; IDC: invasive ductal carcinoma; AJCC: American Joint Committee on Cancer; HER2: human epidermal growth factor receptor 2; ER: estrogen receptor; PR: progesterone receptor; cluster A: pEGFR+ and EHD1+; cluster B: non-pEGFR+ and EHD1+; HR: hazard ratio; CI: confidence interval.
p < 0.05; **p < 0.01.
Discussion
EGFR is a transmembrane receptor tyrosine kinase activated by EGF; it induces tyrosine kinase activity in the intracellular domain by dimerization and further activates the downstream signal transduction pathways to complete the transmembrane signal transduction process. 29 This study confirmed that pEGFR expression was significantly different in tumor-adjacent normal tissues and BC and was associated with the expression of HER2 and Ki67 in the clinical pathology and poor prognosis of patients. These findings are similar to the results of Nielsen et al. 2 and Burness et al. 3 As a type of transmembrane signal, EGFR is involved in proliferation, differentiation, cell migration, and survival, and the duration and efficiency of the EGFR signal would be helpful to the development of tumors.
EGF and EGFR may be sorted to late endosomes from sorting endosomes for degradation in lysosomes; alternatively, it may return to the cell surface, and this process is referred to as recycling. There are two modes of recycling: one mode comprises direct return (fast recycling pathway), and the other mode is indirect via the ERC to cell membrane (slow recycling pathway).6,30 In the slow recycling pathway, the important part of EGFR signaling is the regulation of receptor transportation and degradation. It has been demonstrated that EGFR undergoes rapid internalization and degradation following the stimulation of EGF in various cell types, and during this process, many proteins and lipids have critical roles, such as EHD1 and RAB11FIP3.13,15,31
Endocytosis recycling plays an important role in normal human cell transportation, and it is an important medium of biological macromolecules and protein transport. EGFRs enter normal cells through EHD1-mediated endocytosis recycling to return to the cell membrane for subsequent use. However, the function of EHD1 has rarely been reported in tumor tissues; it has only been associated with endocytosis recycling in non-small-cell lung cancer.23,32 Overexpression of caveolin-1(CAV-1) promote EGFR endocytosis in the previous article without publication has been confirmed.
This finding is similar to the results of Qing wei Meng et al. 33 EHD1 expression was correlated with the histology type, TNM stages, nodal metastasis, and HER2 expression, and its expression increased in the HER2 positive group. In BC cell lines with increased EGFR expression, the expression of EHD1 also increased. In addition, increased of EHD1 expression promoted the pEGFR to the cell membrane and accelerated it for subsequent use, whereas it promoted BC cell proliferation and malignant transformation. EHD1 mediated the internalization and degradation of EGFR, and it is conducive to the accumulation of EGFR on the cell surface, which eventually leads to an altered EGFR signal. Furthermore, cluster A (EHD1+ and pEGFR+) was associated with the state of HER2.
EHD1 and Rab11 regulate recycling from the perinuclear ERC to the plasma membrane in normal cells, and RAB11FIP3 participation in recycling is located upstream of EHD1.15,34 This research has demonstrated that RAB11FIP3 was positively correlated with EHD1 and EGFR; however, there was no significant difference between carcinoma and normal tissues, and it did not affect the prognosis. The study indicated that RAB11FIP3 is involved in endocytosis recycling in BC and promotes EGFR transportation. The Rab11 GTPase effector proteins FIP3 and cytoplasmic dynein mediate the transport of material from peripheral sorting endosomes to the centrally located ERC. 28 It is also demonstrated that the Rab11 effector, as a ligand of EHD, cooperates with EHD1 adjustment of the exit from the ERC to the plasma membrane 35 and is associated with the expression of ER, HER2, and Ki67 in clinical pathology.
In this study, we also demonstrated that the RAB11FIP3 expression was positively correlated with Ki67, and there were differences between the negative and positive groups of Ki67 in BC, in which the expression was increased in the positive group. Normal cell division in mammals is homologous with fruit fly NUF, and RAB11 combined with RAB11FIP3 (also referred to as FIP3) to control cytoplasmic division. 14 However, it has not been reported whether RAB11FIP3 is related to tumors. As an important indicator of cell proliferation, Ki67 influences the prognosis of BC.36,37
In this research, we analyzed all samples, including the chemotherapy, HER2-negative, and ER-positive and ER-negative groups, via multivariable analysis of the DFS and OS. With the exception of the histological grade, the TNM stage, P53, EHD1, and pEGFR represent independent factors that affect the prognosis. Furthermore, for the DFS, cluster A (EHD1+ and pEGFR+) has a greater influence compared with EHD1 and pEGFR alone in the prognosis (with the exception of the DFS of the ER group). These findings indicate that the combined expression of EHD1 and pEGFR markers may help physicians predict the time from postoperative to disease recurrence and subsequently judge patient prognosis.
Footnotes
Acknowledgements
The authors thank Department of Pathology of Harbin Medical University, the Third Affiliated Hospital of Harbin Medical University, and Department of Medical Genetics of Harbin Medical University.
Declaration of conflicting interests
The author(s) declared no potential conflicts of interest with respect to the research, authorship, and/or publication of this article.
Funding
This work was supported by Natural Science Foundation (no. 81372785) and Natural Science Foundation of Heilongjiang (no. ZD201316).