
Abstract
Background
In this modern era, the practice of online learning and various academic assignments necessitate the use of digital device among university students. With prolonged and inappropriate use, they are prone to the risk of experiencing digital eye strain (DES). Such health conditions involve 16 predominant symptoms that might cause severe discomfort if not well treated. Since most university students still do not aware about its consequences, it is of paramount importance to deal with this issue.
Objectives
To investigate the knowledge, attitude, and practice (KAP) on digital eye strain (DES) among healthcare students at a private university.
Materials and Methods
A cross-sectional, observational, online questionnaire-based research survey analysis was conducted among healthcare students. The participants’ recruitment was conducted using convenience and a purposive sampling technique. For data analysis, various statistical tests encompassing the Chi-square test, multivariate logistic regression test, and Spearman’s correlation coefficient test were carried out.
Results
Our study included 350 personnel. The majority of the respondents were male (n = 177, 50.6%), those aged 18–25 years (n = 250, 71.4%), and pursued a Bachelor’s degree in the Faculty of Medicine and Biomedical Science (n = 96, 27.4%). On the descriptive statistics, the overall DES prevalence was found to be 69.4% (n = 243), in which most were moderate DES (n = 170, 70.0%), followed by severe DES (n = 44, 18.1%) and mild DES (n = 29, 11.9%). The Chi-square test revealed that both the gender of respondents and the faculty of study were strongly associated with different levels of DES severity. Among the 16 DES symptoms, eye dryness (n = 312, 89.1%) was the most commonly reported, while double vision (n = 139, 74.7%) was the most severe or intense. In this KAP study, the knowledge level of respondents was moderate (n = 188, 53.7%), the attitude level of most respondents was neutral (n = 242, 69.1%), and the practice level was moderate as well (n = 262, 74.9%). Furthermore, the duration of digital device use per day, frequency of taking breaks, seating position, and the use of blue light filters on digital devices were the associated factors of DES.
Conclusion
DES prevalence is high with the majority experiencing moderate DES. In addition, most respondents are equipped with a moderate knowledge level, neutral attitude level, and moderate practice levels.
Introduction
Technological advancements have led to the betterment of human life in terms of economics, communication, and information accessibility. Electronic gadgets, especially smartphones, computers, and televisions, have become indispensable parts of our lives. With increasing exposure to these gadgets, people become increasingly dependent on electronic screen devices rather than conventional media. 1 This phenomenon can be seen in educational settings, mostly among the population receiving tertiary education. University students prefer to learn and study using digital technologies. As a consequence, university students become the most vulnerable group to the emerging health issue called digital eye strain (DES). DES is mainly associated with inappropriate and excessive use of electronic gadgets that increase the risk of various eye-related problems. If left untreated, exacerbation of dry eye syndrome and damage to the cornea might occur. 2 Therefore, it is of great importance to draw worldwide attention to the increasing prevalence of DES by addressing this particular issue.
DES, often used interchangeably with the term ‘computer vision syndrome (CVS),’ is an ophthalmic condition attributed to the long-term use of video display terminals (VDTs). The continuous contraction of eye muscles during VDT use weakens and impairs the eyes or vision, causing discomfort in extraocular parts of the body, such as back pain, shoulder pain, neck pain and stiffness. Individuals with DES suffer from four main types of symptoms. These include asthenic symptoms, visual symptoms, and ocular and extraocular symptoms. 3 The severity of DES symptoms is proportional to the frequency of digital device utilization. Most symptoms last for a temporary period and can be alleviated by getting rest or staying away from digital devices. 4
Globally, more than 60 million individuals experienced DES until 2018, with increments of newly reported cases by 1 million annually. 5 In 2013, the prevalence of DES symptoms was about 89.9% among students from five universities in Malaysia. 6 After the declaration of COVID-19 as a pandemic by the World Health Organization (WHO), DES prevalence increased more significantly than in the pre-COVID period. AlQarni et al. 7 conducted a retrospective cross-sectional study to determine the prevalence of DES among undergraduates due to the use of digital devices during the COVID-19 outbreak using the Computer Vision Syndrome Questionnaire (CVS-Q) in 750 subjects. They found that 68.53% of students experienced DES, with the majority (43.2%) reporting mild symptoms. They also found that females were 1.5 times more likely to experience increased severity of DES. 7 Chen and Rosli 8 studied the impact of electronic devices on the health of Malaysian university students during the COVID-19 period using a mixed-method approach. They found that the prevalence of DES was 22.15%. 8 Knowledge, attitude, and practice (KAP) on DES among healthcare students at a private university in Northern Peninsular Malaysia are not clear. Hence, the present study attempted to evaluate the KAP of a sample of university students regarding DES.
Materials and Methods
The current cross-sectional study was performed among a sample of healthcare students at a private university in Northern Peninsular Malaysia to examine their KAP with regard to DES. The study sample (n = 350) was sourced from the university’s healthcare students who are pursuing undergraduate degrees in Medicine, Dentistry, Pharmacy, Biomedical Sciences, Biotechnology, Physiotherapy, and Nursing programs.
After obtaining ethical approval from the university’s Human and Animal Ethics Committee, the questionnaire was opened for 3 months, from April to June 2024, for data collection purposes. Prior to the study, informed consent was obtained from the participants, and only those who completed the questionnaire were considered for the study. Throughout the study, the privacy and confidentiality of participants were ensured. Demographic data collected included the age, gender, ethnicity, and educational level of participants. A quantitative approach was utilized, and the numerical information obtained describes the results of the study.
Malaysian citizens and medical/biomedical students from a private university in Northern Peninsular Malaysia who were able to read, write, and comprehend English were included in the study. Expatriate students, students not from the private university in Northern Peninsular Malaysia, students suffering from pre-existing medical conditions (amblyopia, conjunctivitis, eye infection, strabismus, glaucoma, cataract, arthritis, and hypertension), and students unavailable during the study period were excluded from the study.
Study Instrument
The study instrument utilized is a structured online questionnaire adapted from various sources.9, 10 The questionnaire comprised 5 domains and 47 items focused on the healthcare students’ KAP regarding DES, besides assessing the DES prevalence and associated factors.
Section 1: Demographic information of participants (7 items).
Section 2: CVS-Q (16 items).
Section 3: Knowledge of participants regarding DES (8 items).
Section 4: Attitude of participants regarding DES (7 items).
Section 5: Practice of participants regarding DES (9 items).
DES score for each item is calculated using the following equation.

It is recorded as 0 ≈ 0; 1 or 2 ≈ 1; 3 or 4 ≈ 2. Total DES score range is 0–32. The total DES score range is classified as no CVS (score range: 0–5), mild CVS (score range: 6–12), moderate CVS (score range: 13–18), and severe CVS (score range: 19–32). 9
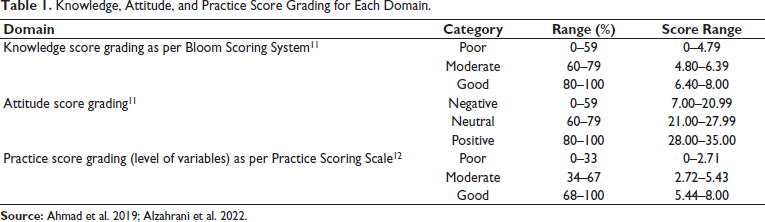
Face and content validation tests of the questionnaire were performed prior to conducting the pilot study. Among the 47 items, 36 had a content validity ratio (CVR) of 1, while the remaining 11 had a CVR of 0.3. The resulting content validity index (CVI) was found to be 0.84. This implied that the overall content validity was high and all the items should be included. The internal reliability testing (using Cronbach’s alpha value) was performed and rendered a high value of 0.8246, implying that the questionnaire was highly reliable for the current study. The score grading, cutoff points, and score ranges for each domain are displayed in Table 1.11, 12
Knowledge, Attitude, and Practice Score Grading for Each Domain.
Data Collection, Entry, and Analysis
Data were collected via a convenience, purposive sampling technique. The questionnaire was generated in Google Forms, and the survey link was shared with the healthcare students. Prior to the questionnaire administration, all respondents were informed about the purpose and mechanism of the research, besides obtaining consent to participate in the study. The raw data in the Excel sheet were converted into codes and scores. The data were analyzed statistically by SPSS software (ver. 27.0), with p < .05 deemed statistically significant.
Descriptive statistics were conducted for demographic characteristics, CVS-Q, and KAP. Multivariate logistic regression analysis was used to identify the associated factors of DES. A Chi-square test was selected to measure the association between demographic characteristics and the severity of DES. In accordance with the normality test, the data associated with total KAP scores were not normally distributed. Hence, a non-parametric test, specifically Spearman’s correlation test, was conducted to measure the correlation between knowledge and practice regarding DES, as well as the correlation between attitude and practice regarding DES.
Results
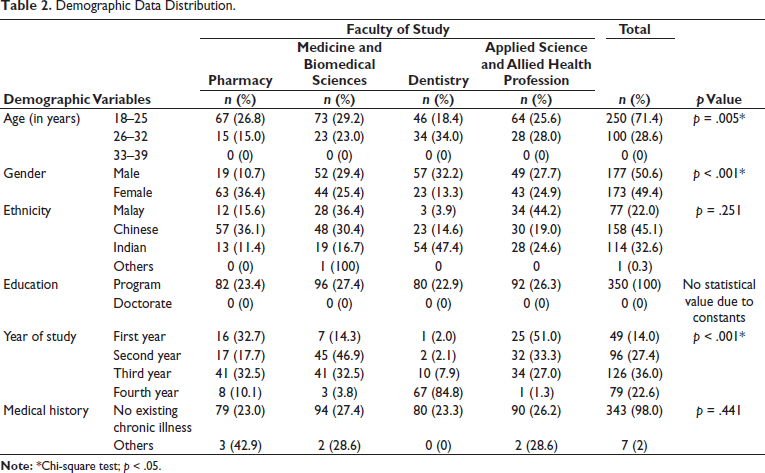
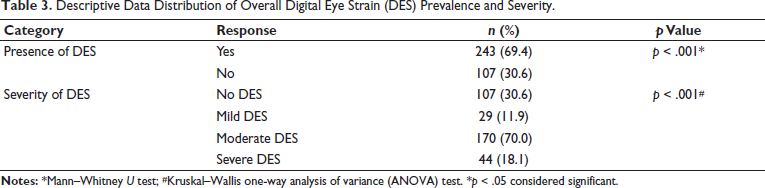
A total of 350 (male respondents: 177 and female respondents: 173) were engaged in this study, with the highest proportion coming from the Faculties of Medicine. The majority of study respondents were Chinese (45.1%), Indian (32.6%), and Malay (22.0%). The demographic characteristics distribution of the respondents was analyzed using descriptive statistics and the Chi-square test (Table 2). The results of the CVS-Q showed that 243 (69.4%) of the respondents experienced DES in daily life. Most of them (70.0%) were considered to be moderately affected (Table 3).
Demographic Data Distribution.
Descriptive Data Distribution of Overall Digital Eye Strain (DES) Prevalence and Severity.
Frequency and Severity of DES Symptoms
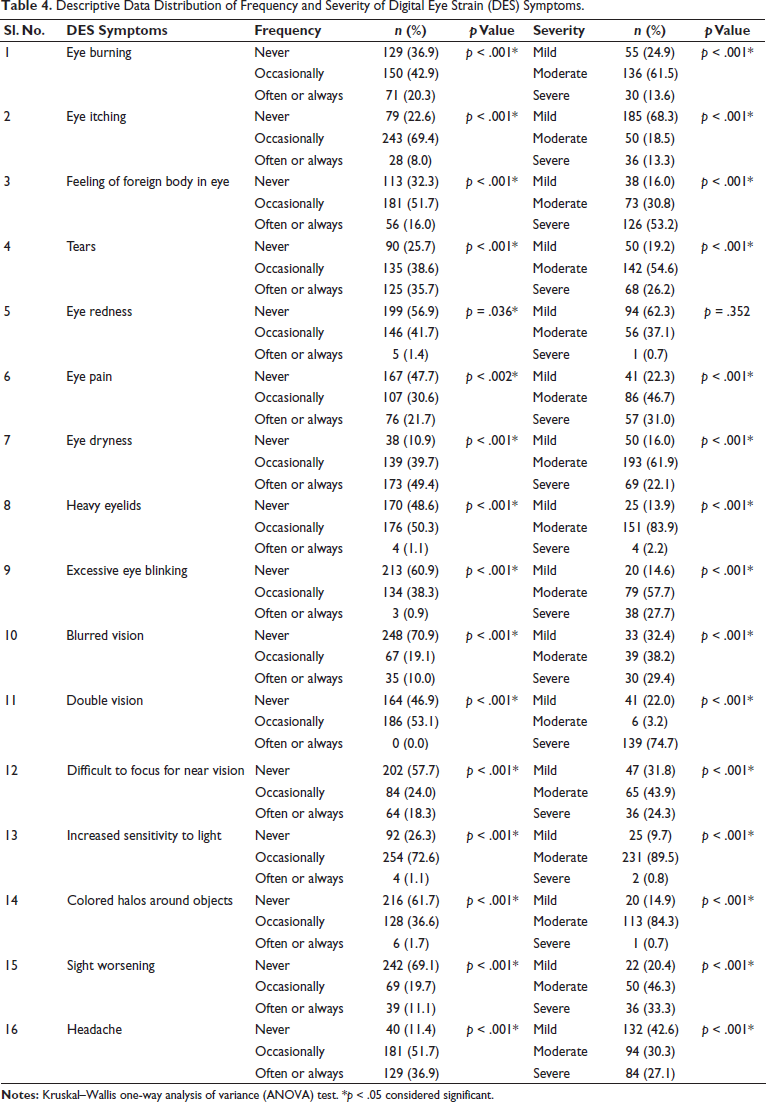
In the frequency of DES symptoms analysis, out of the 16 DES symptoms, eye dryness (n = 312; 89.1%) was the most frequently reported, with which 139 (39.7%) and 173 (49.4%) respondents had “Occasionally” and “Often or always” eye dryness, respectively. Headache (n = 310, 88.6%) was most commonly reported as “Occasionally” (n = 181, 51.7%), followed by “Often or always” (n = 129, 36.9%). This was followed by symptoms of eye itching (n = 271, 77.4%). To be more specific, 243 (69.4%) respondents experienced eye itching occasionally, together with 28 (8%) of them getting “Often or always” eye itching. In the severity of DES symptoms analysis, 74.7% of respondents showed the development of severe double vision (n = 139), followed by a severe feeling of a foreign body in the eyes (n = 126, 53.2%) and severe headache (n = 84, 27.1%) (Table 4).
Descriptive Data Distribution of Frequency and Severity of Digital Eye Strain (DES) Symptoms.
Knowledge Toward DES
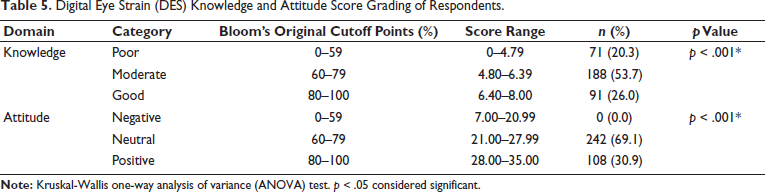
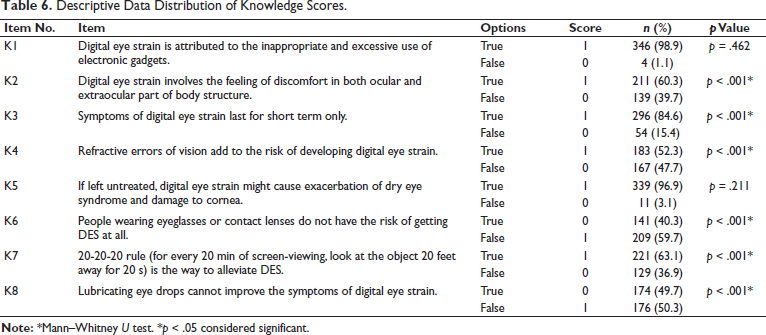
Table 5 displays the level of knowledge of 350 respondents with regard to DES. The results show that the largest fraction of respondents had a moderate knowledge level (n = 188, 53.7%). The remaining portion of respondents demonstrated “good” and “poor” knowledge levels. In knowledge scores analysis, a significant number of respondents chose the right answers for K1 (n = 346, 98.9%) and K5 (n = 339, 96.9%). They acknowledged that DES is caused by improper use of digital devices and might lead to negative consequences if left untreated. The descriptive data distribution of knowledge scores is summarized in Table 6.
Digital Eye Strain (DES) Knowledge and Attitude Score Grading of Respondents.
Descriptive Data Distribution of Knowledge Scores.
Attitude Toward DES
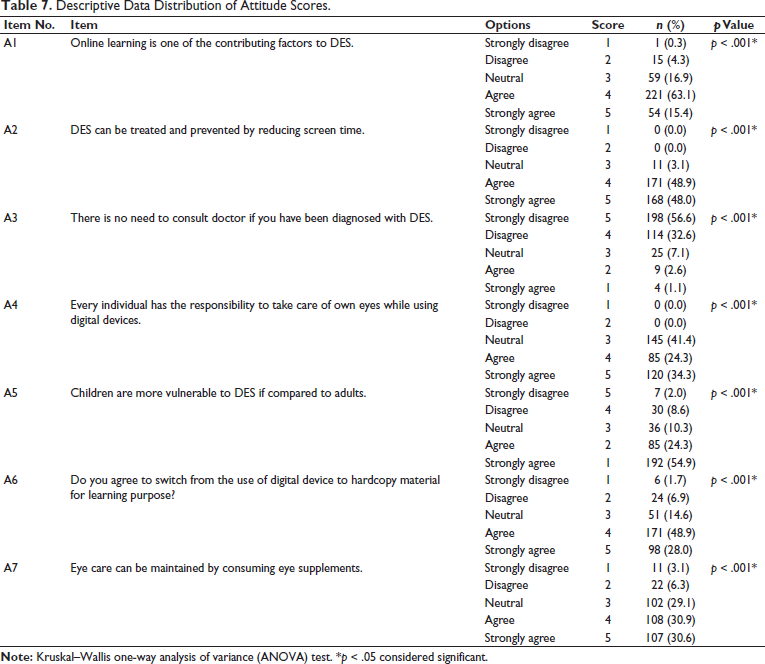
The study revealed that the majority of respondents demonstrated a “neutral” attitude (n = 242, 69.1%) toward DES (Table 6). The descriptive data distribution of attitude scores is summarized in Table 7. In the current study, “Strongly disagree” was the most common response to the statements.
Descriptive Data Distribution of Attitude Scores.
Practice with Regard to DES
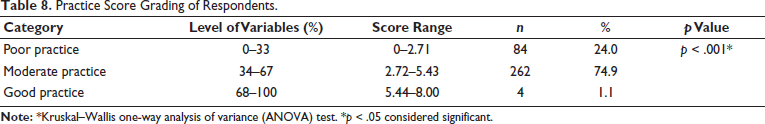
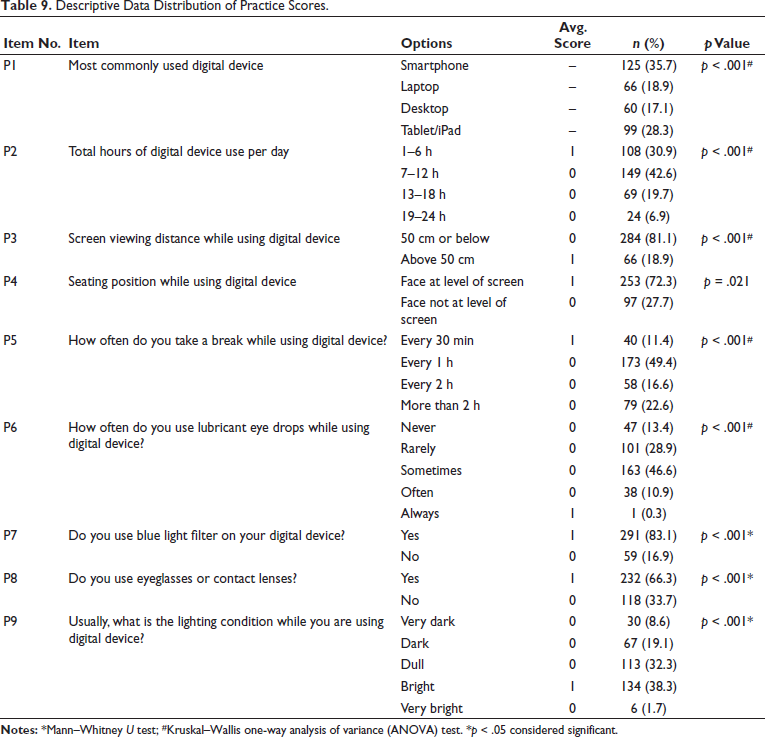
Overall, the practice level of the present study was graded as moderate (Table 8). The descriptive data distribution of practice scores is summarized in Table 9. Most participants reported using smartphones and digital devices for 7–12 h daily (42.6%). Furthermore, most of the respondents reported that they would take a break after every hour (49.4%) of digital device use, and they apply lubricant eye drops during digital device use “Sometimes.” The greater proportion of our study respondents viewed the digital device screen at a distance of 50 cm or below (81.1%), and they placed their faces at the screen level. A significant portion of the respondents utilized blue light filters on their digital devices (n = 291, 83.1%) as well as equipped themselves with eyeglasses or contact lenses (n = 232, 66.3%). A total of 134 (38.3%) respondents usually used digital devices under bright conditions, followed by those working under dull, dark, very dark, and very bright conditions.
Practice Score Grading of Respondents.
Descriptive Data Distribution of Practice Scores.
Associated Factors of DES
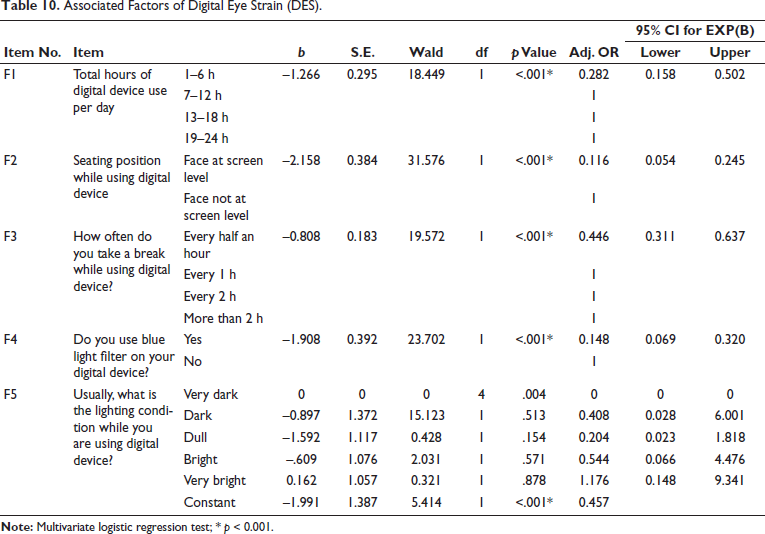
Multivariate logistic regression analysis was performed to determine the predictor variables. Out of the eight predictor variables, five common factors or variables were found, in which the first four variables were deemed to be statistically significant with p value <.001 (Table 10). No statistically significant difference was observed among those using digital devices under dull, dark, very dark, and very bright conditions.
Associated Factors of Digital Eye Strain (DES).
Correlation of Knowledge and Practice Regarding DES
As total knowledge and practice scores were not normally distributed, Spearman’s correlation coefficient test was applied to measure the extent to which two variables are linearly related. The Spearman’s correlation coefficient (Rho value) of –0.347 (95% CI = –0.439 to –0.248, p < .001) was statistically significant, indicating a moderate, inverse correlation.
Correlation of Attitude and Practice Regarding DES
As total attitude and practice scores were also not normally distributed, Spearman’s correlation coefficient test was applied. The Spearman’s correlation coefficient (Rho value) of –0.118 (95% CI = –0.049 to –0.166, p < .05) was statistically significant, indicating a moderate, inverse correlation.
Discussion
A considerable number of respondents were equipped with a moderate knowledge level, neutral attitude level, and moderate practice level. Even though the knowledge and practice of respondents were correlated, they exhibited a moderate negative relationship. Similarly, the relationship between attitude and practice was inversely but weakly correlated. Moreover, only four factors were found to be statistically significant in this study. These include the duration of digital device use per day (1–6 h), frequency of taking breaks (every half an hour), seating position (face at the level of the screen), and the use of a blue light filter on a digital device (yes). These serve as protective factors that help lower the risk of developing DES. Both the gender of respondents and the faculty of study were also strongly associated with different levels of DES severity.
The present study revealed that the prevalence of DES is about 69.4%, and most of the respondents were considered to be moderately affected (70.0%). This corresponds to two studies conducted among medical students with DES prevalence of 53.7% and 69.8%, respectively.13, 14 The result obtained is also comparable with the study performed in Nepal Medical College in the population of undergraduate students during COVID-19. To be more specific, less difference was seen between the DES prevalence during COVID-19 (68.1%) and post-COVID-19. 15 The high prevalence rate of DES reflects the significant influence of digital devices on the eyes of healthcare students during university life. It may be attributed to inappropriate practices and habits related to digital device use. The students might experience more frequent eye and musculoskeletal discomforts if action is not taken to reduce the incidence of DES.
The study revealed that the study respondents have a moderate knowledge level (n = 188, 53.7%) and a neutral attitude (n = 242, 69.1%) toward DES. Patil et al. 16 and Umesh et al. 17 also observed moderate knowledge levels regarding DES among medical and nursing students, respectively. The possible reasons include the limited awareness, exposure, and experience of healthcare students associated with the issue. 18 Also noted that the current study respondents showed a neutral attitude, and this attitude level reflects their degree of acceptance toward DES and willingness to engage in the change of current practice.
Assessment of practice levels among the target population gives an idea of their pattern, frequency, and appropriateness of DES-related habits in daily routine. They may be adhering to certain measures, but not covering all the aspects required, implying that most of the adopted practices are not extensive, consistent, or optimal enough to produce satisfactory outcomes. It is possible that the demanding, costly, and inconvenient practices have contributed to the inadequate adherence of some students. Smartphones (35.7%) were found to be the most commonly used digital gadget. Such findings aligned with another study (88.02%) conducted in India. 19 These comparable findings may be due to portability, convenience, affordability, and multifunctionality provided by smartphones to the students.
The DES knowledge level correlates negatively or inversely to the practice level, implying that more knowledgeable healthcare students tend to adopt fewer good practices. Meanwhile, those with poor knowledge levels tend to conduct more desired practices. Such findings are not usually expected. Several factors can be implicated in this. The educated students might be overconfident and do not view the issue as a serious matter. It is also possible they lack sufficient resources for practice to meet satisfactory outcomes. Moreover, they may have lower motivation to carry out the practice.
The respondents’ attitudes and practice levels were also found to be inversely correlated. The more positive the attitude of respondents, the less practice they engaged in. This suggests a negative relationship between the parameters. A possible cause is the insufficient opportunity for practice in real-life settings. Additionally, the students with positive attitudes toward DES might think that less practice is required to achieve the desired outcomes.
The current study is limited to assessing the KAP, prevalence, severity, and associated factors of DES among healthcare students in a private university. Therefore, the results obtained cannot reflect or represent the stands of university students throughout Malaysia.
Conclusion
The overall DES prevalence was high (69.4%), which reflects the necessity for students’ attention to this health issue. The proportion of respondents with moderate DES (70.0%) was the most significant, followed by severe DES (18.1%) and mild DES (11.9%). Among the symptoms reported in this population, eye dryness was the most frequently reported, while double vision was found to be the most severe or intense. Both symptoms accounted for the increased frequency and severity of DES, respectively.
Footnotes
Abbreviations
Declaration of Conflicting Interests
The authors declared no potential conflicts of interest with respect to the research, authorship, and/or publication of this article.
Ethical Approval
Prior approval was obtained from the AIMST University Human and Animal Ethics Committee (AUHEC/FOP-CPPP-22/02/04/2024) for conducting the study.
Funding
The author(s) disclosed receipt of the following financial support for the research, authorship, and/or publication of this article: The authors received financial support for publication of this article from AIMST University.
Informed Consent
e-Consent form was obtained from the study participants.