
Abstract
Background
The Chinese forest musk deer, a solitary ungulate renowned for its musk secretion, is under extinction threat despite its extensive use in traditional Chinese medicine and perfumery. The demand for musk significantly outstrips its natural supply.
Objectives
This study aimed to explore the differences in peptide profiles between cultured musk gland cells and natural musk to develop sustainable alternatives for musk production and aid in the conservation of musk deer.
Materials and Methods
Musk samples from Chinese forest musk deer and cultured cells were collected and analyzed using the EASY-nLC 1000 system. Peptide extraction, nano LC–MS/MS analysis, and advanced peptidomics techniques were employed to identify and compare peptide compositions.
Results
The study found significant differences in secreted and natural musk peptide compositions. Cultured cells could partially replicate the complex peptide environment of natural musk, with some unique peptides identified in natural samples not present in cultured secretions.
Conclusion
While cultured musk gland cells show potential in mimicking natural musk synthesis, notable differences in peptide profiles suggest the importance of the gland’s microenvironment and the deer’s physiological conditions. This research establishes a foundation for optimizing culture techniques to enhance the therapeutic qualities of synthesized musk, contributing to the sustainable production of musk and the conservation of the species.
Introduction
The Chinese forest musk deer (Moschus berezovskii Flerov) is a small solitary ungulate that lives within forested and mountainous parts of Asia (He et al., 2014). Male musk deer are renowned worldwide for secreting musk from glands near their genitals (He et al., 2014; Li et al., 2016). Musk has been used in traditional Chinese medicine for more than 2,000 years and is used in expensive perfume materials in European countries due to its permanent and special scent. Although the forest musk deer has the widest distribution among musk animals and the largest number of artificial breeds in China, the species is still at risk of extinction (Wu et al., 2011). The pharmaceutical industry in China consumes at least 1,000 kg of natural musk on average each year, and the demand exceeds the supply; therefore, researchers and businesses in the market must focus on increasing musk production (Wang & Ha, 2018).
Peptidomics first appeared in 2001 in the full text of the paper and is used to study and quantify endogenous peptides 2 to 50 amino acids in length (0.2–10 kDa) (Schrader, 2018). These peptides are found in all cells and biofluids and play important roles in specific physiological and biological functions (Li et al., 2023). For example, these peptides can influence oxidative stress (di Candia et al., 2021), vasodilation (Carney, 2015; Saavedra & Armando, 2018; Xu et al., 2021), apoptosis (Chen et al., 2010), anti-microbial activity (Soltaninejad et al., 2021), and cell differentiation (Wei et al., 2020; Zhang et al., 2021), as all these processes can influence disease progression. Peptidomics is rapidly progressing and has developed into a separate field that concentrates on the examination of peptide analytics and their biological functions. Compared to smaller molecules, oligo- or polymer peptides exhibit a greater degree of complexity than smaller molecules but are less complex than proteins. These peptides are derived from various processes, including specific and random synthesis or degradation pathways. Consequently, the peptides are commonly found in biological fluids and exhibit a diverse range of forms and sizes, with their variety surpassing that found via metabolomics and proteomics (Descamps et al., 2023). Research is increasingly focused on proteins and peptides, with numerous studies related to the Human Proteome Project (HPP) by the Human Proteome Organization (HUPO). Proteomics and peptidomics methodologies are becoming essential in the development of preventative medical approaches involving innovation precision. Remarkably, advanced tools in plasma proteomics and peptidomics show great promise for investigating the pathogenesis of diseases (such as COVID-19 and cancer), identifying significant biomarkers, and improving patient care and clinical outcomes (He et al., 2022). Peptides are found in all cells and body fluids, and many peptides play important roles in physiological function and homeostasis (Foreman et al., 2021).
Due to their high throughput, precision, sensitivity, and reproduction capability, omics approaches have attracted increasing interest in investigations on natural products from medicinal animals (Ning et al., 2023). Peptides can be found throughout a diverse range of animal species, from simple phyla with basic nervous systems, such as coelenterates, to advanced vertebrates, and are involved in numerous physiological functions in animals (Baggerman et al., 2004). In a previous study, peptidomics analysis based on a posttranslational modification (PTM) assay was utilized to discover specific peptide biomarkers of soft-shelled turtle gelatine (STG) (Xia et al., 2023). A study combining peptidomics with cDNA library analysis revealed that centipedes (Scolopendra subspinipes mutilans L. Koch. (SSLK)) contain diverse peptides (Rong et al., 2015). An integrated approach was used to characterize the natural peptidome of four different types of leeches, contributing to folk medicine (Liao et al., 2023). These studies illustrate the diverse applications of peptidomics in the field of wild or medicinal animals, highlighting the role of peptidomics in advancing our knowledge of bioactive peptides and their potential therapeutic uses.
Due to the complex chemical composition of musk, the difference in peptide composition between musk gland cell secretion and natural musk remains unknown, which impedes research progress on musk production by musk gland cells. With the development of cell biology, cell culture presents a significant opportunity in this context. Hence, it is crucial to study the differences in peptide composition between cultured musk gland cells and natural musk. As information about this phenomenon is limited, this study aimed to evaluate the differences in the peptidome between the two musk sources. To protect forest musk, we are committed to developing a sustainable alternative to musk production. To this end, the EASY-nLC 1000 ultrahigh-pressure nanoscale liquid chromatography system was utilized to analyze the variation in peptide composition among initial musk fluid, mature musk, and secreted musk fluid obtained from musk deer during the peak period of musk secretion. This study aimed to establish a theoretical foundation for future investigations on musk biosynthesis and large-scale musk production using cell engineering methods. This research also helps promote the conservation and sustainable utilization of musk deer, a nationally protected species.
Materials and Methods
Collection of Musk Gland Secretions (Musk)
Information on the samples of captive Chinese forest musk and cultured cells used for this assay is summarized in Table 1. Musk was separated by diethyl ether and absolute ethyl alcohol treatments (Li et al., 2016). This research was approved by the Ethical Animal Care and Use Committee of the Chongqing College of Traditional Chinese Medicine (approval number 20221124). All samples of the musk pouches used for peptidomics surveys were obtained directly from the musk gland scent pods of Chinese forest musk deer at the Chongqing Institute of Medicinal Plant Cultivation (Chongqing, China; altitude: 678 m).
Sample Information.
Musk Gland Cell Culture
In a sterile laboratory environment, type IV collagenase was added to the culture flasks and incubated in an incubator at 37°C for 5 h. Digestion was carried out with 0.25 mg/mL trypsin for approximately 15 min; then, the digestion was terminated using DMEM containing 10% fetal bovine serum (FBS), 2 mM glutamine, and 100 IU/mL penicillin-streptomycin. The digest was transferred to a 1.5 mL centrifuge tube and centrifuged at 600 r/min for 3 min, after which the supernatant was discarded. The cells were then resuspended in a complete culture medium (CCM) and centrifuged again, and this process was repeated three times to collect the dispersed cells. The density was adjusted to 1–5 × 10⁴/mL. The cells were inoculated in 25 mL cell culture flasks at 37°C, 5% CO2, and saturated humidity. After cell adhesion, the CCM was renewed, and the medium was changed every 24 h. When confluent monolayers of cells appeared, they were digested with 0.25 mg/mL trypsin for passaging culture. The CCM consisted of Ham’s F12 medium (Thermo Fisher Scientific), 20% FBS (GIBCO), 1% penicillin-streptomycin (GIBCO), 10 ng/mL epidermal growth factor (EGF), 2 mM glutamine (GIBCO), and 0.1 mM β-mercaptoethanol (Sanko). All cells were free of bacterial, yeast, fungal, and mycoplasma contaminants.
Sample Preparation and Peptide Extraction
The cell samples were loaded into three test tubes, with 25 mg of musk sample, and 500 µL of 75% methanol was added. One large and two small steel beads were added separately, and the mixture was ground at 35 Hz for 4 min. The samples were sonicated in an ice water bath for 5 min, and this process was repeated three times. After centrifugation at 12,000 rpm for 10 min at 4°C, 350 µL of the supernatant was collected. The samples were vacuum freeze-dried and set aside. The sample was dissolved in 400 µL of 0.1% FA and 2% acetonitrile solution (Buffer A). The desalting column was activated by centrifugation at 1,000 × g for 1 min using 400 µL of 0.1% FA and 80% acetonitrile solution (Buffer B). The desalting column was equilibrated with 400 µL of 0.1% FA and 2% acetonitrile solution (Buffer A) and centrifuged at 1,000 × g for 1 min. The sample was added to the desalting column and centrifuged at 1,000 × g for 1 min to retain the peptides in the desalting column. The desalting column was washed with 400 µL of 0.1% FA and 2% acetonitrile solution (Buffer A) and centrifuged at 1,000 × g for 1 min. The desalting column was placed into a new EP tube, and 200 µL of 0.1% FA and 80% acetonitrile solution (Buffer B) were added and centrifuged at 1,000 × g for 1 min to elute the peptides. The eluate was dried under vacuum, 25 µL of mobile phase A was added to redissolve the sample, and then 15 µL of the eluate was detected on the machine.
Nano LC–MS/MS Analysis
For each sample, 5 µL of total peptide was separated and analyzed with a nano-UPLC (EASY-nLC1200) coupled to a Q Exactive HFX Orbitrap instrument (Thermo Fisher Scientific) with a nanoelectrospray ion source. Separation was performed using a reversed-phase column (100 µL ID × 15 cm, Reprosil-Pur 120 C18-AQ, 1.9 µm, Dr. Maisch). The mobile phases were H2O with 0.1% FA, 2% ACN (phase A), 80% ACN, and 0.1% FA (phase B). Separation of the sample was executed with a 60-min gradient at a 300 nL/min flow rate. Gradient B: 2–5% for 2 min, 5–22% for 34 min, 22–45% for 20 min, 45–95% for 2 min, and 95% for 2 min.
Data-dependent acquisition (DDA) was performed in profile and positive mode with an Orbitrap analyzer at a resolution of 120,000 (@200 m/z) and a m/z range of 350–1,600 for MS1. For MS2, the resolution was set to 15,000 with a dynamic first mass. The automatic gain control (AGC) target for MS1 was set to 1E6 with a maximum IT of 50 ms, and the AGC target for MS2 was set to 1E5 with a maximum IT of 100 ms. The top 10 most intense ions were fragmented by HCD with a normalized collision energy (NCE) of 30% and an isolation window of 1.2 m/z. The dynamic exclusion time window was 30 seconds, and single-charged peaks and peaks with a charge exceeding 6 were excluded from the DDA procedure.
Database Search and Quantification
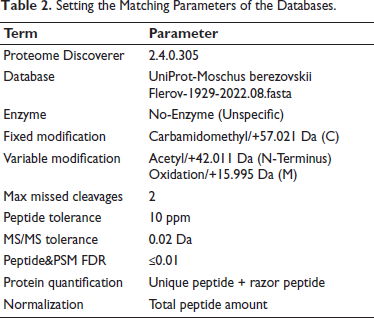
The raw data files were analyzed using Proteome Discoverer (PD) software and the built-in Sequest HT search engine, and the specific parameters are shown in Table 2. The vendor’s raw MS files were processed using PD software (version 2.4.0.305) and the built-in Sequest HT search engine. MS spectra lists were searched against their species-level UniProt FASTA databases (UniProt-Moschus berezovskii Flerov-1929-2022.08.fasta), with carbamidomethyl [C] as a fixed modification and oxidation (M) and acetyl (protein N-term) as variable modifications. No-Enzyme (Unspecific) was used as an enzyme. A maximum of two missed cleavages was allowed. The false discovery rate (FDR) was set to 0.01 for both the PSM and peptide levels. Peptide identification was performed with an initial precursor mass deviation of up to 10 ppm and a fragment mass deviation of 0.02 Da. Unique peptides and razor peptides were used for protein quantification, and the total peptide amount was used for normalization. All other parameters were set to their defaults.
Setting the Matching Parameters of the Databases.
Results
UPLC Validity Analysis
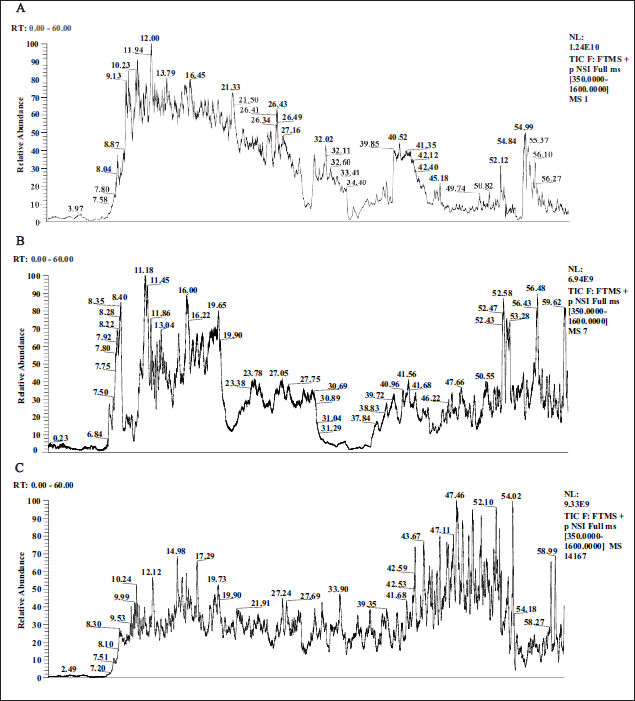
When analyzing a profile, we focus on the retention time (RT) of the peaks; the RT value of each peak represents the amount of time that the ion has been retained in the column, and different compounds have different RT values. In addition, we focus on the relative abundance of peaks, as the height of a peak can indicate the relative amount of that compound in the sample and the peak shape, as the shape and width of a peak can provide information about the purity and separation of a compound. By comparing and analyzing the standard substance plots, that is, the standard plots of mature musk, we can reveal similarities and differences between cultured cells secreting musk liquid (Figure 1A), initial musk (Figure 1B), and mature musk (Figure 1C). For musk gland cells, we might focus on the characteristic peaks that represent specific compounds involved in cell secretion and examine whether these peaks are present in mature musk and initial musk and how their relative abundance changes. These variations may reflect changes in compound composition from the early stages of musk maturation. First, we looked for peaks that are common to all three profiles, which revealed that certain compounds are present at different stages of musk maturation. Next, we noted peaks that appeared only in the musk gland cell or initial musk plots, which represent compounds that may have disappeared or changed during maturation. The absence of these peaks in the mature musk plot may indicate that these compounds were transformed or degraded during the maturation of the musk. Finally, we focused on peaks that only appear in the mature musk plot, as they may represent compounds unique to mature musk. These unique compounds may be newly synthesized during the maturation process or formed due to the transformation of certain precursor compounds.
Total Ion Chromatography of Musk Gland Cells (A), Initial Musk (B), and Mature Musk (C).
Principal Component Analysis (PCA)
In PCA, the goal is to reduce the dimensionality of the data by identifying the principal components that capture the most variance within the data. In the provided dataset, we included three samples (labeled musk gland cell, initial musk, and mature musk) and their corresponding protein abundance profiles across numerous proteins. To derive conclusions from the PCA score plot, we typically look for sample clustering, which indicates similarity in protein expression profiles, and the distance between the points, which can suggest differences in the protein composition between the samples. The principal components (PC1 and PC2) show the directions of maximum variance, and their percentage values indicate how much of the total variance is captured by each component.
Cluster of Orthologous Groups (COG) Analysis
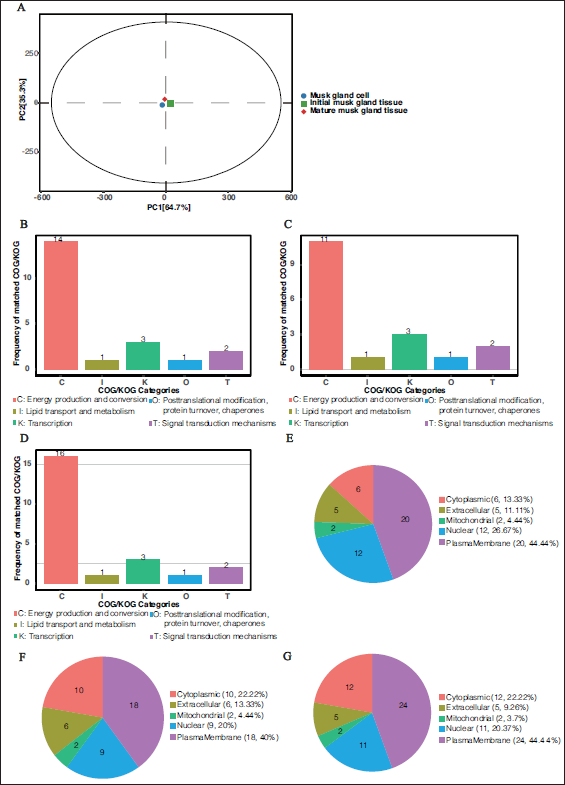
Figure 2A shows that the most significant difference in peptide expression for category C (energy production and conversion) was observed between secreted scent fluid and mature musk revealed, with a frequency of 14 matches, suggesting that energy metabolism may be significantly altered during secretion. In contrast, other categories, such as I (lipid transport and metabolism), K (transcription), O (PTM of proteins, turnover, and chaperone molecules), and T (signaling mechanisms), showed smaller differences in expression, with only 1, 3, 1, and 2 matching terms, respectively. Figure 2B shows the differential expression between the primordial sap and mature musk of forest musk at the peak of secretion. Category C still showed the highest frequency of differential expression (11 matching terms), supporting previous observations and suggesting that energy production and conversion play a key role in musk maturation. The differential expression frequencies for the other categories remained low, suggesting that these functional categories were less differentially expressed between the two samples. Figure 2C compares the first scent sap of musk from forest musk at the peak of secretion with the scent sap secreted, and the differential peptide expression of category C remained the highest (16 matches). These results suggest that the incubation process affected the expression of energy-related proteins.
Overall, category C genes exhibited significant differential expression in all three comparisons, suggesting that energy metabolism-related proteins play an important role in the cultivation of Linnaeus muscariae gland cells and the maturation of natural musk. This finding may have important implications for further studies to determine the mechanism of musk biosynthesis and optimize culture conditions. Future studies could further explore the specific functions of these proteins and how they affect the quality and yield of musk.
Subcellular Location Analysis
Subcellular location analysis revealed that most proteins were in the nucleus, cytoplasm, and plasma membrane (Figure 2E–G). The proteins were classified using a COG of proteins. To predict the potential functions of the endogenous peptides, we performed Gene Ontology (GO) and Kyoto Encyclopedia of Genes and Genomes (KEGG) pathway analyses of their precursor proteins. Figure 2E illustrates the differential peptide expression between cultured cell-secreted musk and mature musk tissue, with a significant proportion localized to the plasma membrane (44.44%), suggesting that more membrane-associated peptides were present in the cultured cell-secreted musk. In contrast, based on the peptides associated with the nuclear (26.67%) and cytoplasmic (13.33%) compartments, differential regulatory and metabolic processes may have occurred during maturation. Figure 2F compares the initial musk tissue obtained from Chinese forest musk deer and mature musk tissue, indicating a notable localization to the plasma membrane (44.44%), resembling the pattern in chart A. This may indicate that membrane-related processes are consistently pivotal throughout scent maturation. Figure 2G shows the differences in localization between mature musk tissue from Chinese forest musk deer and cultured cell-secreted musk, again revealing the plasma membrane (44.44%) as the primary site of differential peptide expression. Notably, nuclear localization (20%) was significantly represented, emphasizing the role of nuclear processes in the secretion of musk scent compounds.
The recurrent prominence of plasma membrane-associated peptides across the three conditions signifies their potential role in the biosynthesis and secretion mechanisms of musk. Nucleus-localized peptides may indicate that biosynthesis pathways are under robust regulatory control. These findings suggest that membrane-bound receptors and transporters, along with nuclear transcription factors, are integral to the synthesis of musk scent compounds and the regulation of this process. Subcellular localization profiles can provide insights into the cellular processes and environments from which musk is derived. For example, the greater presence of plasma membrane proteins in the experimental groups suggests that active transport and signaling processes occur during these stages. To clarify these findings, the identified proteins should be further investigated to determine their specific functions and how they contribute to the fragrance characteristics and biological properties of musk at different stages. Additionally, integrating these proteomics data with other omics analyses, such as transcriptomics, could provide a more comprehensive view of the molecular mechanisms that underly musk secretion and maturation.
General Characteristics of Peptidomics Identified by LC–MS/MS. (A) Principal Component Analysis (PCA) Plot of Musk Samples According to Data Obtained from the Nano LC-MS/MS Analysis. Each Dot Represents a Sample. Principal Component 1 (PC1) Explained 64.7% of the Variance Between Samples, As Shown on the x-axis. Principal Component 2 (PC2) Explained 35.3% of the Variance Between Samples and is Shown on the y-axis. (B) Differential Expression of Peptides in Cultured Cell-secreted Musk Compared to Mature Musk Tissue Analogous to Cluster of Orthologous Groups (COG) Analysis of Subordinate Proteins. (C) Differential Expression of Peptides in Initial Musk Tissue from Chinese Forest Musk Deer Compared to Mature Musk Tissue According to COG Analysis of Subordinate Proteins. (D) Differential Expression of Peptides in Cultured Cell-secreted Musk Compared to Initial Musk Tissue from Chinese Forest Musk Deer Analogous to COG Analysis of Subordinate Proteins. (E) Subcellular Localization Analysis of Differentially Expressed Peptides in Cultured Cell-secreted Musk Relative to Mature Musk Tissue. (F) Subcellular Localization Analysis of Differentially Expressed Peptides in Initial Musk Tissue from Chinese Forest Musk Deer Relative to Mature Musk Tissue. (G) Subcellular Localization Analysis of Differentially Expressed Peptides in Cultured Cell-secreted Musk Relative to Initial Musk Tissue from Chinese Forest Musk Deer.
Hierarchical Clustering Analysis
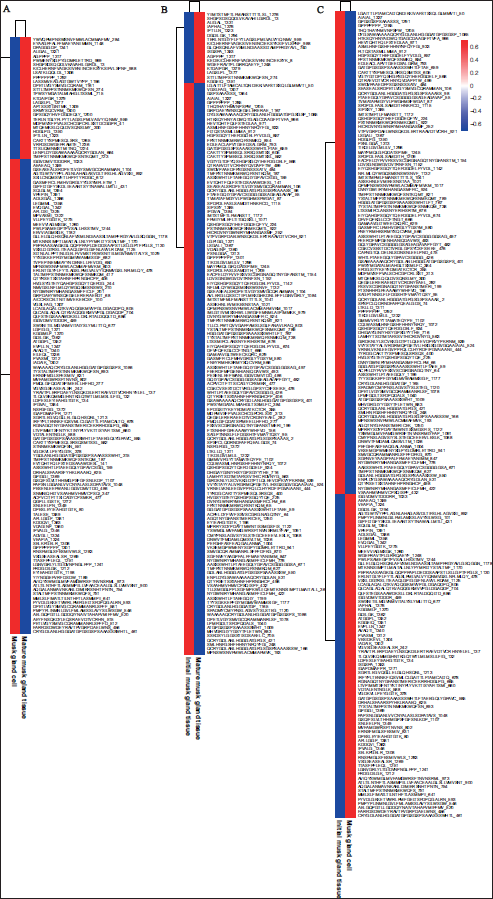
The horizontal axis of the heatmap denotes the different experimental groups, while the vertical axis represents the peptides with differential expression compared across groups. The color blocks indicate the relative expression levels of peptides at specific locations, with red signifying high expression and blue signifying low expression levels (Figure 3). The heatmap reveals distinct patterns of differentially expressed peptides both horizontally (among different experimental groups) and vertically (within the same group). The proximity of the peptides in the dendrogram-like structure suggests closer biological relationships—closer peptides are more closely related, and those farther apart are less closely related.
The results showed that the differentially expressed polypeptides exhibited a clear grouping pattern, both horizontally and vertically. In the horizontal direction, the differentially expressed polypeptides of musk gland cells and initial musk were significantly different from those of mature musk (Figure 3). The affinity between the differentially expressed polypeptides of musk gland cells and initial musk and between the differentially expressed polypeptides of mature musk was low, while the affinity between the differentially expressed polypeptides of musk gland cells and initial musk was high. This suggests that the musk liquid secreted by cultured cells is more different from the musk secreted by natural forest musk in terms of polypeptide composition, while the musk liquid secreted by cultured cells is more similar to the initial musk secreted by natural forest musk in terms of polypeptide composition.
In the longitudinal direction, the differentially expressed polypeptides of musk gland cells and initial musk showed significant differences from those of initial musk. The affinity between the differentially expressed polypeptides of musk gland cells and the differentially expressed polypeptides of initial musk was low, while the affinity between the differentially expressed polypeptides of experimental group 1 was high. This result suggests that the peptide composition of the musk liquid secreted by cultured cells changed with the extension of culture time.
Heatmap of Peptide Differential Expression by Hierarchical Clustering Analysis. (A) Differential Peptide Expression Between Musk Gland Cells and Mature Musk Gland Tissue. (B) Differential Peptide Expression Between Initial Musk Gland Tissue and Mature Musk Gland Tissue. (C) Differential Peptide Expression Between Initial Musk Gland Tissue and Musk Gland Cell. The Color Scale is Based on the Signal Intensity Deviation from the Mean (Z Score), with Blue Indicating Less Intense Signals and Red Indicating More Intense Signals.
GO Annotation Enrichment Analysis and KEGG Analysis
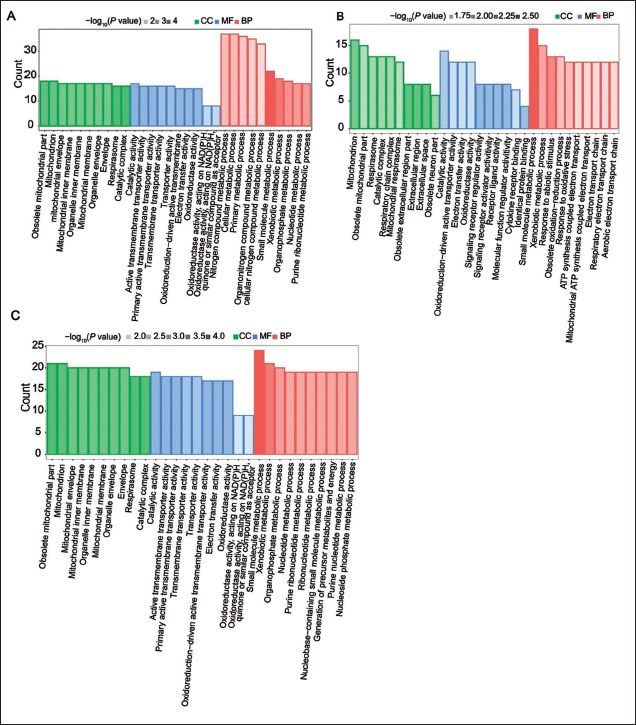
GO functional annotation is composed of three major components, namely, cellular components, molecular functions, and biological processes, and GO enrichment analysis of the peptides that were differentially expressed between musk gland cells and mature musk gland tissue was performed (Figure 4A). The most enriched GO terms were related to cellular metabolic processes. Figure 4B depicts the GO categorization for peptides differentially expressed between initial musk gland tissue and mature musk gland tissue. Notably, the GO terms associated with small molecule metabolic processes were strongly enriched. Figure 4C illustrates the GO enrichment of peptides differentially expressed between initial musk gland tissue and musk gland cell. Here, categories related to biological processes and cellular components, such as small molecule metabolic processes and mitochondria, were significantly enriched. GO enrichment analysis across the three conditions revealed insights into the biological themes associated with musk secretion. The data suggest that the biosynthesis of musk involves a complex network of molecular interactions and metabolic pathways. The observed differences highlighted potential target processes for increasing musk production or mimicking natural secretion profiles in systems.
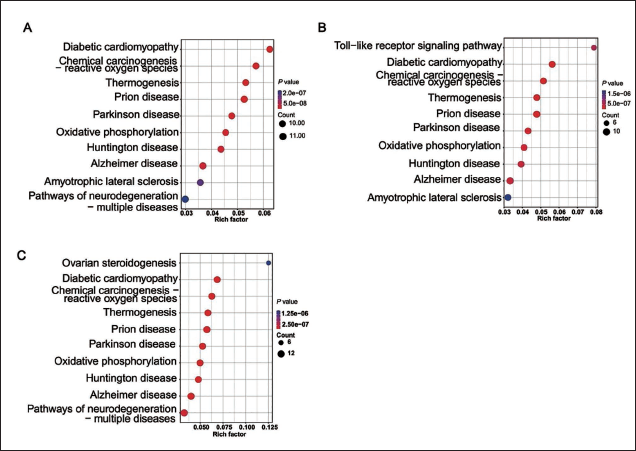
The KEGG pathway analysis highlights the complex biological processes involved in musk production. In Figure 5A, compared to mature musk gland tissue, musk gland cell secretions show significant enrichment in pathways such as diabetic cardiomyopathy, chemical carcinogenesis (reactive oxygen species), and thermogenesis, suggesting more active metabolic and stress-related processes. Figure 5B shows that initial musk gland tissue is enriched in thermogenesis, prion disease, and Parkinson’s disease pathways compared to mature musk gland tissue, indicating potential links to neurological processes during the maturation of musk scent. In Figure 5C, initial musk gland tissue, compared to musk gland cells, is enriched in pathways related to ovarian steroidogenesis, reactive oxygen species, and thermogenesis, emphasizing active metabolic regulation.
These KEGG analyses shed light on the intricate metabolic and regulatory networks underlying musk secretion. The differences in pathway enrichment provide critical insights into the molecular mechanisms driving scent compound synthesis, offering valuable guidance for future research on musk biosynthesis and conservation biology.
Gene Ontology (GO) Analysis of the Precursor Proteins of Musk. The Horizontal Coordinate is the GO Term, and the Vertical Coordinate is the Number of Mapped Peptide Precursor Proteins. Red Represents Information Regarding Biological Process Annotation, Green Represents Information on Cellular Composition Annotation, Blue Represents Information on Molecular Function Annotation, and Transparency Represents p Value. The Darker the Color is, the Smaller the p Value.
Kyoto Encyclopedia of Genes and Genomes (KEGG) Pathway Analysis of the Precursor Proteins of Musk. The Horizontal Axis Represents the Enrichment Degree Rich Factor Value, and the Vertical Axis Represents the KEGG Pathway Information. The Size of the Circle Represents the Number of Peptide Precursor Proteins in the Pathway; the Larger the Circle is, the Greater the Number. The Color of the Circle Represents the Corrected p Value; For Example, the Redder the Color is, the Smaller the Value.
Discussion
In the present study, the peptidomics of cultured gland cell secretions of forest musk and natural musk peptides were comprehensively compared utilizing the EASY-nLC 1000 system. This analysis underscores the potential of systems for mimicking the complex peptides in natural musk, an essential step toward sustainable musk production via cell engineering techniques.
Our findings revealed an overlap in peptide profiles between cultured cells and natural musk, confirming the ability of cultured cells to emulate natural biosynthesis processes (Liu et al., 2021). Nonetheless, the presence of unique peptides in natural musk that are absent from secretions underscores the influence of the in vivo environment. The disparity in peptide profiles suggests that factors beyond genetic programming, such as the microenvironment of the gland or the physiological state of the musk deer, play a crucial role in musk synthesis (Yang et al., 2021).
In biomedical research, musk has been increasingly recognized for its potential anti-inflammatory, anti-microbial, and anti-tumor properties (Wang et al., 2020). Functional annotation of the identified peptides via GO and KEGG analyses has provided insight into the metabolic and cellular processes that occur (Chen et al., 2015). The pathways enriched in the secretions predominantly encompass metabolic and cellular activities, which align with the documented anti-inflammatory, anti-microbial, and anti-tumor properties of musk. This link between the observed peptidome and the known pharmacological actions of musk lends credence to the therapeutic potential of synthesized musk peptides (Wang et al., 2022).
However, the functional implications of the differentially expressed peptides are not fully understood (Rao et al., 2020). While some of these peptides may represent mere byproducts of cellular metabolism, others could be key contributors to the pharmacological profile of musk (He et al., 2023). To delve into the specific roles of these peptides, a multidisciplinary approach that combines advanced omics technologies, biochemical assays, and in vivo studies will be needed (Foreman et al., 2021). The complexity of the natural synthesis and partial replication of musk present both a challenge and an opportunity. This finding emphasizes that the culture conditions must be further optimized to foster the production of therapeutically relevant peptides. This endeavor may involve modulating cellular stress responses, nutrient supply, or hormonal signaling within the culture system to more closely mimic the in vivo conditions of the musk gland (Deo et al., 2022).
In parallel, the elucidation of the enzymatic pathways and the interactions between precursor molecules in musk biosynthesis remain critical targets for research. A deeper understanding of these pathways will be instrumental in refining the cell engineering strategies necessary to produce musk (Tokic et al., 2018).
In conclusion, our findings contribute valuable knowledge to the field of musk biosynthesis and highlight the nuanced differences between natural and derived musk (Lv et al., 2022). Studies to replicate the full spectrum of the bioactive components of natural musk are fraught with complexities. Nevertheless, this topic represents a pivotal frontier in the sustainable production of musk for pharmaceutical applications. Future studies will need to bridge the gaps identified in this research, advancing our knowledge on musk’s biosynthetic orchestra to fully harness its therapeutic potential (Zhang & Too, 2020).
Conclusion
This study conducted a detailed comparison of peptide profiles between secretions from cultured gland cells and natural musk using advanced analytical methods, establishing a foundation for sustainable musk production. Our findings indicate that while cultured cells can partially replicate the peptide complexity of natural musk, there are notable compositional differences, highlighting the importance of the gland’s microenvironment and the musk deer’s physiological conditions. These differences underscore the need for optimizing culture conditions to mimic natural synthesis processes more effectively, potentially improving the therapeutic qualities of the produced musk. This research represents a step toward sustainable musk production that could aid in conserving musk deer and advancing pharmaceutical uses. Future efforts will aim to refine these culturing techniques and further investigate the medicinal properties of the identified peptides.
Footnotes
Abbreviations
CCM: Complete culture medium; EGF: Epidermal growth factor; FBS: Fetal bovine serum; GO: Gene Ontology; KEGG: Kyoto Encyclopedia of Genes and Genomes.
Declaration of Conflicting Interests
The authors declared no potential conflicts of interest with respect to the research, authorship, and/or publication of this article.
Ethical Approval and Informed Consent
All methods used in this study were conducted in accordance with relevant guidelines and regulations and approved by the Chongqing Institute of Medicinal Plant Cultivation (Approval No. 20220224).
Funding
The authors disclosed receipt of the following financial support for the research, authorship, and/or publication of this article: This research was funded by the Basic Research Project of Chongqing (cstc2021-jxjl001) and Chongqing Science and Technology Plan Project (cstc2021jscx-cylhX0004).