
Abstract
Background
Diabetes significantly increases morbidity and mortality rates, causing complications such as cardiovascular disease, kidney failure, and blindness.
Purpose
The aim of this study was to investigate the hepatoprotective effects of trigonelline (TRIG) in diabetic rats through the antioxidative, anti-inflammatory, and insulin-related IRS1-GLUT2 pathway.
Materials and Methods
In this experimental investigation, sixty male Wistar rats (n = 10/group) were randomly divided into six groups: a healthy group (HEL), healthy rats treated with 1500 and 3000 mg/kg of TRIG, a diabetic (D), and diabetic rats treated with 1500 and 3000 mg/kg of TRIG (D+ TRIG). The effects of TRIG on rats with induced diabetes were evaluated by serum biochemical parameters, such as insulin, tumor necrosis factor-α (TNF-α), interleukin-6 (IL-6), free fatty acids (FFA), nitric oxide, and adiponectin levels. The activities of hepatic carbohydrate metabolic enzymes (hepatic glucokinase, glucose 6-phosphatase, glycogen, and glucose-6-phosphate dehydrogenase) were also measured. Furthermore, the expression levels of genes and proteins associated with carbohydrate/lipid metabolism, including peroxisome proliferator-activated receptor gamma (PPARg), glucose transporter 2 (GLUT2), insulin receptor substrate 1 (IRS1), sterol regulatory element-binding protein 1c (SREBP-1c) were analyzed using real-time PCR and western blotting techniques, respectively. Liver sections were examined using H&E staining and immunohistochemistry targeting the p53 protein.
Results
The results showed that 3000 mg/kg TRIG was able to suppress TNF-α, IL-6, and FFA by inhibiting inflammatory pathways along with increasing the activity of antioxidant enzymes. TRIG treatment regulated serum levels of insulin, adiponectin, and hepatic carbohydrate metabolic enzymes as well as glycogen content by regulation of the IRS1/ GLUT2- SREBP-1c/ PPARg pathway.
Conclusion
These results provide evidence that TRIG has the potential to protect liver organs from oxidative damage in diabetic patients.
Introduction
Globally, diabetes incidence has risen significantly, with an estimated 463 million adults affected, which is projected to reach 700 million by 2045. Type 2 diabetes accounts for the majority of cases. Diabetes significantly increases morbidity and mortality rates, causing complications such as cardiovascular disease, kidney failure, and blindness (Cole & Florez, 2020). In 2019, diabetes directly caused 1.5 million deaths, with an additional 2.2 million deaths attributed to high blood glucose levels. Effective management is crucial in reducing diabetes-related complications and mortality, highlighting the importance of lifestyle modifications and early intervention (Padhi et al., 2020). Prolonged high levels of glucose and lipids in the blood cause inflammation and damage to the liver, primarily due to increased oxidative stress and the generation of reactive oxygen species (ROS). Growing evidence indicates that oxidative stress in the liver can induce molecular changes, including alterations in gene expression and microRNA levels, potentially leading to liver dysfunction (Blonde et al., 2022).
Insulin receptor substrate 1 (IRS1)/glucose transporter 2 (GLUT2)-sterol regulatory element-binding protein 1c (SREBP1c)/peroxisome proliferator-activated receptor gamma (PPARg) pathway is the most important regulator of liver-β cell axis and is required for the physiological control of glucose-sensitive genes, and its dysregulation in the liver leads to impaired glucose-stimulated insulin secretion. GLUT2, encoded by SLC2A2, transports glucose across cell membranes in tissues such as the liver, pancreatic β-cells, kidneys, and intestine. It aids insulin secretion by sensing glucose levels in β-cells, regulates the liver-β cell axis by influencing glucose metabolism, and is vital in glycogen synthesis and breakdown, ensuring blood glucose homeostasis (Shi et al., 2022). Also, GLUT2-mediated uptake of glucose in the liver is central to glycogen metabolism. IRS1 is crucial in insulin signaling, impacting insulin secretion, the liver-β cell axis, and glycogen metabolism. It mediates insulin effects in pancreatic β-cells, modulating intracellular pathways for insulin secretion. In the liver, IRS1 regulates glycogen synthesis and gluconeogenesis in response to insulin, influencing blood glucose levels. Additionally, it promotes glycogen synthesis and inhibits breakdown, contributing to glucose homeostasis. Dysregulation of IRS1 can lead to metabolic disorders such as insulin resistance and diabetes (Xia et al., 2023). SREBP1c primarily regulates lipid metabolism, impacting fatty acid synthesis and cholesterol homeostasis. While its direct involvement in insulin secretion and the liver-β cell axis is less studied, dysregulation affects these processes indirectly (Su et al., 2020).
Trigonelline (TRIG), a pyridine alkaloid with the chemical formula C7H7NO2 and a derivative of niacin (vitamin B3), has garnered attention for its potential health benefits, including antioxidant, anti-inflammatory, and neuroprotective properties, along with its role in improving glucose metabolism and insulin sensitivity. Abundant in coffee beans, TRIG undergoes partial degradation during roasting, yielding nicotinic acid (niacin), a precursor to the coenzyme NAD+ involved in metabolic processes (Liang et al., 2023). Explored for its pharmacological applications, such as anti-diabetic and neuroprotective effects, TRIG exhibits high bioavailability, is swiftly absorbed from the gastrointestinal tract, is metabolized in the liver, and is primarily excreted through the urine. Despite its promising aspects, further research is crucial to grasp its mechanisms and therapeutic potential fully. TRIG has served as a food additive to alleviate dry coughs, flatulence, diabetes, hyperlipidemia, diarrhea, and high fever while bolstering immunity against viral and bacterial infections (Nugrahini et al., 2020). In cell culture settings, TRIG has demonstrated anti-diabetic properties by enhancing glucose uptake and insulin sensitivity in both adipocytes and muscle cells. Additionally, it has been observed to mitigate oxidative stress and inflammation in cell lines implicated in diabetes development (Li et al., 2019). Animal trials have illustrated that supplementing with TRIG can ameliorate glucose tolerance, augment insulin secretion, and mitigate insulin resistance in models of diabetes (Yoshinari & Igarashi, 2010). Moreover, TRIG exhibits protective effects on pancreatic β-cells, responsible for insulin production (Liu et al., 2018). TRIG has been noted for its ability to enhance insulin sensitivity through the activation of insulin signaling pathways within cells, leading to improved glucose uptake and utilization, thereby potentially aiding in the regulation of blood sugar levels and promoting glucose homeostasis (Li et al., 2019). Moreover, research suggests that TRIG may augment glucose uptake by facilitating the translocation of glucose transporters (Glut4) to the cell membrane, which could benefit individuals with diabetes or insulin resistance by improving glucose metabolism (Wu et al., 2023).
These features intrigued us to delve into understanding the various elements that play a role in facilitating the anti-diabetic effects. Thus, the primary objective of this research was to investigate how TRIG impacts liver-related biochemical, molecular, and histological alterations in an experimental diabetic rat model.
Materials and Methods
Diabetes Induction
Type 1 diabetes was induced in rats by administering a subcutaneous injection of freshly prepared alloxan/0.1 M citrate buffer monohydrate solution (120 mg/kg body weight) after an 18-hour fast. For the non-diabetic group, an equivalent volume of citrate buffer without alloxan was injected to simulate drug administration. Six hours post-alloxan administration, an intraperitoneal injection of a 20% glucose solution was administered. Subsequently, the rats were provided access to a 5% glucose solution for the following 24 hours to prevent drug-induced fatal hypoglycemia. After 72 hours of alloxan treatment, hyperglycemia was confirmed using a portable glucometer (GlucoDr glucometer, Germany), and rats with blood glucose levels exceeding 250 mg/dl were classified as diabetic (Raafat et al., 2021).
Experimental Animals
Sixty male Wistar rats, weighing 200 ± 30 g and aged 6 weeks, were utilized for the study. They were randomly divided into six groups, each comprising 10 rats, and accommodated in a controlled environment with a 12-hour light/12-hour darkness cycle, maintaining a temperature of 22 ± 3°C and humidity of 40 ± 3%. The rats were provided with standard laboratory pellets and access to clean tap water. Ethical approval was obtained from the ethics committee of Nanchang People’s Hospital adhering to internationally accepted guidelines for laboratory animal care established by the Canadian Council on Animal Care in 1993. The experimental groups were structured as follows: Group 1 (HEL): healthy rats received 1 cc normal saline daily via gavage; Group 2 (D): diabetic rats induced with 120 mg/kg alloxan via subcutaneous injection; Groups 3 and 4 (TRIG + D): diabetic rats treated with 1,500 and 3,000 mg/kg TRIG via gavage; Groups 5 and 6 (TRIG): healthy rats administered with 1,500 and 3,000 mg/kg TRIG via gavage. TRIG was administered daily at 9:00 am for 50 days, with dosages and timings meticulously determined for safety and efficacy based on literature review, preliminary investigations, and LD50 technique. Mortality rates were monitored, and Kaplan–Meier curve analysis was conducted to evaluate rat survival throughout the study (Gong et al., 2023; Konstantinidis et al., 2023).
TRIG LD50 Assay
To ascertain the optimal therapeutic dosage of TRIG with minimal toxicity, Lork’s two-step technique was utilized. Initially, nine male rats were divided into three groups (n = 3/group) and administered doses of 100, 1,000, and 10,000 mg/kg of TRIG via gavage. Subsequently, three additional rats were individually assigned to groups and given doses of 200, 2,000, and 20,000 mg/kg of TRIG via gavage. Close monitoring of the rats was conducted for 24 hours. Using a specific formula, the LD50 (the dose at which 50% of the rats exhibited adverse effects) of TRIG was determined. Based on these findings, a safe and efficacious dosage of TRIG was selected for the study. This methodological approach aimed to pinpoint a therapeutic dose of TRIG capable of reducing tumor growth while mitigating toxicity and adverse reactions in the rats. In this context, the symbol A denotes the lowest dose inducing toxic symptoms such as weight loss, diarrhea, nausea, skin rashes, or mortality, while B signifies the highest dose administered with no observed toxicity or mortality (Karuppiah, 2021).
LD50 = (A × B)1/2
Biochemical Analysis
On day 51 of the experiment, rats were weighed and euthanized following standard laboratory protocols, employing ketamine (80 mg/kg) and xylazine (i.p.) (15 mg/kg). Blood samples were collected via cardiac puncture for biochemical analysis. Serum insulin levels were determined using a commercial rat insulin ELISA kit following the manufacturer’s guidelines (Demeditec, Germany). The concentration of serum-free fatty acids (FFA) was quantified utilizing an Abcam free fatty acid kit (Abcam, USA). ROS levels in the serum of experimental groups were assessed through ELISA (nitric oxide level, ZellBio, ZellBio GmbH, Germany). Serum tumor necrosis factor-alpha (TNF-α) and IL-6 are pro-inflammatory cytokines; adiponectin levels were measured as per the manufacturer’s instructions (Abcam, UK) (Sun et al., 2020).
Hepatic Carbohydrate Metabolic Parameters
A segment of the collected liver tissue was homogenized in Tris-HCl buffer (100 mM, pH = 7.4) and then centrifuged at 3,000×g for 10 minutes at 4°C. The resulting supernatant was utilized to assess the activity of carbohydrate-metabolizing enzymes. The protein concentration in the supernatant was determined using the Bradford method. Hepatic activities of glucokinase (GK), glucose-6-phosphate dehydrogenase (G6PD), glucose-6-phosphatase (G6Pase), and glycogen content were analyzed in the liver tissues of experimental rats following established protocols (Al-Adsani et al., 2022).
IRS1, GLUT2, SREBP1c, and PPARg Gene Expression
The Bio Basic column animal total RNA purification kit (RNX-Plus kit, Iran) was employed to isolate total RNA from both spleen and femur bone marrow (BM) samples. The extraction procedure adhered to the manufacturer’s guidelines for processing frozen tissues. Subsequently, the quality and purity of the extracted RNA were evaluated using a Nano-Drop spectrophotometer (ND-1000; USA) for A260/A280 and A260/A230 nm ratio, along with a 2% agarose gel. Finally, the extracted RNA was stored at −80°C for future applications (Wang et al., 2021).
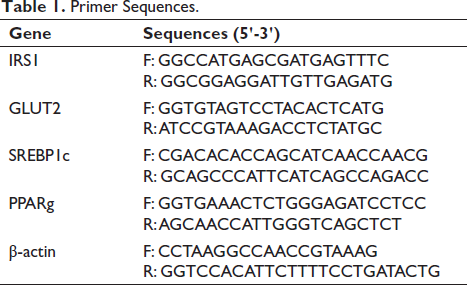
Subsequently, 1 µg of isolated total RNA underwent reverse transcription to generate complementary DNA (cDNA) using the BioFact™ cDNA synthesis kit (catalog number: BR123-R10k, BioFact™ RT Series, Korea) following the manufacturer’s instructions. Real-time quantitative PCR (qPCR) was conducted using YTA SYBR Green qPCR Master Mix (Takara Bio Inc., Shiga, Japan) on a StepOnePlus Real-time PCR system (Applied Biosystems, USA) with optimized cycles. The cDNA was amplified using gene-specific primer pairs listed in Table 1, with primer specificity verified through the melting curve analysis. The thermal cycling protocol comprised 42 cycles, commencing with annealing for 5 seconds at 72°C. Each reaction was performed in triplicate. The transcription of the β-actin housekeeping gene served as the internal control for normalization. The relative mRNA expression of the target genes was determined using the 2−∇∇Ct method.
Primer Sequences.
∆∆CT = [(mCTtarget − mCTreference) test sample − (mCTtarget − mCTreference) control sample]
Finally, the target mRNA expression levels were determined using the following formula: target mRNA expression levels = 2−∆∆CT (Wang et al., 2021).
IRS1, GLUT2, SREBP1c, and PPARg Protein Expression
To evaluate IRS1, GLUT2, SREBP1c, and PPARg protein expression, Western blotting was utilized. Initially, 50 mg of liver tissue underwent a wash with 200 µl of PBS, and the homogenized liver tissue was lysed using radio-immunoprecipitation assay buffer containing 150 mmol/l NaCl and 50 mmol/l Tris-HCl. The resulting mixture underwent centrifugation at −4°C for 10 minutes at 12,000 g. Subsequently, 50 µg of the resulting mixture was combined with 10 µl of loading buffer consisting of 5 µl sodium deoxycholate, 1 µl β-mercaptoethanol, 62.5 mmol/l Tris-HCl, and 5 µl glycerol. After a 10-minute incubation, the mixture was transferred to a PVDF (polyvinylidene fluoride) membrane. A Millipore SDS gel 10% (UK; catalog number: WBKLS0100) was loaded with the resulting mixture. The PVDF membrane, featuring GeneTex IRS1 (catalog number: sc-8038; 1:500), GLUT2 (catalog number: sc-518022; 1:200), SREBP1c (catalog number: sc-365513; 1:500), and PPARg (catalog number: sc-7273; 1:200) antibodies from Santa Cruz Biotechnology, USA, was incubated overnight at 4°C. Subsequently, an HRP-conjugated secondary antibody was added and incubated for 1 hour at 37°C. Excess antibodies were blocked using 0.05% Tween-20 and Tris-buffered saline. Finally, Bio-Rad software was employed to record and evaluate the signals of protein bands, and ImageJ software was utilized for further analysis (Retnaningtyas et al., 2022).
Immunohistochemistry Assay
Detecting p53-positive cells in liver tissues served as an indication of apoptotic differentiation in tumor cells. Liver tissues were washed with PBS and underwent standard tissue processing, resulting in the formation of paraffin blocks. Sections measuring 5 µm were mounted on slides and underwent overnight incubation at 95°C with primary p53 antibodies (1:500; catalog number: GAF1355, R&D Systems, Inc., USA). Subsequently, the slides were incubated for 1 hour at 25°C. Tween-20 was utilized as the washing buffer, and residual antibodies were blocked using 5% bovine serum albumin. Following this, the slides were treated with 3% hydrogen peroxide (H2O2) for 20 minutes at 25°C, followed by staining with 3,3′-diaminobenzidine (DAB). Hematoxylin was employed for counterstaining all slides. An optical microscope (Model No. BX61TRF; Olympus, Japan) connected to ImageJ software was used to examine the slides at a magnification of 100× in 10 random fields (Yuan et al., 2022).
Histopathological Assay
The liver tissues underwent fixation in 10% formalin for 72 hours, followed by a gentle rinse with phosphate-buffered saline (PBS). Subsequently, the samples were dehydrated in escalating concentrations of ethanol, cleared in xylene, and embedded in paraffin wax. Sections measuring 5 µm were obtained from the paraffin blocks using a microtome (LEICA SM2010RV1.2 microtomes, Germany) and then dried in an incubator at 37°C. Slides were prepared for hematoxylin and eosin (H&E) staining. A light microscope at ×400 magnification was employed for histological analysis of the slides. The images were captured using a calibrated light microscopic system (Model No. BX61TRF; Olympus, Japan) and processed with ImageJ software (Ali et al., 2021).
Statistical Analysis
The survival rate data were subjected to analysis using the Kaplan–Meier test. Statistical analyses were carried out using IBM Inc.’s SPSS software (Ver. 16) (SPSS, Inc., Chicago, IL, USA). To assess the mean differences between groups, a one-way ANOVA analysis was performed (p < 0.05 considered statistically significant). GraphPad Prism software version 8.4.3 (La Jolla, CA, USA) was employed for designing graphs, and all results were expressed as mean ± SD. Furthermore, the Newman–Keuls post hoc test was applied.
Results
Liver, Body Weight, and Survival Rate (%)
Diabetes led to a noteworthy (p < 0.05) decrease in the rats’ weight and a notable (p < 0.05) increase in liver weight compared to the HEL group. Conversely, diabetic rats administered TRIG (in D + 1,500 and 3,000 TRIG groups) exhibited a dose-dependent increase in their weight and a significant (p < 0.05) decrease in liver weight compared to the D group (Figure 1a).
(a) The Rat’s Mean Body Weight (BW) and Liver Weight (g). (b) Kaplan–Meier Survival Rate (%) in Different Groups (n = 10/Group; Values Are Means ± SD). *(p < 0.05) D Versus HEL Group; #(p < 0.05) D + 1,500 and 3,000 mg/kg TRIG-treated Groups Versus D.
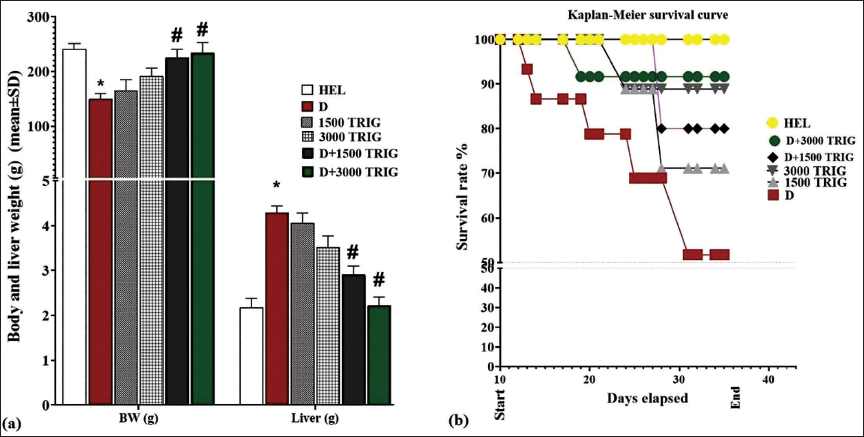
The survival rate (%) of rats was assessed throughout the study, and results on the 51st day indicated that D significantly reduced rat survival compared to the HEL group. Conversely, diabetic rats administered TRIG (in the D + 3,000 TRIG group) exhibited an increased survival rate (%) compared to the D group (Figure 1b).
FFA, NO, and Insulin Serum Levels
Compared to HEL, diabetes significantly (p < 0.05) reduced insulin levels, while levels of FFA and NO increased significantly (p < 0.05). However, in the D + 3,000 TRIG group, TRIG caused a significant (p < 0.05) increase in insulin levels and a significant (p < 0.05) decrease in FFA and NO compared to the D group (Figure 2a).
The Mean Serum Levels of (a) Insulin (µU/ml), FFA (mg/ml), and NO (U/ml). (b) IL-6, TNF-α (pg/ml), and Adiponectin (µg/ml) in Different Groups (n = 10/Group; Values Are Mean ± SD). *(p < 0.05) D Versus HEL Group; #(p < 0.05) D + 1,500 and 3,000 mg/kg TRIG-treated Groups Versus D.
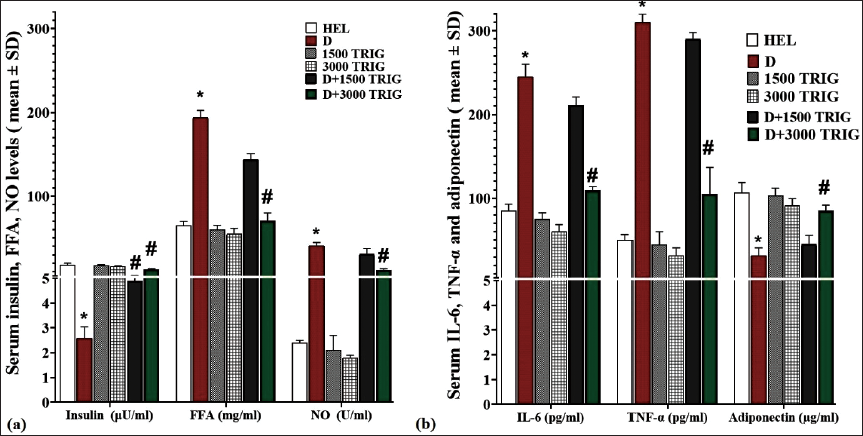
IL-6, Adiponectin, and TNF-α Serum Levels
Diabetes-induced systemic inflammatory pathways resulted in a significant (p < 0.05) increase in IL-6 and TNF-α levels and a notable (p < 0.05) decrease in adiponectin levels compared to the HEL group. However, diabetic rats administered TRIG in the D + 3,000 TRIG group exhibited a significant (p < 0.05) reduction in pro-inflammatory cytokines IL-6 and TNF-α levels and a significant (p < 0.05) increase in adiponectin levels compared to the D group (Figure 2b).
Effect of TRIG on Liver Glycogen Content and Activities of Hepatic Carbohydrate Metabolic Enzymes (GK, G6PD, and G6Pase)
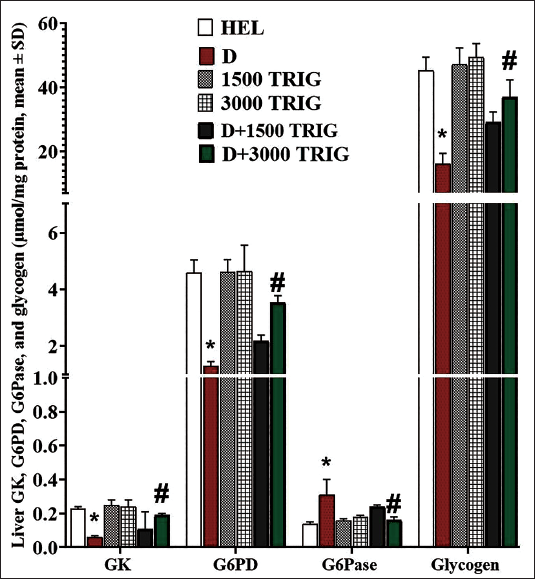
Diabetes significantly (p < 0.05) reduced glycogen content and the activity of G6PD and GK while increasing (p < 0.05) G6Pase activity compared to the HEL group, indicating disrupted carbohydrate metabolism. However, TRIG administration in the D + 3,000 TRIG group significantly (p < 0.05) increased glycogen content by regulating carbohydrate metabolism. Furthermore, it led to a significant (p < 0.05) increase in G6PD and GK activity and a significant (p < 0.05) decrease in G6Pase activity compared to the D group (Figure 3).
The Mean Hepatic GK, G6PD, G6Pase, and Glycogen Content (µmol/mg Protein) in Different Groups (n = 10/Group; Values Are Mean ± SD). *(p < 0.05) D Versus HEL Group; #(p < 0.05) D + 1,500 and 3,000 mg/kg TRIG-treated Groups Versus D.
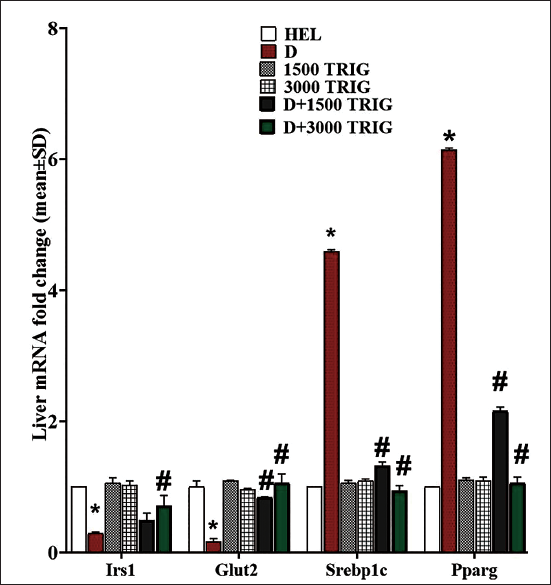
Effects of Diabetes and TRIG on Hepatic IRS1, GLUT2, SREBP1c, and PPARg Gene Expression
In comparison to the HEL group, diabetes notably (p < 0.05) decreased hepatic IRS1 and GLUT2 gene expression while significantly (p < 0.05) increasing the expression of hepatic SREBP1c and PPARg genes. Conversely, TRIG administration in the D + 3,000 TRIG group significantly (p < 0.05) upregulated hepatic IRS1 and GLUT2 gene expression and downregulated hepatic SREBP1c and PPARg gene expression compared to the D group (Figure 4).
Expression of Liver Tissue IRS1, GLUT2, SREBP1c, and PPARg Genes in Different Groups (n = 10/Group; Values Are Mean ± SD). *(p < 0.05) D Versus HEL Group; #(p < 0.05) D + 1,500 and 3,000 mg/kg TRIG-treated Groups Versus D.
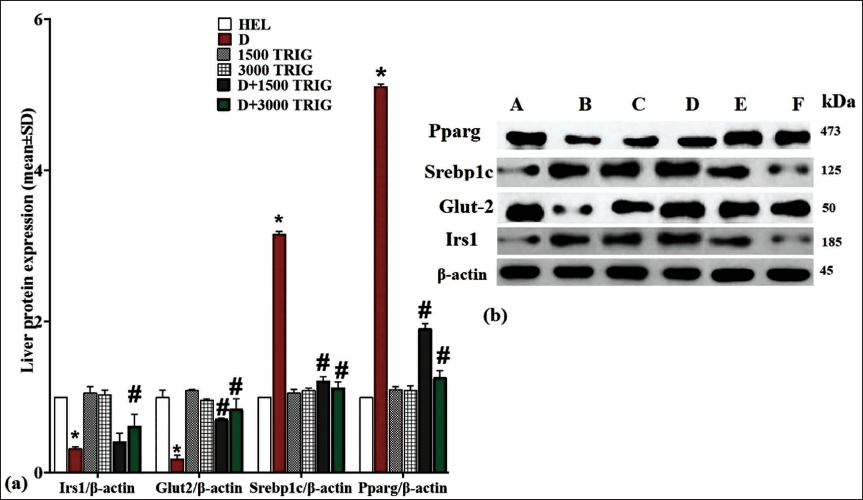
Effects of Diabetes and TRIG on Hepatic IRS1, GLUT2, SREBP1c, and PPARg Protein Expression
Compared to the HEL group, diabetes led to a significant (p < 0.05) decrease in hepatic IRS1 and GLUT2 protein expression and a significant (p < 0.05) increase in hepatic SREBP1c and PPARg protein expression. However, TRIG administration in the D + 3,000 TRIG group significantly (p < 0.05) increased hepatic IRS1 and GLUT2 protein expression while significantly (p < 0.05) decreasing hepatic SREBP1c and PPARg protein expression compared to the D group (Figure 5a and 5b).
(a, b) Expression of Liver Tissue IRS1, GLUT2, SREBP1c, and PPARg Proteins in Different Groups (n = 10/Group; Values Are Mean ± SD). *(p < 0.05) D Versus HEL Group; #(p < 0.05) D + 1,500 and 3,000 mg/kg TRIG-treated Groups Versus D.
Histopathology and Immunohistochemical Findings
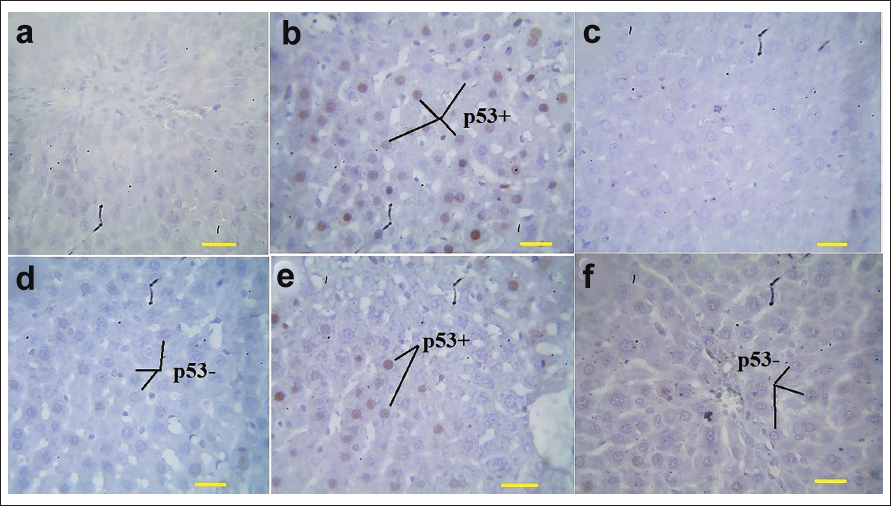
In assessing hepatocyte apoptosis rates via p53 protein immunohistochemistry, diabetes notably (p < 0.05) increased p53-positive cells compared to the HEL group. Conversely, TRIG administration (in the D + 1,500 and 3,000 TRIG groups) dose dependently led to a significant (p < 0.05) decrease in p53-positive hepatocytes compared to the D group (Figure 6).
The Mean p53-positive Cells (%) in Liver Tissues by Immunohistochemistry in Different Groups (n = 10/Group; Values Are Mean ± SD). *(p < 0.05) D Versus HEL Group; #(p < 0.05) D + 1,500 and 3,000 mg/kg TRIG-treated Groups Versus D. P53+: p53-positive Cells and p53−: p53-negative Cells.
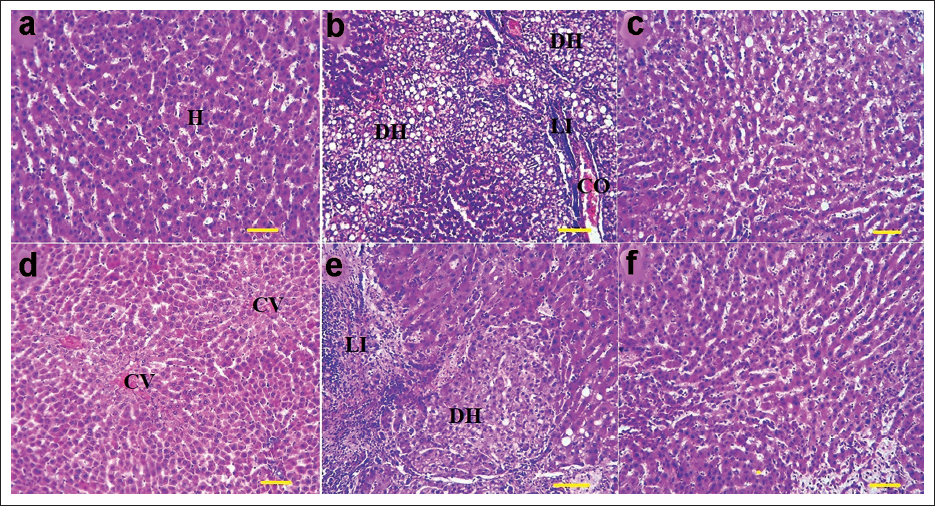
The liver histopathology findings revealed that compared to the HEL group, diabetes induced structural damage to liver lobules and the port triad. In diabetic rats, evident central venule congestion, increased liver sinusoid volume, and hepatocyte lipid accumulation were observed. Lymphocyte infiltration and collagen accumulation led to fibroblast-induced hepatocyte scarring. Tissue parenchyma architecture was disrupted, and irregular tissue and lipid accumulations were present in the Disse space. Treatment with TRIG restored normal liver lobule architecture and port triad structure in a dose-dependent manner. Lipid accumulation and lymphocyte infiltration were notably reduced, especially with the 3,000 TRIG dose (in the D + 3,000 TRIG group). Disse space and hepatic sinusoids were devoid of lipid accumulation and congestion, with the central venule displaying a normal diameter. These changes elucidate the relationship between liver structure and function across different groups (Figure 7).
The Liver Histopathology in HEL (a), D (b), 1,500 TRIG (d), 3,000 TRIG (e), D + 1,500 TRIG (f), and D + 3,000 TRIG (g) (H&E, ×400; Scale Bar = 25 µm). H: Normal Hepatocytes, DH: Degenerated Hepatocytes, CO: Congestion, LI: Lymphatic Infiltration, and CV: Central Venule.
Discussion
Diabetes represents a diverse metabolic condition marked by elevated blood sugar levels due to compromised carbohydrate metabolism and insulin secretion (Smith et al., 2007). The primary aim of diabetes treatment is to restore normal blood glucose levels and enhance overall health. A growing inclination exists toward employing traditional herbal remedies for managing diabetes. The results of this research indicate that TRIG exhibits antioxidant and anti-inflammatory properties, effectively mitigating ROS and lipid peroxidation in diabetic rats. Furthermore, TRIG treatment regulates insulin and adiponectin serum levels, as well as hepatic carbohydrate metabolic enzymes and glycogen content by modulating the IRS1/GLUT2-SREBP1c/PPARg pathway. These favorable outcomes underscore TRIG’s potential in modulating the liver-β cell axis among diabetic individuals. One of the key factors contributing to diabetic complications is the dysregulation of ROS and nitric oxide (NO) levels. Chronic hyperglycemia leads to increased ROS production primarily through mitochondrial dysfunction, advanced glycation end product (AGE) formation, and activation of various metabolic pathways, such as the polyol pathway and protein kinase C (PKC) pathway. ROS, including superoxide anion (•O2−), hydrogen peroxide (H2O2), and hydroxyl radicals (•OH), cause oxidative stress by damaging hepatic and pancreatic β cell structures such as lipids, proteins, and DNA. Diabetes is associated with chronic low- to high-grade inflammation characterized by elevated levels of inflammatory cytokines such as TNF-α, IL-6, IL-8, and IL-1β (Mukai et al., 2022). Studies have shown that inflammatory cytokines caused by diabetes inhibit the insulin signaling pathway by deactivating downstream signaling cascades, including the PI3K/Akt pathway and the MAPK pathway. In addition, these cytokines, along with ROS, induce apoptosis in pancreatic β-cells and hepatocytes through the effect on mitochondrial apoptotic pathways such as p53, p21, Akt, MAPK, and ATM (Ling et al., 2017). In this study, diabetic rats exhibited elevated NO levels, along with a significant increase in their FFA levels compared to the HEL group. Moreover, diabetes resulted in heightened levels of pro-inflammatory cytokines (TNF-α and IL-6) and a concurrent decrease in adiponectin levels. The findings align with recent animal model investigations conducted by Smith et al. (2007) and Lee et al. (2017). The sequence of outcomes remained consistent across both rat and mouse models. Therefore, these studies similarly demonstrated that diabetes induced by alloxan in animal models leads to elevated systemic levels of IL-6 and TNF-α (Lee et al., 2017; Smith et al., 2007). Zhou et al. (2013) conducted a study on the initial effects of TRIG extracted from Mirabilis jalapa L. on diabetes in rats. Their findings revealed that this alkaloid reduced blood glucose, total cholesterol, and triglyceride levels in diabetic rats, while concurrently increasing levels of endogenous antioxidant enzymes such as superoxide dismutase and catalase (Zhou et al., 2013). Similarly, Li et al. (2019) observed in a diabetic rat model that TRIG administration reduced diabetic nephropathy and TNF-α levels by modulating the PPARg pathway. In our current study, TRIG supplementation resulted in decreased nitric oxide, TNF-α, and IL-6 levels in diabetic rats, consequently lowering the activation of mitochondrial apoptotic pathways and reducing the percentage of p53-positive cells. Elsheikh et al. (2023) demonstrated that TRIG offers protective effects by inhibiting mitochondrial apoptosis via the Bax/Bcl-2-p53-caspase-3 pathway, downregulating inflammatory pathways associated with TNF-α and IL-6 and enhancing antioxidant pathways such as mTOR, AKT, and PI3K. Moreover, TRIG conferred protection against oxidative damage induced by triphenyltin chloride in the testis (Elsheikh et al., 2023).
Recent research has underscored the significance of IRS1 and GLUT2 in governing glycogen synthesis and storage in liver and muscle tissues, along with their roles in insulin pathways. These proteins serve as crucial mediators of insulin signaling in hepatocytes and myocytes, facilitating glucose conversion into glycogen via glycogen synthase activation (Dong et al., 2006). Dysregulated IRS1 signaling is implicated in impaired glycogen metabolism seen in insulin resistance and type 2 diabetes mellitus. Acting as key adaptor proteins, IRS1 transmits signals from the insulin receptor to downstream pathways such as PI3K/Akt and MAPK. Aberrant phosphorylation and protein expression levels of IRS1 and GLUT2 are associated with insulin resistance and disrupted glucose homeostasis in metabolic disorders (Shi et al., 2022). SREBP1c and PPARγ, transcription factors pivotal in lipid metabolism, adipogenesis, and glucose homeostasis, exhibit an intricate interplay with insulin signaling pathways. Recent investigations have highlighted this crosstalk, elucidating their roles in regulating lipid and glucose metabolism. Animal models employing SREBP1c and PPARγ knockout or overexpression have provided valuable insights into their impact on insulin sensitivity, adipose tissue function, and hepatic lipid metabolism (Su et al., 2020; Xia et al., 2023). Pharmacological modulation of SREBP1c and PPARγ shows promise in ameliorating insulin sensitivity and glycemic control in experimental diabetes models (Naiini et al., 2024). Saliani et al. (2023) demonstrated that diabetes induction with alloxan diminishes the activity of liver enzymes involved in insulin and glycogen synthesis pathways, including GK, G6PD, G6Pase, and fructose-1,6-bisphosphatase (FBPase). Additionally, their findings revealed a reduction in the expression of hepatic IRS1 and GLUT2, alongside an elevation in the expression of SREBP1c (Saliani et al., 2023). Research indicates that diabetes can impact various molecular pathways, such as Notch/AKT/mTOR, IL-6/STAT3, p53/miR-34a/SIRT1, and PI3K/AKT/mTOR, as well as p-53/p-21, which regulate the cell cycle at G1 and G2/M phases and influence the expression of cyclin-dependent kinases (CDKs), particularly CDK-2, in liver and pancreatic parenchymal cells (Huang et al., 2018; Kartika et al., 2020). Ahmed et al. (2019) demonstrated that alloxan-induced diabetes can enhance hepatocyte apoptosis by upregulating the Bax/Bcl-2-p53-caspase-3 pathway. Tharaheswari et al. (2014) demonstrated that TRIG conferred protection to the pancreas in diabetic rats by reducing levels of FFA, TNF-α, IL-6, and nitric oxide, while also inhibiting the PPARγ pathway (Tharaheswari et al., 2014). In our current study, TRIG supplementation increased the activity of carbohydrate-metabolizing enzymes (G6PD, G6Pase, and GK) by modulating the IRS1/GLUT2-SREBP1c/PPARg pathway, thereby enhancing liver glycogen metabolism.
Conclusion
The outcomes of this research suggest that TRIG exhibits antioxidative and anti-inflammatory characteristics, effectively diminishing ROS and lipid peroxidation in diabetic rats. Furthermore, TRIG administration regulated insulin and adiponectin serum levels, along with the activity of hepatic carbohydrate metabolic enzymes and glycogen content, by influencing the IRS1/GLUT2-SREBP1c/PPARg pathway. These encouraging findings underscore TRIG’s potential in modulating the liver-β cell axis in diabetic individuals. Moving ahead, it is recommended to progress through preclinical phases and delve deeper into additional pathways associated with TRIG’s effects using various human and animal models. Consequently, given the observed advantages, investigating TRIG as a supplementary therapy for diabetic patients could be justified.
Abbreviations
FRAP: Ferric-reducing antioxidant power; IRS1: Insulin receptor substrate 1; SDS: Sodium dodecyl sulfate polyacrylamide; GK: Glucokinase; G6PD: Glucose-6-phosphate dehydrogenase; GLUT2: Glucose transporter 2; PBS: Phosphate-buffered saline; G6Pase :Glucose-6-phosphatase; TBARS: Thiobarbituric acid reactive substances; DAB: 3,3′-Diaminobenzidine; SREBP1c: Sterol regulatory element-binding protein 1c; MDA: Malondialdehyde; PPARg: Peroxisome proliferator-activated receptor gamma; CAT: Catalase; NF-κB: Nuclear factor-kappa B; TRIG: Trigonelline; FFA: Free fatty acids
Authors’ Contributions
SL and ML: Concept and Design.
ML and SJ: Material and data collection.
WL: Analysis, supervision, and interpretation.
Footnotes
Declaration of Conflicting Interests
The authors declared no potential conflicts of interest with respect to the research, authorship, and/or publication of this article.
Ethical Approval
The experimental protocols of this study were approved by The People’s Hospital of Nanchang ethics committee.
Funding
The authors received no financial support for the research, authorship, and/or publication of this article.