
Abstract
Background
Different parts of radish, such as the roots, leaves, and seeds, can be used in culinary and traditional medicine treatments in East Asia.
Objectives
The aim of this study was to explore the difference of Raphani Semen (RS) which is sourced from radishes (R) with red skin (RRS), green skin (GRS), and white skin (WRS) through their appearance and chemical characteristics.
Materials and Methods
A total of 25 batches of RRS, GRS, and WRS products were collected. The length, width, thickness, shape, flavor, and skin color of RS were carried out using vernier caliper and flavor rating assessment, respectively. The HPLC-DAD method was used to establish fingerprint analysis and measure the contents of sinapine thiocyanate and 3,6’-disinapoyl sucrose.
Results
It was shown that the appearance and content varied in RRS, GRS, and WRS. In addition, the method of PLS-DA and LDA can differentiate RRS, GRS, and WRS.
Conclusion
RS is diverse, and the appearance and chemical characteristics can be used to differentiate RRS, WRS, and GRS.
Introduction
Radish is an important worldwide vegetable with wide varieties. It mainly contains three types of skin colors that are red, green, and white. The research showed that radishes with a wide variety of colors affect their chemical constituents and nutritional quality. The content of flavonoids, glucosinolates, isothiocyanate, and anthocyanin are different in radishes with a wide variety of skin colors (Hanlon & Barnes, 2011; Zhang et al., 2020). It was also found that there was rich genetic diversity between red and white fleshy radish varieties. This diversity is mainly reflected in a series of insertion or deletion events, the difference in a single nucleotide in a DNA sequence, and units present in a DNA sequence (Kim et al., 2021). Raphani Semen as a dried and mature seed of radishes has various medicinal uses, such as regulation of fatty liver (Park et al., 2021), hypertension (Li et al., 2015), and intestinal motility (Yang et al., 2021), and is listed in Pharmacopoeia of the People’s Republic of China (Chinese Pharmacopoeia Commission, 2020). Raphani Semen from different types of radish varieties and cultivars may also have lots of diversity. This paper explores the difference between radishes with red skin, green skin, and white skin with their appearance and chemical characteristics and aims to establish a suitable method.
Materials and Methods
Materials
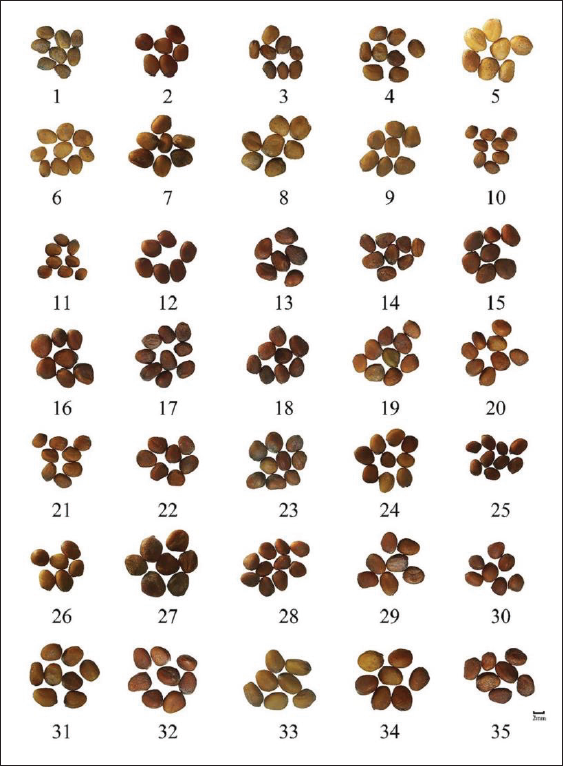
A total of 25 batches of RRS, GRS, and WRS products were collected from China, as shown in Figure 1. A detailed sample list is given in the supplementary material (Table S1). The samples of RS include 9 batches of RRS (S1–S9), 6 batches of WRS (S10–S15), and 10 batches of GRS (S16–S25).
HPLC-grade acetonitrile, LC-MS grade acetonitrile, methanol, and phosphoric acid were purchased from Merck (Merck, Germany). All other chemicals were analytical grade. The standards of sinapine thiocyanate were purchased from the Chinese Medical and Biological Products Institute (Beijing, China). 3,6′-disinapoyl sucrose was isolated and purified in our laboratory, and its chemical structure and purity were confirmed by NMR analysis and HPLC (Table S2 and Figure S1). The purity of this standard was over 98%.
Agilent 1260 HPLC-DAD was purchased from Agilent Technologies, (USA), 6550B iFunnel Q-TOF LC/MS was purchased from Agilent Technologies (USA), one in ten thousandth analytical balance was purchased from Acculab-Sartorius group, one hundred thousandth analytical balance was purchased from CP225D-Sartorius group, CQ-250 Ultrasonic cleaning machine was purchased from Shanghai Ultrasonic Instrument Factory, China, and vernier caliper was purchased from Shanghai Jiuliang Hardware Tools Co. Ltd., China.
Methods
Characteristics Analysis
A total of 25 RS were collected for the characteristics analysis. Seed sizes were determined by measuring the length, width, and thickness diameter using a vernier caliper. Seeds shape index was presented as the ratio of vertical diameter to transverse diameter.
The shape of RS is mainly obovoid or ellipsoid. The width of the ends of the seed was measured to distinguish obovoid and ellipsoid. The width of the obovoid seed is unequal and one side is wider than the other side. The width of the oval seed is equal. Seed shapes were assigned a value. The obovoid seed was recorded 1, and the ellipsoid seed was recorded 2.
Sensory analysis was slightly modified from Guo et al. (2021) and Zhou et al. (2021). Six panelists (three females and three males, aged 19–35 years) participated in this research. The group members were chosen on the basis of the following standards: (1) no habits of smoking or drinking and (2) no olfactory defect. The panelists were requested not to use any strongly scented personal care products on the day of the test and needed to wait for at least 1 hour before the test to ensure smooth progress. In evaluating the intensity of aroma attributes, we use a 1–3 scale for scoring. The design of this scale is to enable us to more accurately describe the intensity of the aroma, where 1 represents no or imperceptible intensity, 2 represents moderate intensity, and 3 represents high intensity. In this study, each sample was evaluated three times by each team member on different dates. The data are represented in the form of an average. The seed coat color was evaluated as a similar method. They were recorded as light brown or dark brown: 1 = light brown and 2= dark brown.
Preparation of Sample and Standard Solution
The reference compounds of individual sinapine thiocyanate were accurately weighed, dissolved in methanol, added into a volumetric flask (50 mL), and stored at 4°C.
Crushed samples of RS were weighed accurately (0.5 g), and this crushed sample was mixed with methanol (50 mL). Then ultrasonic treatments were performed on the mixture two times, each lasting for 30 min, and the resulting extraction solutions were filtrated through a membrane filter (0.22 µm) before HPLC analysis.
Chromatographic Conditions
HPLC of sinapine thiocyanate and 3,6′-disinapoyl sucrose was performed on ZORBAX SB-Aq C18 (250 mm × 4.6 mm, 5 µm), using separate mobile phases of (A) acetonitrile and (B) 0.05% (by volume) phosphoric acid aqueous solution. The gradient programs optimization was as follows: 0–10 min, 5%–8% (A); 10–20 min, 8%–18% (A); 20–38 min, 18%–22.5% (A); 38–50 min, 22.5%–50% (A); and 50–60 min, 50%–80% (A). The flow rate was 1.0 mL/min, the column temperature was 30°C, the UV wavelengths for detection in the DAD detector were set to 225 and 336 nm, and the injection volume was 20 µL.
UPLC- Q-TOF-MS Conditions for Qualitative Analysis
Component analysis was performed on an Agilent ZORBAX NH2 (5 µm, 4.6 mm × 150 mm) analytical column, the column temperature was 30°C, and the mobile phase was composed of (A) acetonitrile and (B) water. The gradient programs were the same as HPLC. Its analysis was carried out on an Agilent 1290 UPLC system combined with an Agilent 6550 Q-TOF MS (Santa Clara, CA, USA). Detailed conditions are given in the supplementary material.
Validation of the HPLC Method
Fingerprint and quantitative analysis method validation was included in the supplementary material.
Data Analysis
A total of 25 batches of samples with their peak areas were generated in Excel. An external standard was utilized for the quantitative determination of sinapine thiocyanate and 3,6′-disinapoyl sucrose. Fingerprint analysis through SA, LDA (SPSS Statistics 20), PCA, and PLS-DA (SIMCA software trial version). METLIN (
Results
Appearance Evaluation
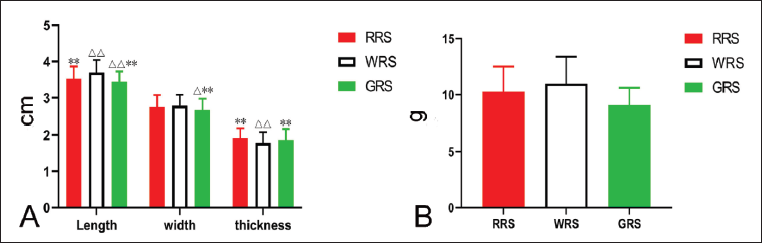
As shown in Figure 2, the length, width, and thickness of RS with different skin colors varied greatly. The length of WRS was significantly longer than RRS (p < 0.01). The length of GRS was significantly shorter than RRS (p < 0.01). The width of GRS was significantly narrower than RRS and WRS (p < 0.05 and p < 0.01). Among the three types of RS, WRS had the greatest TKW (thousand-grain weight), followed by RRS and GRS without significant differences between each of them. The thickness of WRS was significantly thinner than RRS and WRS (p < 0.01). The shape, flavor, and skin color in RS are without significant differences between each of them, and the results are shown in Table S3.
Method Validation of the HPLC Fingerprint Analysis
The RSDs of RRT and relative peak area for precision were <0.57% and 2.56%. Stability was ≤0.55% and 2.63%, and repeatability was <0.73% and 2.89% (Table S4). The results were up to the national standards for TCM fingerprinting (State Food and Drug Administration of China, 2000).
Fingerprint and Similarity Analysis
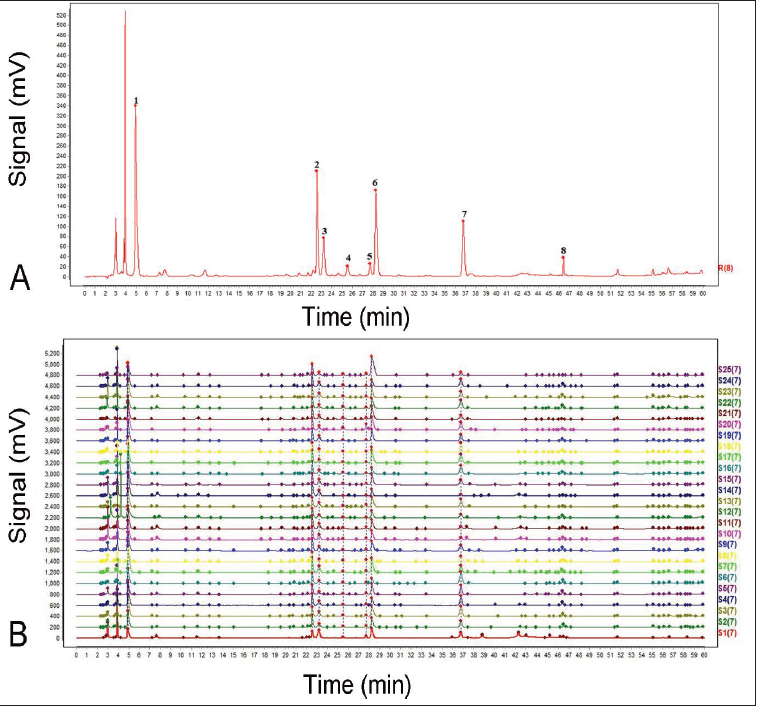
As shown in Figure 3A, after conducting a detailed analysis of all the samples, a total of eight peaks had relatively good resolution and large peak areas and were designated as the common peaks. A representative fingerprint of RS was established (Figure 3B). In the analysis process, we chose the sinapine thiocyanate (peak 2) as the reference peak. The shape of this peak was symmetrical. At the same time, its intensity was moderate, which allowed us to measure and analyze it more accurately. In addition, the retention time of the sinapine thiocyanate (peak 2) was moderate, which allowed the detection accurately. Similarities of the sample chromatograms were in the range of 0.808–0.998; among them, all batches were >0.8 (Table S5). The results showed that there were similarities between the three types of RS.
Identification of the Common Peaks by UPLC–Q-TOF–MS/MS
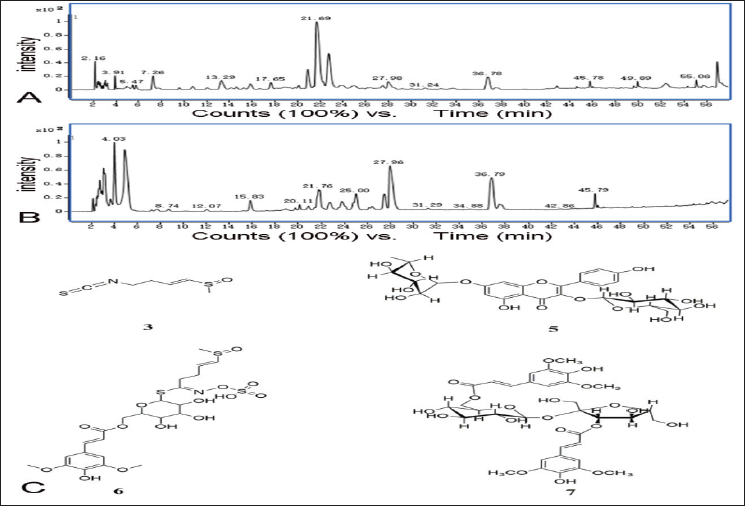
Positive ion and negative ion modes can observe more information and higher fragment recognition. Two modes have different mass spectrometry characteristics, which can provide more comprehensive and detailed molecular structure information. The total ion chromatogram results of the RS sample are shown in Figure 4A and B. Five common peaks in the HPLC fingerprint were identified by HMDB (
Method Validation Results of Quantitative Analysis
According to the presentation in Table S7, the correlation coefficient (R > 0.9996) shows a good linear relationship within the set range. In addition, this method also shows a very high sensitivity. As shown in Table S8, the RSDs of precision, stability, and repeatability were <1.38, 2.39, and 2.83, respectively, and the average recovery was in the range of 97.37%–97.74% with RSD values ranging from 1.13% to 1.73%. The above results fully comply with the detailed requirements for drug quality standards in the “Chinese Pharmacopoeia” (the latest version released by the Chinese Pharmacopoeia Commission, 2020).
Quantitative Application
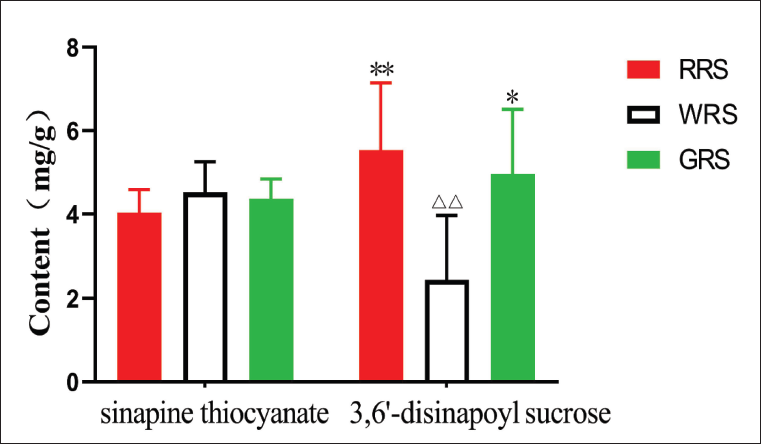
The method of quantitative analysis is based on the external standard method, which fits a calibration curve through the use of linear regression analysis. As shown in Figure 5, the contents of the sinapine thiocyanate and 3,6′-disinapoyl sucrose in the 25 batches of samples collected varied greatly. The content of 3,6′-disinapoyl sucrose in WRS was significantly lower than in comparison with the RRS and GRS (p < 0.01 and p < 0.05).
PCA and PLS-DA Analysis
PCA is a dimensionality reduction technique. It transforms the original multiple correlated variables into a set of new uncorrelated variables through linear transformation, which are called principal components. The purpose of PCA is to extract the main information from the data while reducing its dimensionality. By retaining as much variance as possible, we can reduce the complexity of the data while maintaining its integrity. PCA can be used in areas such as data compression, feature extraction, and data visualization. It is an unsupervised clustering method to monitor the outline of all data (Sun et al., 2017). The resulting PCA score plot for this study is illustrated in Figure 6A.
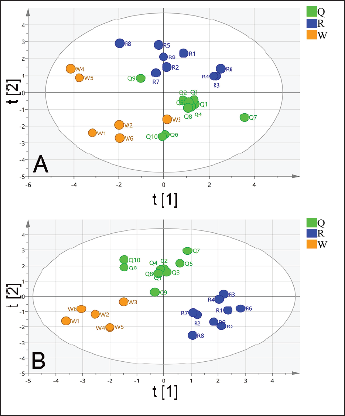
According to the appearance and chemical properties of the samples, after careful analysis and comparison, 25 batches of samples were successfully divided into three separate regions accurately. The results indicated that there are differences in RS with skin color.
The PLS-DA results can observe the outliers and classification trends among the 25 kinds of RS samples (Figure 6B). In the score plot generated by PLS-DA, the results show that there are significant differences between the RS S1–S9 group, S10–S15 group, and S16–S25 group. The existence of this difference indicates that there are great differences in skin color among these different RS samples. In the PLS-DA model, the values of R2Y and Q2 are 0.817 and 0.954, respectively. These two values represent the goodness of fit and predictive ability of the model, respectively. The closer its value is to 1, the stronger the model’s predictive ability. Therefore, when the values of R2Y and Q2 are 0.817 and 0.954, respectively, it indicates that the PLS-DA model has good adaptability and predictability. Variables with a VIP > 1 and p < 0.05 were considered to be different variables. Three indices were significantly different between the RRS and GRS groups, as indicated by a VIP >1 and p < 0.05. They involved 3,6′-disinapoyl sucrose (p < 0.01, VIP = 1.75), compound 8 (p < 0.0001, VIP = 1.74), and skin color (p < 0.01, VIP = 1.46). Two indices were significantly different between the RRS and WRS groups, as indicated by a VIP > 1 and p < 0.05. They involved compound 8 (p < 0.01, VIP = 1.69) and skin color (p < 0.05, VIP = 2.12). Two indexes were significantly different between the WRS and GRS groups, as indicated by a VIP > 1 and p < 0.05. They involved 3,6′-disinapoyl sucrose (p < 0.01, VIP = 1.58) and length (p < 0.05, VIP = 1.72).
Linear Discriminant Analysis
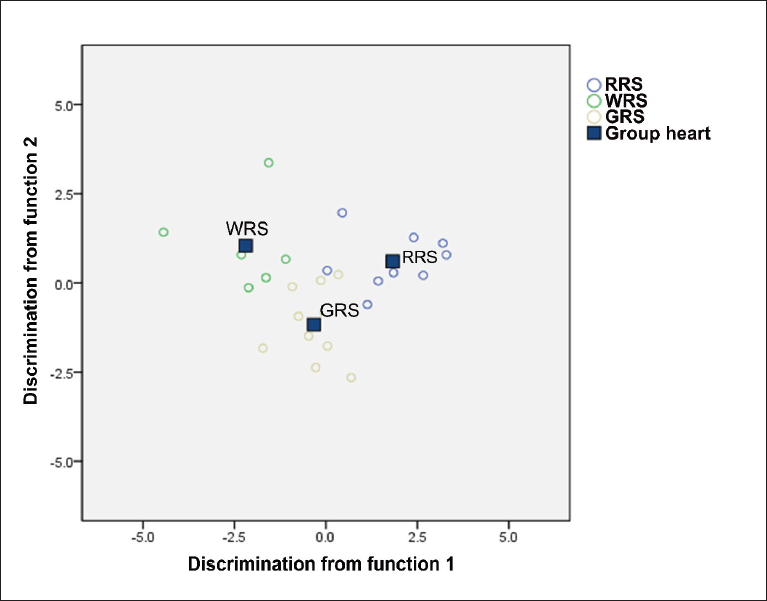
To classify and recognize different RS more accurately, we used the LDA method to analyze 12 elements. Perform stepwise discriminant analysis to extract the optimal discriminant variables for separating RS with different skin colors. As shown in Figure 7, function 1 explained 71.9% of the total variance, and function 2 explained the remaining 21.8%. Different RS were clumped in different regions of the space. The WRS samples were completely separated from RRS and GRS. When comparing RRS samples and GRS samples, they show a certain degree of similarity between them. However, although they may share common features in some aspects, they do not completely overlap. This means that there may be differences between them in some aspects. These research results indicate the applicability and effectiveness of multivariate analysis methods in identifying and distinguishing different types of RS.
Discussion
Radish has a long history of medicinal use and is recorded in the four ancient civilizations of China, Egypt, Rome, and Greece. In China, there are a wide variety of radishes. Radishes vary greatly in color, shape, size, and so on. The dried mature seeds of radish are called Raphani Semen and are included in the Chinese pharmacopoeia, but there is no further distinction made between their sources. As a commonly used traditional Chinese medicine, Raphani Semen has a large clinical usage. Modern research has found that Raphani Semen has rich pharmacological effects. It has a variety of pharmacological activities, including treatment of metabolic diseases, anti-inflammatory, cardiovascular inhibitory effects, anti-tumor, antioxidant, antibacterial, antihypertensive, central nervous system protection, lowering blood lipids and blood sugar, treating fatty liver, anti-osteoporosis, and so on (Ghayur & Gilani, 2006; Li & Huang, 2021). The chemical composition of radish seeds is complex, including various components such as glucosinolates and sulfur-containing derivatives, phenylpropanoid sucrosides, small organic acids and derivatives, flavonoids, alkaloids, terpenoids, steroids, oligosaccharides, and other volatile oils. Among them, sinapic acid is one of the main active ingredients of Raphani Semen, with multiple biological activities such as anti-inflammatory and antioxidant effects (Kook et al., 2014). Sulforaphane is also an important component in radish seeds, exhibiting multiple biological activities such as anti-tumor activity and lowering blood sugar (Biswas et al., 2015; Song et al., 2009). After conducting a detailed analysis of all the samples, the results showed that the sample chromatograms were similar between the three types of RS. However, there are differences in some components of Raphani Semen from different sources. The content of 3,6′-disinapoyl sucrose in WRS was significantly lower than in comparison with the RRS and GRS. 3,6′-disinapoyl sucrose can regulate the expression of genes related to anti-oxidation and autophagy (Tang et al., 2022). Therefore, it is necessary to further analyze the source of radish seeds. In this research, the method of PLS-DA and LDA can differentiate RRS, GRS, and WRS. This will guide further in-depth research on turnip seeds and clinical medication more reasonably. Currently, the chemical compositions of radish seeds from different sources have not been systematically compared and it still needs to be further studied.
Conclusion
In this study, the variability in concentrations of sinapine thiocyanate and 3,6′-disinapoyl sucrose across RS from radish-diversified skin color along with various seed length, width, thickness, TKW, coat colors, shape, flavor, and skin color was investigated. The results showed that 3,6′-disinapoyl sucrose, length, width, and thickness varied in RS from radish-diversified skin color. WRS contained a lower total 3,6′-disinapoyl sucrose, while RRS and GRS produced significantly similar high contents. In terms of length, width, thickness, and TKW, the length and width of WRS were the longest, while the thickness implies that WRS is bigger than RRS and GRS. The features of appearance and chemical characteristics can be used to differentiate RRS, WRS, and GRS which are helpful for further research.
Abbreviations
LC–MS/MS: Liquid chromatography-tandem mass spectrometry; C18: Bonded octadecyl silica; Rt: Retention time; NMR: Nuclear magnetic resonance; ESI: Electrospray ionization; PCA: Principal component analysis; PLS-DA: Partial least squares-discriminant analysis; LDA: Linear discriminant analysis.
Authors’ Contribution
YW: Design, Literature search, Experimental studies, Data analysis, Statistical analysis, Manuscript preparation, and Manuscript editing. CM: Experimental studies. IE: Data acquisition and Manuscript review. DD: Concepts, Data analysis, Manuscript review, and Guarantor.
Footnotes
Declaration of Conflicting Interests
The authors indicated no conflicts of interest with respect to the research, authorship, and/or publication of this article.
Funding
The authors received no financial support for the research, authorship and/or publication of this article.
Statement of Informed Consent and Ethical Approval
This study titled “PHM-2023-0548: Appearance and Chemical Characteristics of Radish Seeds from Radish with Different Skin Colors” did not involve human or animal subjects, and thus, no ethical approval was required. The study protocol adhered to the guidelines established by the journal.
Supplementary Material
References
Supplementary Material
Please find the following supplemental material available below.
For Open Access articles published under a Creative Commons License, all supplemental material carries the same license as the article it is associated with.
For non-Open Access articles published, all supplemental material carries a non-exclusive license, and permission requests for re-use of supplemental material or any part of supplemental material shall be sent directly to the copyright owner as specified in the copyright notice associated with the article.