
Abstract
The quality of polysaccharides from different regions was studied by using multiple fingerprint analysis and chemometric analysis. Polysaccharides from 10 batches of Glehnia littoralis were compared based on Fourier-transform infrared spectroscopy (FT-IR), high-performance liquid chromatography (HPLC), gel permeation chromatography (GPC), and proton nuclear magnetic resonance (1H-NMR). According to the results, the 10 batches of polysaccharides from G littoralis had high similarity by analyzing HPLC, FT-IR, 1H-NMR, and GPC fingerprints. Through cluster analysis, samples and adulterants in different regions could be classified. Three monosaccharides (galactose, glucose, and galacturonic acid), molecular weights (4.33 × 10⁵-4.91 × 10⁵, 4.04 × 10⁴-4.71 × 10⁴, and 5.02 × 10³-5.83 × 10³), and H-1 (4.99, 5.39, and 5.42 ppm) of α-glucose could be used as markers for quality control of medicinal materials of the roots of G littoralis.
Introduction
The roots of Glehnia littoralis is a typical species, which grows widely in the temperate sandy coasts near the North Pacific Ocean of China. 1 As a traditional Chinese medicinal material, it has the functions of nourishing Yin, moistening lung, and reinforcing stomach regenerating fluid. In terms of phytochemistry, the presence of flavonoids, furanocoumarins, lignins, monoterpenoids, and polysaccharides has been found. 2 At present, it has been used as an ingredient in traditional Chinese medicine formulations to treat bronchial asthma, interstitial lung inflammation, allergic rhinitis, enhance immunity after chemotherapy, etc. 3 In addition, G littoralis is also used as a source of edible plant-based anticancer foods such as porridge and soup. 1 More and more studies have shown that G littoralis is rich in polysaccharides, which are one of the main active ingredients. Previous studies have shown that the polysaccharides of G littoralis exhibited the pharmacological potential of antioxidants, 2 improving immunomodulatory, 4 and anticancer. 1 Therefore, polysaccharides may be one of the medicinal material foundations of G littoralis, and the study on the quality control of polysaccharides is very important for the quality and clinical efficacy of G littoralis.
With the continuous progress of current analysis methods and technologies, fingerprint is one of the simple and effective quality control technologies. Chromatographic and spectral fingerprinting have numerous applications in quality control and identification. Based on the structural characteristics of polysaccharides, the combination of stoichiometry and fingerprints is an effective method for quality control of medicinal materials. 5
Polysaccharides’ activities are related to the type of glycosidic bond, monosaccharide composition, molecular weight distribution, 6 and maybe related to the origins of G littoralis. We used a combination of multifingerprinting and stoichiometric methods to estimate G littoralis root polysaccharides from different regions. Structural characterization of polysaccharides were done by using these techniques (Fourier-transform infrared spectroscopy [FT-IR], high-performance liquid chromatography [HPLC], gel permeation chromatography [GPC], and proton nuclear magnetic resonance [1H-NMR]). These high-resolution chromatographic data were then analyzed using multivariate statistical methods to identify herbal markers that can be used for the quality control of the roots of G littoralis, and the reliability of the method was verified by comparing with the adulterants, further meaningful to quality control of G littoralis polysaccharides.
Materials and Methods
Materials and Chemicals
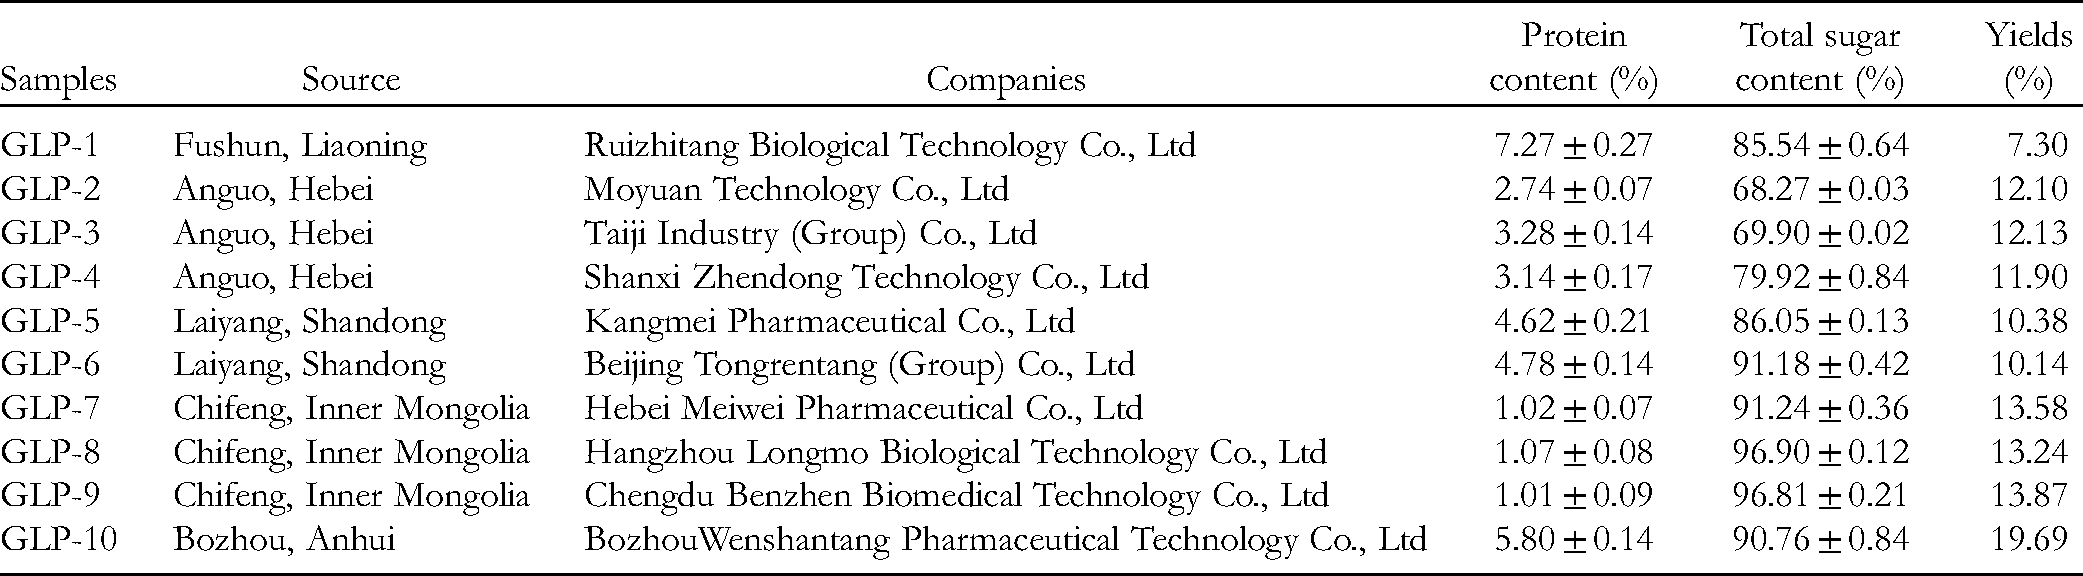
Ten batches of G littoralis were bought from different companies (Table 1). Chuanmingshen (CMS) was produced in Jintang of Sichuan and purchased from Chengdu Benzhen Biomedical Technology Co., Ltd, Changii Radix (MDS) and Adenophorae Radix (NSS) were produced in Wuhu of Anhui, Guangyuan of Sichuan, respectively, and they were purchased from Moyuan Technology Co., Ltd. Glucose (Glc), glucuronic acid (GlcA), mannose (Man), arabinose (Ara), fucose (Fuc), galactose (Gal), galacturonic acid (GalA), rhamnose (Rha), xylose (Xyl), and standard dextrans (Mw: 500, 50 000, 150 000, and 2 700 000 Da) were purchased from Sigma. All others are analytical-grade reagents.
The Total Sugar Content, Protein Content, and Yield of GLPs.
Preparation of Polysaccharide Extracts
Each batch of dried samples (200 g) was refluxed twice in 600 mL ethanol (80%, v/v) at 85 °C (2 h each time) to remove small amounts of organic compounds and pigments. The residues (each, 25 g) in 750 mL distilled water were extracted at 100 °C for 2 times (2 h each time), and the filtrate of the obtained extract was concentrated in vacuum and precipitated with 80% ethanol. The precipitate was collected and dried after being left for 12 h at 4 °C. Finally, crude polysaccharides powder was coded as glehnia littoralis polysaccharides (GLPs), and the yield of GLPs was calculated. 7 The quality of adulterants (CMS, MDS, and NSS) should be determined and the established multiple fingerprints identified and further supported.
Characterization of GLPs and Multiple Fingerprinting Profiles
Chemical Composition Determination
Total sugar content was determined by using the phenol-sulfuric acid method using glucose as the standard. 8 Bovine serum albumin was used as the standard to determine total protein content. 9
FT-IR Fingerprints Determination
GLPs were mixed with KBr powder and pressed into pellets for FT-IR spectral measurement in the range of 4000 to 450 cm−1, respectively. 7
HPLC Fingerprints Determination
The composition of monosaccharides was determined by HPLC and derived by 1-phenyl-3-methyl-5-pyrazolone (PMP). In a sealed vial, hydrolyzed 20 mg samples with 5 mL of 2 mol/L of trifluoroacetic acid (TFA) were kept in an oil bath at 100 °C for 6 h. The hydrolysate could be evaporated with 5 mL of methanol to remove TFA at 45 °C. Then dissolved the dried hydrolysates by adding 2 mL of deionized water. Then 400 μL of hydrolysate was mixed with 400 μL of methanolic solution of 0.5 mol/L PMP, and 400 μL of 0.3 mol/L NaOH. This reaction setting time was 30 min and the temperature was 70 °C. After solution cooling, the reaction solution was neutralized with 0.3 mol/L of hydrochloric acid and finally extracted with chloroform 3 times, collected and filtered in the aqueous phase with a 0.45 μm filter membrane, and finally used for HPLC analysis. The monosaccharide standards were PMP-labelled and analyzed in a similar manner as mentioned above (Man, Rha, GlcA, GalA, Glc, Gal, Fuc, Xyl, and Ara) were transformed into PMP derivatives using the above-mentioned procedure. Then 20 μL of derivatives were injected into an Eclipse XDB-C18 HPLC column (4.6 mm × 250 mm, 5 μm) operated at 30 °C, and eluted with a mixture of 0.1 M phosphate buffer (pH 6.7) and acetonitrile (84:16, v/v) at a flow rate of 0.8 mL/min. The ultraviolet (UV) detection wavelength was set at 245 nm. 6
GPC Fingerprints Determination
The molecular weights of samples were determined using Sephadex G-100 permeation chromatography (100 cm × 12.6 cm). The column was eluted with H2O at a flow rate of 1 mL/min. The linear regression curve was calibrated using the glucose and T-series Dextran standards (500, 50 000, 150 000, and 2 700 000 Da). The molecular weight was derived from the above calibration curve. 10
1H-NMR determination. The samples were dissolved in D2O at a concentration of 10 mg/mL. 1H-NMR spectra were obtained on a Bruker 500 instrument.
Data Processing
A flowchart of extracting, processing spectroscopic/chromatographic fingerprinting, and data handling is presented in Figure 1. All measured data were represented by mean ± standard deviation. The fingerprint data of FT-IR and GPC were processed by Origin 9.0 software. The 1H-NMR fingerprint data were manually corrected and adjusted by Mest ReNova 5.3.1. HPLC fingerprint was performed by TCM (Version 2004A).

Flowchart of extraction, processing, spectroscopic and chromatographic fingerprinting, and data handling.
Results and Discussion
The Components and Yields of GLPs
The yield, the total sugar content, and protein content of the 10 samples are shown in Table 1.
The total sugar content was 68.27% to 96.90% and the protein content was 1.01% to 7.27%. The yield of GLPs was 7.30% to 19.69%. It should be noted that the neutral sugar-containing protein was the main component of GLP specimens. The total sugar content of the polysaccharides from Chifeng was relatively high, that is, 91.24% to 96.90%, protein content was 1.01% to 1.07%, and the yield was 13.24% to 13.87%. The total sugar content, protein content, and the yield of polysaccharides were similar from the same source, for example, the total sugar content, protein content, and the yield of polysaccharides from Anguo were about 70%, 3%, and 12%, respectively. It was worth noting that the total sugar content, protein content, and yield of GLPs were different, the polysaccharides from Chifeng had the highest total sugar content, Fushun had the highest protein content, and the yield of GLPs was Bozhou (19%) > Chifeng (13%) > Anguo (12%) > Laiyang (10%) > Fushun (7%). It was speculated that compared with Fushun, Bozhou has a mild climate, sufficient light, and moist soil, which is more conducive to the growth of Chinese herbal medicine. As a result, the difference in origin was affected by many factors, including geographical location, processing method, and harvest time. Furthermore, the roots of G littoralis should be stored in a ventilated and dry place, it is easy to be eaten by insects, damp, and moldy. Before the high temperature and high humidity season, it can be sealed and stored to prevent moisture and moths.
FT-IR Fingerprints of GLPs and Chemometric Analysis
FI-IR Fingerprints of GLPs
The FT-IR fingerprint results of GLPs from distinct regions are shown in Figure 2A, and the absorption results are shown in Table 2. Standard reference fingerprints could be extracted from 10 sets of FT-IR chromatograms, as shown in Figure 2B. Figure 2A shows that there are 10 common characteristic peaks with similar wavenumbers (3380, 2930, 1750, 1650, 1400, 1160, 1070, 1020, 850, and 760 cm−1) in all the GLPs. According to the common characteristic peaks, due to the stretching vibration of the –OH group, there is a strong absorption band at 3380 cm−1, because of the C–H stretching vibration of –CH2–, there is a weak band near 2930 cm−1. The band at 1750 cm−1 indicated the presence of uronic acid in GLPs. The absorption peaks at approximately 1650 and 1400 cm−1 corresponded to the characteristics of –COOH and C–O, respectively. A group of peaks in the range of 1160 to 1020 cm−1 indicated the existence of a pyranose ring. The characteristic peak at 850 cm−1 indicated the existence of an α glycoside bond. The absorption peak at 760 cm−1 showed that the polysaccharide contained glucose pyranose rings, 11 the result was consistent with previous studies.12,13 Overall, all the 10 samples had the characteristic absorption peaks of polysaccharides, and the distribution of absorption peaks was similar.

Fourier-transform infrared spectroscopy (FT-IR) fingerprints of GLPs: (A) FT-IR fingerprints of 10 batches GLPs; (B) FT-IR standard referential fingerprint; (C) dendrogram of FT-IR fingerprints; (D) score plot of FT-IR fingerprints.
Transmittance of Characteristic Peaks.

Similarity Analysis of the FT-IR Fingerprints
The spectra of10 common characteristics of GLPs were chosen with similarity values obtained by calculating the cosine and correlation coefficient (R), the results were as follows: cosine values ranged from 0.9862 to 1.0000, the mean was 0.9977; correlation coefficients ranged from 0.9872 to 1.0000, the mean was 0.9976. The 2 means showed the similitude of 10 polysaccharides samples from different origins was high to indicate that a standard fingerprint can be used as one of the representatives of GLPs.
Hierarchical Cluster Analysis of the FI-IR Fingerprints
The hierarchical cluster analysis (HCA) data matrix consisted of the transmittance of characteristic peaks common to FT-IR fingerprints. Directly reflected the whole clustering process, as shown in the tree view (Figure 2C). All samples could be divided into 2 categories. The first category was divided into class A and class B, and the second category was divided into class C and class D. Class B included B1 and B2. Subcategory A only included one sample of GLP-6, while GLP-1, GLP-2, GLP-3, and GLP-4 formed subclass B. B1 was composed of GLP-1, while class B2 was composed of GLP-2, GLP-3, and GLP-4. Samples from GLP-5, GLP-9, and GLP-10 formed subclass C, and samples of GLP-7 and GLP-8 were clustered into subclass D. Aggregates were similar in protein content in the samples, in terms of the material composition of samples. The proteide content of GLP-2, GLP-3, and GLP-4 samples was almost the same, which was around 3%.
Principal Component Analysis
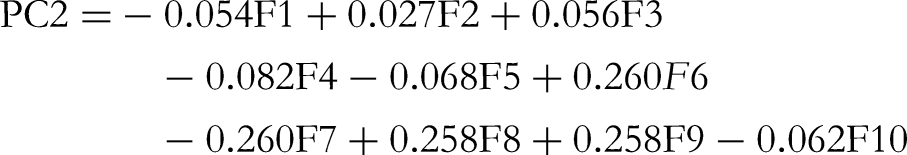
Through the principal component analysis (PCA) of the samples, 10 characteristic FT-IR peaks were analyzed to further understand the similarities of these various samples. The loading plot is shown in Figure 2D, the 2 PCs indicate 72.161% and 25.962% of the whole variance representing 98.123% of the cumulative variance. The farther the origin point was away, the greater the contribution of the component to distinguish. The following formula could illustrate the main ingredients:
HPLC Fingerprints of GLPs, Chemometric Analysis
HPLC Fingerprints
Figure 3A shows the HPLC fingerprints of the 10 distinct polysaccharides specimens. The monosaccharide composition and ratio are shown in Table 3. The HPLC fingerprints of 10 samples showed the similar retention times for peaks, but the peak area ratios were different. These peak area ratios of distinct samples were not consistent. Dates have shown GLPs from distinct regions had the coincident monosaccharide composition and dissimilarity molar ratios. There were 6 identical characteristic peaks in the standard reference HPLC fingerprint, as shown in Figure 3B. These included Man, GalA, Ara, Gal, Glc, and GlcA. Among them, Glc is the main monosaccharide, and this result is similar to the previous conclusion. 1

High-performance liquid chromatography (HPLC) fingerprints of GLPs: (A) HPLC fingerprints of 10 batches GLPs; (B) HPLC standard referential fingerprint; (C) dendrogram of HPLC fingerprints; (D) score plot of HPLC fingerprints.
Monosaccharide Composition and Ratio of 10 Groups Polysaccharides.

Abbreviations: Man, mannose; GalA, galacturonic acid; GlcA, glucuronic acid; Glc, glucose; Gal, galactose; Ara, arabinose.
Similarity Analysis of the HPLC Fingerprints
The cosine (cos θ) values and correlation coefficients (R) were calculated to obtain the similarity of 10 results from HPLC. The cosine (cos θ) values and correlation coefficients (R) were calculated to obtain the similarity of 10 results from HPLC.The results are as follows: cosine values ranged from 0.9858 to 1.0000 (mean: 0.9978) and correlation coefficients ranged from 0.9889 to 1.0000 (mean: 0.9997). Two mean the degree of similarity was >0.9000, indicating that 10 batches of GLPs from distinct regions have very high proximity, which indicates that the generated standard reference fingerprint is the typical fingerprint of the GLPs.
HCA of the HPLC Fingerprints
The data matrix of HCA consisted of the relative area of the same monosaccharide peaks. The dendrogram was shown in Figure 3C and reflected the whole process of clustering intuitively. Samples could be divided into class I (GLP-1) and class II. The class II could be further divided into 3 subgroups A (GLP-7), B (GLP-9), and C. Subgroup C also included subclasses C1, C2, and C3. Subclass C1 only included 1 sample of GLP-10, samples from GLP-2, GLP-4, and GLP-6 were included in subclass C2, while subclass C3 was composed of GLP-3, GLP-5, and GLP-8. Subgroup A only included 1 specimen of GLP-7, which shows that the monosaccharide composition of GLP-7 is distinct from other specimens. Class I only included 1 sample of GLP-1, the protein content of GLP-1 was 7.470 ± 0.070%, far higher than that of the samples from other regions. In addition, the clustered specimens had similar climatic characteristics, for example, the specimens from GLP-10 (Anhui) were divided into category C1, which might be because Anhui has a temperate semi-humid continental monsoon climate.
PCA of the HPLC Fingerprints
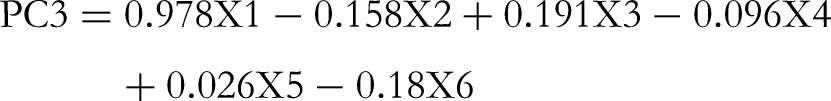
PCA was performed on the samples by HPLC fingerprint influencing factors that made the distinction of GLPs from distinct districts. The data matrix as mentioned before was submitted to the software for PCA and the loading plot is shown in Figure 3D, and the equations are as follows: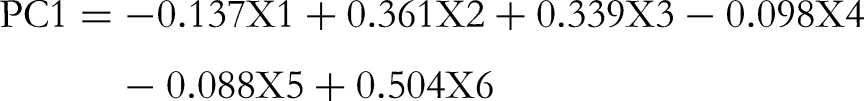

GPC Fingerprints of GLPs and Chemometric Analysis
GPC Fingerprints of GLPs
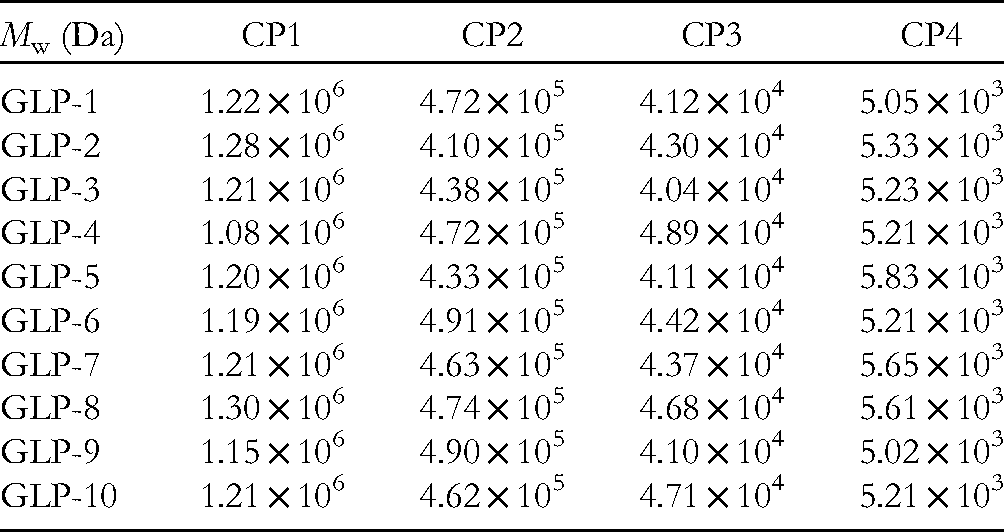
Figure 4A shows the GPC fingerprints of the 10 batches of GLPs from dissimilar areas. Table 4 shows the molecular weight of 10 groups of polysaccharides. For these specimens with a similar retention time, it could be explained that they have a similar relative molecular weight range. There were 4 molecular weight distributions of 10 batches of samples. Figure 4B shows a standard reference GPC fingerprint containing 4 molecular weight distributions, with molecular weights ranging from 1.15 × 10⁶ to 1.30 × 10⁶ (CP1), 4.33 × 10⁵ to 4.91 × 10⁵ (CP2), 4.04 × 10⁴ to 4.71 × 10⁴ (CP3), and 5.02 × 10³ to 5.83 × 10³(CP4), respectively, the conclusion was consistent with previous research. 14

Gel permeation chromatography (GPC) fingerprints of GLPs: (A) GPC fingerprints of 10 batches GLPs; (B) GPC standard referential fingerprint; (C) dendrogram of GPC fingerprints; (D) score plot of GPC fingerprints.
Molecular Weight and Distribution of 10 Groups of Polysaccharides.
Similarity analysis (SA) of the GPC fingerprints. To evaluate the similarity of GLPs, cosine and correlation coefficient values were calculated, and the results were as follows: cosine values ranged from 0.9994 to 1.0000 (mean: 0.9999) and correlation coefficients ranged from 0.9959 to 1.0000 (mean: 0.9993). The 2 means indicated that the homologous of 10 polysaccharide specimens from different areas were high to illustrate that the criterion fingerprint was indicated of GLPs. Moreover, it could be used to master and assess the quality of G littoralis.
HCA of the GPC Fingerprints
The results are shown in Figure 4C. The HCA tree view explains the trait. In addition, 10 batches of polysaccharide specimens could be divided into 2 groups: I (GLP-4) and II. Then, divide class II into two categories, A and B. Category A was composed of GLP-2 and GLP-8. Category B was composed of groups B1 and B2. The samples of GLP-6 and GLP-9 were clustered into B1, while the samples of GLP-1, GLP-3, GLP-5, GLP-7, and GLP-10 were clustered into group B2. The samples with similar molecular weights tended to be clustered together. GLP-4 was divided into a group because of the smallest CP1. The molecular weight of samples from GLP-1, GLP-3, GLP-5, GLP-7, and GLP-10 were similar.
PCA of the GPC Fingerprints
According to the GPC fingerprint, PCA was used to identify the source of GLPs. The result is shown in Figure 4D and the equations are as follows:


1H-NMR Fingerprints of GLPs and Chemometric Analysis
1H-NMR Fingerprints of GLPs
The 1H-NMR fingerprints of GLPs are displayed in Figure 5A. Figure 5B shows that there are 5 common characteristic peaks in the 1H-NMR fingerprint (Table 5). The 1H-NMR method was mainly used to determine the forms of hydrogen atoms in the sugar analysis region. There were 5 anomeric proton signals in the anomeric proton region of samples, indicating that it contained 5 different glycosidic bonds.

Proton nuclear magnetic resonance (1H-NMR) fingerprints of GLPs: (A) 1H-NMR fingerprints of ten batches GLPs; (B) 1H-NMR standard referential fingerprint; (C) dendrogram of 1H-NMR fingerprints; (D) score plot of 1H-NMR fingerprints.
Anomeric Proton Signals of 10 Groups of Polysaccharides.

SA of the GPC Fingerprints
The correlation coefficients (R) and cosine values of the 1H-NMR spectra of 10 batches of samples in the range of 5.5 to 4.5 ppm were calculated, and the results were as follows: cosine values ranged from 0.9972 to 1.0000 (mean: 0.9978) and correlation coefficients ranged from 0.9993 to 1.0000 (mean: 0.9998). So we found that the characteristic peaks of GLPs in this paper were highly similar.
HCA of the 1H-NMR Fingerprints
As shown in Figure 5C. From the figure, 10 batches of polysaccharide specimens could be divided into two categories I and II. Then, classified the second type into groups A and B. Group A was subdivided into A1 and A2 and Group B was subdivided into B1 and B2. Category I only included GLP-10. Subgroup A1 included samples of GLP-1, and samples from GLP-1, GLP-5, and GLP-7 were clustered into subgroup A2. Subgroup B1 only included GLP-4, and samples from GLP-3, GLP-6, GP-8, and GLP-9 were clustered into subgroup B2. The Glc content of GLP-10 was 92.69%, higher than that of the samples from other regions, and the GLP-10 anomeric proton signal was different from others. The protein content of GLP-4 was different from other groups.
PCA of the 1H-NMR Fingerprints
According to the 1H-NMR fingerprint, the source of GLPs was analyzed and identified by PCA. The PCA result is exhibited in Figure 5D. The formulae are as follows:


Identification of Confusion
Three similar species of G littoralis were bought to verify whether the combination of multiple fingerprints and stoichiometry could have an effect on quality control (Figure 6). In addition, the FT-IR spectra of MDS were similar to the standard fingerprint, though more data was needed for appraisal. Contrarily, the FT-IR spectra of CMS and MDS showed stronger bands in the range of 3390 to 1650 cm−1. Therefore, FT-IR analysis could be used for preliminary screening, but it was not enough as a quality control method, so other methods needed to be comprehensively applied to control its quality. Additionally, the HPLC chromatograms of NSS have some similarities with HPLC fingerprints, which had the same specific peak, but the mole ratios of the peaks are very different, the monosaccharide composition had a great discrepancy in CMS and MDS. The GPC chromatograms of CMS, MDS, and NSS were different from the GLPs, CMS, MDS, and NSS had 3 kinds of molecular weight distributions, and GLPs had 4 kinds of molecular weight distributions. In the 1H-NMR spectrum, NSS had 2 anomeric proton signals (5.11 and 5.45 ppm), MDS had 1 anomeric proton signal (5.32 ppm), and CMS had 2 anomeric proton signals (4.99 and 5.42 ppm). It can be seen from the above results that the combination of multifingerprint and stoichiometry can be applied to the classification of adulterants.

Identification of confusion (A, FT-IR; B, HPLC; C, GPC; D, 1H-NMR).
In summary, the quality control of GLPs and related products can be achieved by establishing multiple fingerprints. Nowadays, multifingerprints combined with stoichiometric methods can be used to grasp the quality of polysaccharides, the details are shown in Table 6.
Application of Multidimensional Fingerprints of Polysaccharides.

Abbreviations: UV, ultraviolet-visible spectra; IR, infrared absorption spectra; HPGPC, high performance gel permeation chromatography; IC, ion chromatography; NMR, nuclear magnetic resonance; GC, gas Chromatography; MS, mass spectrometry; HPAEC, high performance anion exchange chromatography; PAD, pulsed amperometric detector; HPLC, high performance liquid chromatography; HPSEC, high performance size exclusion chromatography; MALLS, multiangle laser light scattering; RID, refractive index detector; SEC, size exclusion chromatography; LC, liquid chromatography; MS2, tandem mass spectrometry
Conclusions
Fingerprint analysis is one of the comprehensive and effective evaluation methods for natural Chinese medicine products. In this article, the total sugar and protein contents of GLPs ranged from 68.27% to 96.90% and from 1.01% to 7.27%, respectively. The sugar content and protein content of polysaccharide samples varied according to different regions, and had no significant differences. Fingerprint similarity evaluation and sample classification wereaffected by the total sugar content, which could diametrically affect the molecular weight, monosaccharide composition, and molar ratio of polysaccharides. Therefore, the fingerprints of 10 GLPs were used to establish HPLC, GPC, and 1H-NMR standard fingerprints, and similar species could be identified successfully. FT-IR analysis can preliminarily screen GLPs, but was insufficient as a quality control method. The results of SA, HCA, and PCA of the fingerprints showed that GLPs from different origins had their own chromatographic fingerprint characteristics. Therefore, 3 monosaccharides (Gal, Glc, and GalA), 3 molecular weight distributions (4.33 × 10⁵-4.91 × 10⁵, 4.04 × 10⁴-4.71 × 10⁴, and 5.02 × 10³-5.83 × 10³), and H-1 (4.99, 5.39, and 5.42 ppm) of α-glucose could be selected as the herbal markers to distinguish distinct G littoralis, and adulterants. Furthermore, lots of information could be obtained from a lot of data according to stoichiometry. The combination of multifingerprint and stoichiometric analysis can be used for quality control of other active polysaccharides, thus being applied to the quality control of medicinal materials.
Footnotes
Acknowledgments
We are grateful to Yuguang Zheng, Hebei University of Chinese Medicine, for plant identification.
Declaration of Conflicting Interests
The authors declared no potential conflicts of interest with respect to the research, authorship, and/or publication of this article.
Funding
The authors disclosed receipt of the following financial support for the research, authorship, and/or publication of this article: This work was supported by the Science and Technology Project of Hebei Education Department, the S & T Program of Hebei (grant numbers ZD2022021 and H2021423057).
Ethical Approval
Ethical Approval is not applicable for this article.
Statement of Human and Animal Rights
This article does not contain any studies with human or animal subjects.
Statement of Informed Consent
There are no human subjects in this article and informed consent is not applicable.