
Abstract
Background
The increasing prevalence of type 2 diabetes mellitus (T2DM) on a global scale has created a pressing demand for novel treatments. Gentianella turkestanorum (Gand.) Holub, a traditional Chinese herbal medicine, has been found to possess hypoglycemic effects. However, the mechanism of its action remains unclear.
Objectives
This study was to investigate the impact and mechanism of G. turkestanorum’s water extract (WEG) in reducing insulin resistance (IR) in T2DM.
Materials and Methods
Db/db mice were administered WEG for 8 weeks, during which their body weight, blood glucose (BG), oral glucose tolerance test, islet tolerance test, fasting insulin, total cholesterol, triglyceride, high-density lipoprotein, and low-density lipoprotein were monitored. Additionally, tumor necrosis factor-α (TNF-α) and interleukin-6 (IL-6) levels in db/db mice were measured using enzyme-linked immunosorbent assay (ELISA). The study also evaluated the impact of WEG on liver injury through hematoxylin-eosin staining. The expression levels of key proteins and genes in both insulin signaling and inflammation-related pathways were detected using western blotting and real-time quantitative polymerase chain reaction.
Results
WEG has the potential to regulate glycolipid metabolism, reduce inflammation, and alleviate IR. The mechanism of action may involve promoting the insulin signaling pathway and inhibiting inflammation.
Conclusion
Gentianella turkestanorum could be a viable treatment option for T2DM and IR.
Introduction
Type 2 diabetes mellitus (T2DM) is a metabolic disease that causes persistent hyperglycemia due to low insulin bioavailability. Prolonged high blood sugar levels can lead to organ and tissue damage. According to the report of the International Diabetes Federation, it is expected to reach 643 million by 2030 and 783 million by 2045 (Magliano & Boyko, 2021). T2DM patients experience varying degrees of insulin resistance (IR), which leads to abnormal increases in blood glucose (BG) levels (Tanase et al., 2020).
Traditional Chinese Medicine (TCM) has been found to have a positive effect on alleviating IR, with multiple targets, minimal side effects, and little drug resistance (Zhang et al., 2022). Therefore, TCM is a promising candidate for the treatment of T2DM. Gentianella turkestanorum (Gand.) Holub, a Traditional Chinese Herbal Medicine, is known for its ability to promote dampness, reduce swelling, clear heat, and detoxify. Uyghur people utilize the entirety of the grass to brew tea for the purpose of treating colds, fever, and various other symptoms. It contains various chemicals with hypoglycemic activity, such as xanthone and iridoid compounds (Guo et al., 2021; Li et al., 2022; Ruoyu et al., 2022). Our preliminary research findings suggest that the water extract of Gentianella turkestanorum (WEG) has a significant hypoglycemic effect. To provide a more thorough explanation of WEG treatment for T2DM, we conducted tests on the activity of WEG in treating diabetes using db/db mice.
IR is a defining characteristic of T2DM. It is characterized by a reduction in insulin sensitivity in tissues such as the liver, skeletal muscle, and adipose tissue that are targeted by insulin. This can result in dysregulated glucolipid metabolism, which can lead to increased BG levels (Freeman et al., 2023; Lee et al., 2022). Insulin activity is regulated through a series of signals initiated by phosphoinositide 3-kinase (PI3K) and protein kinase B (AKT). These signals play a significant role in various metabolic regulatory functions (Saltiel, 2021). The insulin receptor (InsR)/insulin receptor substrate 1 (IRS-1)/PI3K/AKT signal transduction pathway is essential to cell physiology and is also recognized to have a role in diabetes and obesity (Kang et al., 2022; Savova et al., 2023). Numerous studies have demonstrated that chronic low-grade inflammation can result in IR and contribute to the onset and progression of diabetes (Gasmi et al., 2021). As a result, WEG with anti-inflammatory properties can partially impede the development of T2DM by inhibiting inflammation. Proinflammatory cytokines exert their effect by stimulating major inflammatory inhibitors of nuclear factor kappa-B kinase α/β (IKKα/β)/nuclear factor kappa-B (NF-κB) and c-Jun N-terminal kinase (JNK) pathways within the cells (Barnabei et al., 2021; Lee et al., 2021).
For our study, we chose to use the water extract (WEG) to explore the mechanism of its treatment for T2DM by examining three key aspects: the insulin signaling pathway, inflammation-related pathways, and metabolites. Through this comprehensive analysis, we hope to gain a deeper understanding of how WEG can effectively treat T2DM.
Materials and Methods
Subjects Drugs
WEG
The whole dry plant was provided by Xinjiang Medical University and was identified as G. turkestanorum (Gand.) Holub by Professor Liu Chunsheng, Department of Chinese Materia Medica, Beijing University of Chinese Medicine. WEG was prepared by Beijing University of Chinese Medicine. The dried G. turkestanorum whole herb was weighed and ultrapure water was added at 10:1 ratio. Ultrasonic extraction (Power 400 W, frequency 40K Hz, KQ-500DE ultrasonic cleaner, Kunshan Ultrasonic Instrument Co., Ltd.) was then performed twice, 45 min each time. The combined extracts were concentrated and freeze-dried (Alpha 1-2 LD plus, CHRIST, Germany) into a dry paste. The extraction rate was calculated to be 24% (the ratio of the weight of dry paste after extraction to the weight of herbs before extraction). For the research, 3 mg of the water extract dry paste was accurately weighed, heated to 50°C, and ultrasonically dissolved in 1 mL of ultrapure water to make a 3 mg/mL solution. The solution was filtered through a 0.45-µm filter. Then, the preliminary identification of chemical composition based on the accurate mass database was carried out on WEG to clarify the chemical composition of the subject.
Liquif Chromatography–Mass Spectrometry (LC–MS)/MS Assay
Q Exactive™ Orbitrap™ Mass Spectrometer (Thermo Fisher, USA) with chromatographic conditions: ACQUITY UPLC BEH C18 column (100 mm × 2.1 nm, 1.7 µm, Waters, USA), acetonitrile (Fisher Scientific, USA) containing 0.1% formic acid (Fisher Scientific, USA) as mobile phase A, ultrapure water containing 0.1% formic acid as mobile phase B, flow rate: 0.3 mL/min, column temperature: 35, injection volume: 5 µL, and analysis time: 50 min. The gradient elution program is shown in Table S1. Ultraviolet absorption at 200–400 nm for a full scan. Mass spectrometry conditions: heated electrospray ion source (H-ESI); ESI scanning mode: both positive and negative ion mode; full MS-dd MS; scanning range (100–1500) m/z; full-scan resolution of primary mass spectrometer: R = 70,000; spray voltage: negative ion 2.8 kV, positive ion 3.5 kV; sheath gas (N2) flow rate: 35 arb; auxiliary gas (N2) flow rate: 10 arb; and ion transfer tube temperature: 350. The data acquisition system was Xcalibur V4.0. Sample preparation method: WEG dry paste was weighed (3 mg), transferred into a 1.5 mL EP tube, 1 mL ultrapure aqueous solution was added, and then vortexed to mix. Ultrasonic extraction was performed for 10 min, centrifuged at 4000 rpm for 5 min (Sigma company, USA, model number: 3K15), and then a 0.22-µm organic filter was used to filter the sample into the injection vial.
Animals
The male mice used in this study were BKs.CG-DOCK7m+/+Leprdb/JNju (db/db) and C57BL/KsJ strains, both of which were 8-week-old and obtained from the Nanjing Institute of Biomedical Sciences. Animal Production License: SCXK (Su) 2015-0001. The mice used in this study were bred in a controlled environment at the SPF Barrier Animal Center, Beijing University of Chinese Medicine. All animal experiments were conducted in accordance with the guidelines set forth by the Animal Care and Ethics Committee of Inner Mongolia Medical University (approval No.YKD202101061). Mice were kept in individually ventilated cages with free access to food (the normal chow diet) and water. The cages were placed in a specific, pathogen-free environment with a standard 12/12 h artificial light/dark cycle. The mice were provided with standard feed and water ad libitum throughout the study.
After 7 days of adaptive feeding, 50 db/db mice were randomly divided into five groups: the WEG high-dose group (High): gavage 0.6 g/(kg·d) WEG; the WEG medium-dose group (Middle): gavage 0.3 g/(kg·d) WEG; and the WEG low-dose group (Low): gavage 0.15 g/(kg·d) WEG, the positive group (Pio): gavage 0.02 g/(kg·d) pioglitazone, the model control group (Con), and 10 mice in each group. Ten C57BL/KsJ mice were selected for the normal group (Nor). Nor and Con were given the same volume of sterile water. The duration of the drug intervention was 8 weeks. The mice were monitored on a daily basis to assess their mental state, behavior, coat color, and texture. In addition, the weight of each mouse was recorded every Friday to track any changes. This experiment strictly adheres to the animal experiment standard of the “Principles of Laboratory Animal Care” (NIH publication No. 85-23, revised 1985), the People’s Republic of China (GB14925-2001), and the animal humanitarianism standard (MOST+2006A) to reduce animal suffering to the greatest extent.
Fasting BG and Random BG Measurement
Fasting BG levels were measured in mice every Friday at 10 a.m. after an 8-h fast, during which the animals had access to water. Additionally, random BG measurements were taken every Thursday at 10 a.m. One hour after administration, 10 µL of blood was collected from the tail vein of each group of mice to determine their BG levels. The BG levels were measured using a meter from Bayer, Germany.
Oral Glucose Tolerance Test
Oral glucose tolerance test (OGTT) was measured on the Monday of the eighth week after continuous gavage until that time. The mice were fasted for 6 h before being given a glucose solution (Sigma Company, USA, lot Number: SLBL3745V) at a dose of 2 g/kg, with each test group receiving the same treatment. BG levels were measured at 0, 15, 30, 60, and 120 min after the sugar infusion. An OGTT curve was drawn based on the measured BG value, and the area under the curve (AUC) was calculated. The calculation formula used is AUC ((mmol/L)/h) = (BG0 + BG15) × 15/120 + (BG15 + BG30) × 15/120 + (BG30 + BG60) × 30/120 + (BG60 + BG120) × 60/120. Among them, BG0, BG15, BG30, BG60, and BG120 represent BG at 0, 15, 30, 60, and 120 min after oral glucose administration, respectively.
Insulin Tolerance Test
Insulin tolerance test (ITT) was measured on the Monday of the ninth week after continuous gavage up to the eighth week. The mice were fasted for 6 h and then injected intraperitoneally with Novoline R (Novo Nordisk Company, Norwegian, batch number: DVG1751, production date: 201409, specification: 300 IU: 3 mL) at a dosage of 2 U/kg. BG levels at 15, 30, 60, and 120 min after insulin injection were measured. An ITT curve was constructed according to the measured BG values, and the AUC of each group was calculated as follows: AUC ((mmol/L)/h) = (BG0 + BG15) × 15/120 + (BG15 + BG30) × 15/120 + (BG30 + BG60) × 30/120 + (BG60 + BG120) × 60/120. Among them, BG0, BG15, BG30, BG60, and BG120 represent BG at 0, 15, 30, 60, and 120 min after insulin injection.
Serum Biochemical Assay
After an 8-week drug intervention, blood samples were collected after a 12-h fast. The mice of each group were anesthetized by an intraperitoneal injection of 50 mg/g body weight of thiopentone sodium, followed by the collection of blood samples from the abdominal aortic. The samples were placed in centrifuge tubes coated with sodium heparin and after 2–3 h of incubation at low temperature, they were centrifuged at 3500 rpm for 10 min (Sigma Company, USA, model number: 3K15), and the supernatant was extracted for use. The automatic biochemical analyzer (Hitachi, Japan, model number: 7020) measures total blood total cholesterol (TC) (Wako, Japan, batch number: EP335), triglycerides (TG) (Wako, Japan, batch number: DR081), high-density lipoprotein (HDL-C) (Wako, Japan, batch number: EF526), and low-density lipoprotein (LDL-C) (Wako, Japan, batch number: DP609).
Serum Insulin and Insulin Sensitivity Index (QUCKI) Test
Perform fasting insulin testing on the above blood samples. The automatic biochemical analyzer detects fasting insulin (Fins) (Wako, Japan, batch number: EP335) and calculates the insulin sensitivity index (QUCKI) based on fasting BG. Insulin sensitivity index (QUCKI) = 1/(lg FBG + lg Fins), where Fins is fasting serum insulin and FBG is fasting BG.
Histopathological Assay
The liver samples were dehydrated with increasing concentrations of ethanol, rinsed with histoclear, embedded in paraffin, and then cut into 5 µm thick slices using a Lycra paraffin slicer (OLYMPUS Corporation, Japan, Model BX51). After dewaxing, slices were baked for 48 h at 45°C, and then for 1 h at 60°C. Sections were then stained with hematoxylin and eosin and examined under a light microscope (OLYMPUS Corporation, Japan, Model BX53).
Enzyme-Linked Immunosorbent Assay
Enzyme-linked immunosorbent assay (ELISA) kits (USCN Life Science, Co., Ltd., China) for tumor necrosis factor-α (TNF-α) and interleukin-6 (IL-6) were used to measure cytokine levels in serum following the manufacturer’s instructions. The plates were scanned at 450 nm with a microplate reader (Promega Company, USA, model number: E9032).
Real-Time Quantitative Assay
Total RNA was extracted from the livers of the mice using the mirVanaTM RNA Isolation Kit (Thermo Scientific, USA) according to the manufacturer’s specifications. The primer sequences were designed in the laboratory and synthesized by Generay Biotech (China) based on the mRNA sequences obtained from the NCBI. Sequences are available in Table S2. The expression levels of mRNAs were normalized to glyceraldehyde 3-phosphate dehydrogenase and calculated using the 2−∇∇Ct method.
Western Blot Assay
Due to the limited number of mouse samples, we used fully automated western blots to analyze mouse liver proteins. Liver tissue (100 mg) stored in liquid nitrogen was cut into small pieces, washed with precooled phosphate-buffered saline buffer for 2–3 times, and then added to radioimmunoprecipitation assay lysis buffer (Thermo, USA). The tissue was ground down until it was fully dissolved and vortexed for 30 s. After centrifugation at 12,000 rpm, 4°C, for 15 min, the protein concentration was determined by the bicinchoninic acid kit (Beijing Applygen Technology Co., China). A WES protein quantifier (ProteinSimple, Inc., Model USAWS-2413) was used for detection. The antibodies used in this study were InsR, PI3K (p85), p-AKT(Th308), p-Adenosine 5′-monophosphate (AMP)-activated protein kinase (Thr172) (p-AMPK(Thr172)), NF-κB, IKKα, IKKβ, SAPK/JNK, β-actin mouse polyclonal primary antibody and rabbit monoclonal primary antibody (all antibodies were purchased from CST, USA, 1:1000).
Statistical Analysis
Data were expressed as mean±standard deviation. Statistical analysis was performed by one-way analysis of variance, and statistical differences were evaluated using the software SPSS 19.0. p values of < 0.05 were considered statistically significant.
Results
Chemical Composition Identification of WEG
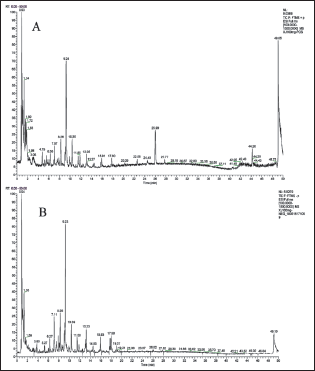
In this study, WEG utilized Compound Discover 2.0 to match the identification of the database by comparing accurate mass, secondary fragments, and other data. Compounds with a score greater than 85 in the mzCloud and mzValt databases were considered matches, resulting in a total of 62 compounds being identified. Please refer to Table S3 for the complete list. The total ion flow diagram is shown in Figure 1.
Effects of WEG on Growth
The mice in the Nor group displayed good mental health, quick response time, flexible movements, smooth and shiny fur, and a steady increase in body weight. Conversely, the mice in the Con group exhibited polydipsia, polyphagia, polyuria, lack of energy, sluggish movements, dull fur, difficulty healing wounds from blood collection, and rapid weight gain in the early stages. Following an 8-week drug intervention, the animals in the High, Middle, Low, and Pio groups all experienced varying degrees of alleviation when compared to the Con group.
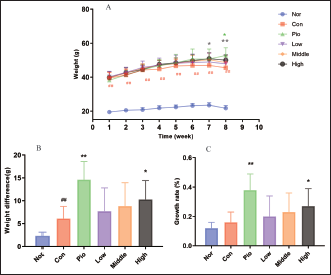
Effects of WEG on Body Weight
During the experiment, the body weight of mice in each group gradually increased, as demonstrated in Figure 2. The Nor values were significantly lower than the other groups (p < 0.01). Compared with Con, Low, Medium, and High, Pio had no significant effect on the body weight in the first 6 weeks (p > 0.05). However, starting from week 7, the body weight of High was significantly higher than that of Con (p < 0.05). In the eighth week, there was a significant increase in body weight for both the High and Pio groups (p < 0.05).
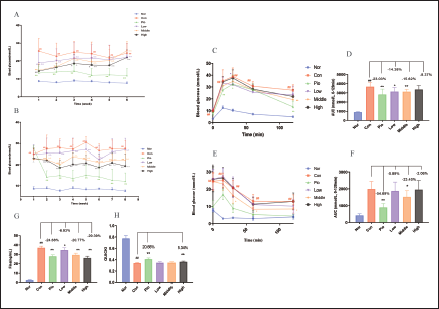
WEG Improves Glucose Metabolism in db/db Mice
As shown in Figure 3A, all dose-dependent WEG groups were all effective in reducing fasting BG levels, with a noticeable trend of dose dependency. The strongest effect was observed at week 1, followed by a gradual decrease in subsequent weeks. The random BG assay showed that Low did not have any effect on reducing random BG throughout the experiment. Medium and High groups demonstrated a strong effect in reducing random BG levels starting from week 2, which continued until the end of the experiment, as shown in Figure 3B. In addition, WEG significantly decreased the AUC of OGTT (Figure 3C and D) and ITT (Figure 3E and F), decreased Fins, and increased QUICKI in db/db mice (Figure 3G and H). These results suggested that WEG could alleviate IR and improve insulin sensitivity in db/db mice.
WEG Improves Lipid Metabolism in db/db Mice
The study found that the TC, TG, and LDL-C levels in Con were significantly higher than those in Nor (p < 0.01), indicating severe dyslipidemia in db/db mice (Figure 4A). The TC levels in Medium were significantly lower than Con (p < 0.01). All WEG groups were able to significantly reduce TG in db/db mice (p < 0.01). The ratio of TG to high-density lipoprotein cholesterol (HDL-C) is a crucial factor in studying dyslipidemia, as per research conducted by Sultani et al. (2020). A higher TG/HDL-C ratio indicates poorer blood lipid metabolism. The TG/HDL-C ratio of the control group (Con) is significantly higher than that of the normal group (Nor) with a p-value of <0.01. Treatment with Pio, Middle, and High can significantly reduce the TG/HDL-C ratio, thus improving the abnormal blood lipid metabolism observed in db/db mice.
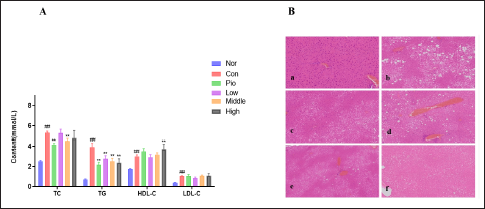
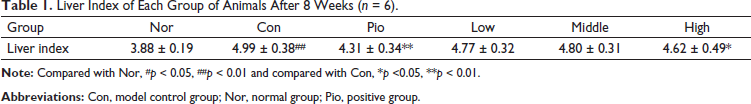
WEG can not only regulate blood lipid content but also directly alleviate fatty liver disease in db/db mice. After an 8-week drug intervention, the liver mass to body mass ratio was calculated and compared between different groups. Table 1 shows the liver index of Con was significantly higher than Normal (p < 0.01), Pio and High were able to significantly lower the liver index of db/db mice compared to Con (p < 0.05). As shown in Figure 4B, the hepatocytes of Nor were arranged radially along the central vein. The cells had normal morphology; the nucleus was large, round, centered, and homogeneous. The tissue had no fatty degeneration and no inflammatory infiltration. The liver of Con mainly showed obvious hepatocyte lobular central steatosis and/or scattered steatosis. The steatosis was mainly composed of small vacuoles, and scattered hepatocyte degeneration showed large fatty vacuoles. Compared with Con, Pio still had vacuoles, but the number and volume of the vacuoles were significantly reduced, and liver fat samples were reduced. In Low, there were still obvious vacuoles present, with obvious hepatocyte fat deformation. The degree of lobular steatosis in the group was reduced. High also had mild lobular central steatosis. These experiments demonstrate that Pio, High, and Medium can alleviate liver fatty lesions in db/db mice to varying degrees.
Liver Index of Each Group of Animals After 8 Weeks (n = 6).
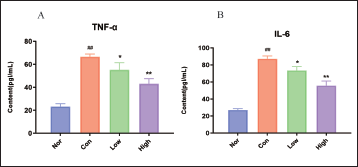
Effect of WEG on Release of Cytokines TNF-α and IL-6
As illustrated in Figure 5, the proinflammatory cytokines TNF-α and IL-6 in Con were significantly elevated, but treatment by WEG decreased these levels in serum in a dose-dependent manner (p < 0.05 or p < 0.01). As a positive control, Pio also had similar effects as WEG in db/db mice. These results suggest that WEG has an anti-inflammatory role.
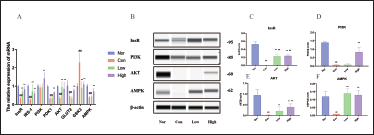
Effect of WEG on Activation of Insulin Signaling Pathway
As observed in Figure 6A, there was a significant decrease (p < 0.01) in the mRNA expression of key targets InsR, IRS-1, PDK1, AKT, GLUT2, and AMPK in Con db/db mice compared to Nor. Additionally, a significant increase (p < 0.01) in glycogen synthase kinase 3 (GSK-3) was observed. These results suggest that db/db mice exhibit characteristics of inhibiting insulin signal transduction and related pathways such as PI3K/AKT and AMPK are inhibited. WEG can increase the mRNA expression of InsR, IRS-1, PI3K, PDK1, AKT, GLUT2, and AMPK while decreasing GSK-3 mRNA in a dose-dependent manner. At the protein level, compared to normal mice, PI3K, p-AKT, and p-AMPK proteins in diabetic mice decreased significantly, but WEG intervention was found to alleviate this decline to varying degrees. The study also found that the expression of InsR in diabetic mice decreased significantly compared to normal mice but increased significantly after WEG intervention. Therefore, WEG can activate the transmission of insulin signals.
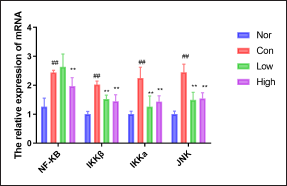
Effect of WEG on inhibition of Inflammation-related pathways
The study found that db/db mice had observable inflammatory responses and an enhanced activation of the inflammatory pathway related to IR. The mRNA expression of NF-κb, IKKβ, IKKα, and JNK was significantly increased in db/db mice compared to Nor C57BL/6J mice. However, High significantly reduced the mRNA expression of these target genes in the liver of db/db mice. Low was found to reduce expression of IKKβ, IKKα, and JNK in the liver of db/db mice (Figure 7).
Discussion
In the late twentieth century, a new hypothesis emerged regarding the development of T2DM. This hypothesis suggests that chronic low-grade inflammation is closely associated with IR, obesity, T2DM, and its associated complications (Fahed et al., 2022; Sutthasupha & Lungkaphin, 2020). It is important to note that chronic low-grade inflammation differs from traditional inflammation, also known as metabolic inflammation. The pharmacological effects of G. turkestanorum have shown promising results in treating and preventing inflammatory diseases due to its anti-inflammatory and analgesic properties. Therefore, we simultaneously explored WEG in treating T2DM from two aspects: insulin signal transduction and inflammatory pathways.
The experimental results showed that during the 8 weeks of drug intervention, each dosage group of WEG could reduce the fasting BG and random BG of db/db mice in a dose-dependent manner. This suggests that WEG has some modulating effect on BG. Fasting BG is an indicator of basal insulin secretion in the body. It is possible that WEG promotes insulin secretion, which could explain the initial reduction in fasting BG observed during the early stages of the experiment. WEG can significantly reduce the AUC of the OGTT and ITT. WEG was demonstrated to significantly reduce Fins and increase QUICKI in db/db mice, thereby alleviating hyperinsulinemia and IR in db/db mice. The above results indicate that WEG can improve db/db glucose metabolism abnormalities and IR by increasing insulin sensitivity. The administration of WEG has been shown to have a significant impact on the results of OGTT and ITT, resulting in a decrease in AUC. In addition, WEG can decrease Fins and increase QUICKI, ultimately leading to an improvement in IR and hyperinsulinemia. These findings suggest that WEG may be a useful intervention for improving glucose metabolism abnormalities and insulin sensitivity in individuals with diabetes. The results of blood lipid content and liver pathology tests indicate that WEG has the potential to enhance lipid metabolism in db/db mice. The weight of the mice in the High group was notably greater than that of the Con group starting from week 7. Additionally, both the High and Pio groups had significantly higher weights than the Con group starting from week 8. Clinical studies have reported that thiazolidinedione drugs such as pioglitazone and rosiglitazone act as insulin sensitizers and can lead to weight gain (Aronoff et al., 2000). During this experiment, when the mice kept eating and drinking freely, High and Pio showed weight gain in the mice in the final stage. It is plausible that this is linked to the increase in the bioavailability of insulin. They promote the synthesis of fat and glycogen, so although its BG drops, weight increases. Overall, WEG can improve the glucose and lipid metabolism of db/db mice, increase their insulin sensitivity, alleviate their IR, and thereby improve T2DM symptoms to a certain extent.
The proper functioning of insulin signaling is crucial for regulating glucose metabolism and maintaining normal BG in the body (Su et al., 2023). In T2DM, the liver is particularly susceptible to IR. Insulin regulates energy and lipid metabolism by activating an intracellular signaling cascade that involves InsR, IRS, PI3K, and AKT, which is the classical pathway of insulin signal transmission (Liu et al., 2022; Softic et al., 2020). IRS-1 is a crucial factor in regulating insulin metabolism in peripheral tissues as well as promoting cell proliferation and differentiation (Luo et al., 2023). Decreased expression of IRS-1 has been linked to IR (Lavin et al., 2016). The experiment indicated that, compared with Nor, the mRNA expression of IRS-1 in Con was significantly decreased, dampening the initiation and transmission of downstream signaling pathways. WEG was demonstrated to significantly increase the expression of IRS-1 in the liver of db/db mice, thereby initiating the transmission of downstream signaling pathways. Upon activation of IRS, downstream signaling pathways are initiated, including the PI3K/AKT pathway. PI3K activates AKT through a series of processes, which in turn activate a variety of substrates, leading to the mediation of various biological effects of insulin (Saltiel & Kahn, 2001; Wu et al., 2023; Zheng & Wang, 2021). The activation of AKT can promote the inactivation of GSK-3, reduce its inhibition of glycogen synthase activity, promote glycogen synthesis in cells, and lower BG levels. WEG can significantly activate PI3K, increase the protein phosphorylation levels and mRNA expression levels of AKT in the liver of db/db mice, and hence alleviate the IR. AMPK is an enzyme referred to as a master regulator of metabolism via catabolic pathways (Trefts & Shaw, 2021). The phosphorylation of AMPK (Thr172) stimulates glucose uptake and fatty acid oxidation in cells, thereby improving glucose homeostasis, and IR, and reducing serum adipose factor levels in obese diabetic mice (Huang et al., 2021). At the same time, the activation of AMPK can inhibit gluconeogenesis and up-regulate the expression of GLUT2 (Kang et al., 2017). WEG can significantly increase the protein phosphorylation levels and mRNA expression levels of AMPK, synergistically alleviating IR. So, WEG can enhance insulin signal transduction.
Studies have confirmed that inflammatory factors secreted by adipocytes can interfere with the physiological effects of insulin, leading to IR. Proven inflammatory cytokines that cause IR include TNF-α, IL-6, and so on (Tripolino et al., 2021). The free fatty acids and inflammatory cytokines produced by adipose tissue enter the liver, muscles, and other target tissues with the blood circulation. This leads to activation of NF-κB and JNK inflammatory signal pathways and directly or indirectly inhibits the activity of IRS, blocking the further conduction of insulin signals and triggering the body to produce IR (Mattera et al., 2019). WEG can significantly reduce the levels of TNF-α and IL-6 in the plasma of db/db mice and reduce the expression of NF-κB, IKKβ, IKKα, and JNK in inflammatory pathways, thereby inhibiting the IKKα/β/NF-κB and JNK pathways and their downstream branch targets. Therefore, WEG can reduce the body’s chronic hypotension and inflammation and coordinately alleviate IR.
Conclusion
The results suggest that WEG can alleviate IR and treat T2DM in db/db mice. This effect is not only related to the classic insulin signaling and inflammation-related pathways but also to amino acid metabolism. This discovery will guide further research on G. turkestanorum and promote its development as a TCM for treating T2DM.
Abbreviations
AUC: Area under the curve; BG: Blood glucose; JNK: C-Jun N-terminal kinase; DM: Diabetes mellitus; ELISA: Enzyme-linked immunosorbent assay; Fins: Fasting insulin; GLUT2: Glucose transporter type 2; GSK-3: Glycogen synthase kinase 3; H-ESI: Heated electrospray ion source; HE: Hematoxylin-eosin; HDL-C: High-density lipoprotein; IKKα/β: Inhibitor of nuclear factor kappa-B kinase α/β; IR: Insulin resistance; IRS: Insulin receptor substrate; InsR: Insulin receptor; IL-6: Interleukin-6; ITT: Islet tolerance test; LDL-C: Low-density lipoprotein; Con: Model control group; NF-κB: Nuclear factor kappa-B; Nor: Normal group; OGTT: Oral glucose tolerance test; PI3K: Phosphoinositol 3-kinase; Pio: Positive group; AKT: Protein kinase B; T2DM: Type 2 diabetes mellitus; WEG: The water extract of Gentianella turkestanorum; TC: Total cholesterol; TG: Triglyceride; TCM: Traditional Chinese medicine; TNF-α: Tumor necrosis factor-α; WEG High: WEG high-dose group; WEG Middle: WEG medium-dose group; WEG Low: WEG low-dose group; PDK1: 3-phosphoinositide-dependent kinase-1.
Footnotes
Acknowledgments
Thanks to Professor Liu Chunsheng of Beijing University of Chinese Medicine for his identification of traditional Chinese medicine. Thanks to Xinjiang Medical University for providing plant sources.
Declaration of Conflicting Interests
The authors declared no potential conflicts of interest with respect to the research, authorship, and/or publication of this article.
Ethical Statement
The animal experiments conducted in this study were approved by the Animal Care and Ethics Committee of Inner Mongolia Medical University (approval No.YKD202101061) and conformed to internationally recognized principles of laboratory animal use and care.
Funding
This work was supported by the Natural Science Foundation of Inner Mongolia (2021BS08003), the National Natural Science Foundation of China (82104474), and Inner Mongolia Medical University Science and Technology Million Project (YKD2020KJBW (LH)032).
Patient Consent Statement
Not applicable.
Patient Consent Statement
Not applicable.