
Abstract
Age estimation of an individual is often required in civil and criminal cases, as well as in sports competitions. The study of the epiphyseal union of bones is considered a reasonable and accepted scientific method for estimating age by courts of law all over the world. The present work is a prospective cross-sectional study in which a calculated sample size of 86 subjects is studied. A comparative study is conducted between the chronological age (CA) of the subjects and the estimated age derived using the Tanner–Whitehouse (TW3) method. Based on the results, the following conclusions are drawn about the TW3 method in our set-up: (a) It is reliable for bone age assessment (BAA) with a root mean square (RMS) deviation of ±0.7Y = ±8 months. (b) It has a lower rate of correct classification in boys (40%) compared to girls and is a better match for girls. (c) It tends to underestimate age in both genders, so readings should be interpreted as far as possible toward the higher side. (d) CA predictions within six months (CA ± 6 months) are above 46.51%. in both genders. This study demonstrates the reliability of the results obtained through BAA using the TW3 method.
Introduction
Age estimation of an individual is often required in civil and criminal cases, as well as in sports competitions. The study of the epiphyseal union of bones for bone age (BA) is considered a reasonable and accepted scientific method for the estimation of age by courts of law all over the world. 1 Chronological age (CA) is defined as the age in years between birth and the evaluation of a subject; BA is defined as the age expressed in years that corresponds to the level of maturation of bones. This determination is based on the presence of particular centres of bone formation, as well as the dimension and structure of the bones. 2
The Tanner–Whitehouse (TW) method was developed in 1930 using data obtained from European children.3, 4 It is based on the determination of a score obtained from hand and wrist skeletal maturation. A score is assigned to each bone based on the maturation and sex of the participant. In this way, a maturity score is obtained for each area of clinical interest, generally categorised as A, B, C, D, E, F, G, H and I. A numerical value is then assigned to each stage with specific differences between genders. Over the years, this system has been refined by moving from an initial system known as the TW1 method to two subsequent methods known as TW2 and TW3.3–5 The score based on 20 bone segments was abolished, and a new one based on 13 bones has been established, and the reference values and graphs were modified based on data obtained from native North American children. Thus, establishing specific parameters for other populations is valuable because the subjects used to develop the standard methods were from the United States and Europe. Conventional age estimation techniques can only give an age estimate in terms of plus-minus one to two years. The present study aims to bring out the feasibility of TW3 skeletal age estimation in the ethnic Meitei population with a close approximation in terms of months and to help in formulating a standardised system specifically for the ethnic Meitei population by comparing the TW3 RUS SA (TW3 Radius-Ulna-Short Bones Skeletal Age) of ethnic Meitei youths with their CA.
Materials and Methods
The present study is a prospective cross-sectional study. Athletes who came for age determination in the Forensic Medicine & Toxicology department of a tertiary care teaching hospital in Imphal, as well as healthy ethnic Meitei subjects in various schools in Imphal, were included.
The sample size was calculated using PASS software, with alpha = 0.05, beta = 0.02 (80% power), and correlation to detect = 0.03. After obtaining approval from the institutional ethics committee and informed written consent from the participants, left-hand wrist radiographs of 86 healthy Meitei subjects (45 boys and 41 girls) aged 12–18 years were analysed. Individuals with bony abnormalities, including fractures, and those diagnosed with growth or endocrine disorders were excluded. The BA was estimated using the TW3 method, which calculated the average of the RUS bone score. Participant-identifying information, except for sex, was masked during interpretation, including the subject’s CA. The correlation between the BA and CA of each person was analysed using Pearson’s correlation coefficient and scatter plot.
The data were analysed using the SPSS statistical software (version 25.0, SPSS, Inc., Chicago, IL, United States). A paired student’s t-test was used to compare CA with BA by the TW3 method for the cohort stratified by gender. Frequency tests were carried out to analyse the correlation between CA and the discrepancy between CA and BA for at least six months. A P < .05 was considered significant. The differences between CA and measured BA were calculated for each participant, and the root mean square (RMS) of the differences between the two was calculated.
Results
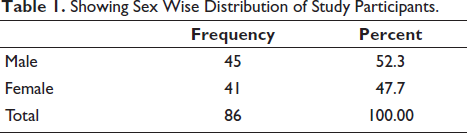
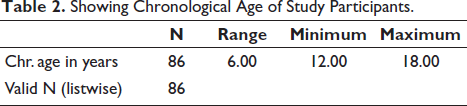
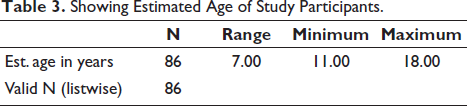
A total of 86 cases were studied. There were 45 male subjects and 41 female subjects (Table 1). The CA of the study participants ranged from 12 to 18 years (Table 2). The estimated age of the study participants using the TW3 method ranges from 11 to 18 years (Table 3).
Showing Sex Wise Distribution of Study Participants.
Showing Chronological Age of Study Participants.
Showing Estimated Age of Study Participants.
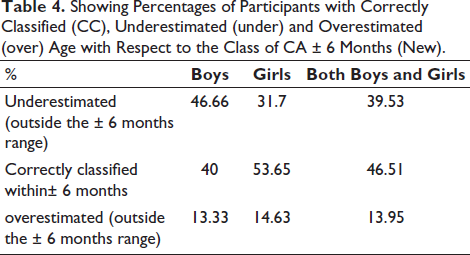
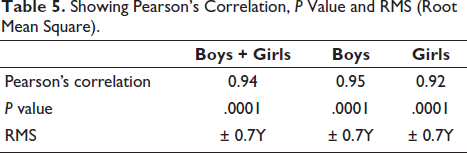
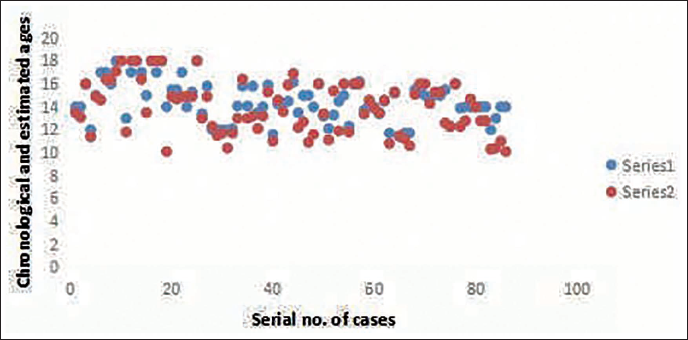
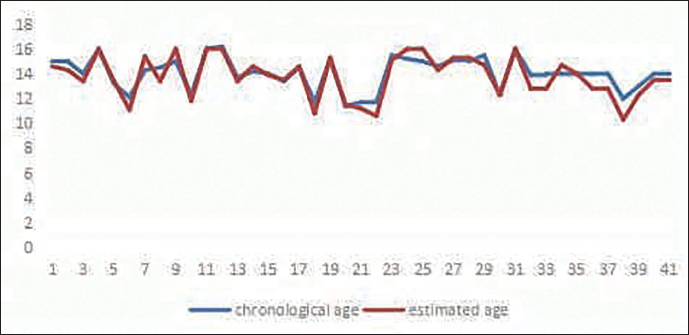
It was observed that underestimation was more common in boys than in girls. Girls have a higher chance of correct age classification (Table 4). Thus, the TW3 score seems to be a better match for girls’ ages than for boys’. The Pearson’s correlation coefficient between the CA and estimated age for both boys and girls was 0.94. The paired t-test between the CA and estimated age was statistically significant, with a two-tailed P value of .0001 for both boys and girls (Table 5). Figure 1 shows the scatter plot for both boys and girls in CA and the estimated age. Figure 2 shows the line chart showing a correlation between boys’ and girls’ chronological and estimated ages.
Showing Percentages of Participants with Correctly Classified (CC), Underestimated (under) and Overestimated (over) Age with Respect to the Class of CA ± 6 Months (New).
Showing Pearson’s Correlation, P Value and RMS (Root Mean Square).
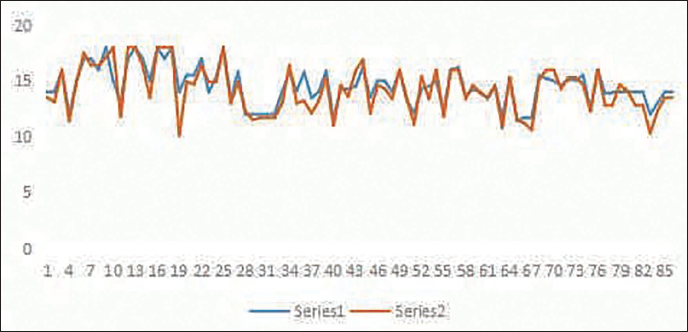
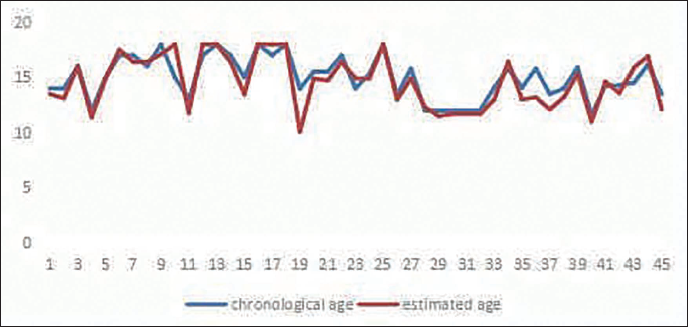
For boys, the correlation between CA and estimated age was 0.95, and for girls, the correlation between CA and estimated age was 0.92. Figure 3 shows the line chart showing a correlation between boys’ chronological and estimated ages. Figure 4 shows the line chart showing a correlation between girls’ chronological and estimated ages.
The RMS of differences for males and females combined was ±0.7Y or ±8 months (Table 5). For boys, the RMS of differences was ±0.7Y, and for girls, the RMS of differences was ±0.7Y. In boys, the estimated age was within ±6 months of the CA for 18 out of 45 cases, or 40%. It was underestimated in 21 out of 45 cases, or 46.6%, and overestimated in 6 out of 45 cases, or 13.33%. In girls, the estimated age was within ±6 months of the CA for 22 out of 41 cases, or 53.65%. It was underestimated in 13 out of 41 cases, or 31.17%, and overestimated in 6 out of 41 cases, or 14.63%.
In both boys and girls, age estimation was within ±6 months of the CA in 40 out of 86 cases, or 46.51%. It was underestimated in 34 out of 86 cases, or 39.53%, and overestimated in 12 out of 86 cases, or 13.95%. It was also observed that fusion occurred earlier on the left side in both males and females. The phalanges fused earlier than the heads of the metacarpals, and the heads of metacarpals two to five were the last to fuse.
Discussion
Bone age assessment (BAA) is commonly and widely used to reflect skeletal maturity, evaluate growth status, and predict the future height of children. The TW3 method can evaluate and score the maturity of each hand and wrist bone. 6 The reference population of this study consisted of European and American families with average socio-economic status during the 1980s and 1990s, and the data were adjusted for the secular trend in 2001.
In a cross-sectional observational study on healthy Indian children in Pune, 7 the TW3 method was found to be the most suitable method overall (P < .05). The TW3 method was also the most applicable in prepubertal boys (P < .05), prepubertal girls (although not significant with P > .1), and pubertal girls (P < .05).
The differences between the chronological and estimated ages can be positive or negative, depending on whether the CA is greater or less than the estimated age. To eliminate the difference in signs, these differences are squared first and then the square root is taken to determine the deviation between the two ages. When comparing the RMS deviation between CA and BA for various methods of BA assessment, the TW3 method had the least RMS deviation, suggesting it to be the most suitable method for BA assessment of children. 7 In our study, the RMS was only ±0.7 months, which is lower. The P value (2-tailed, paired) was .0001 for both boys and girls, and the RMS of males and females was ±0.7 years or ±8 months. This indicates that the correlation is significant, as the P value is less than .05, and the age of the subject, whether a boy or a girl, can be determined within a range of plus or minus eight months.
In Thai children (8–16 years), BA was underestimated in boys until 12 years of age, after which it was overestimated. In girls, BA was overestimated at all ages. 8 In our study, there is also a tendency to underestimate BA.
In the present study, in boys, the estimated age was within ±6 months of CA in 40% of cases. It was underestimated in another 46.66% of cases and overestimated in 13.33% of cases. In girls, the estimated age was within ±6 months of CA in 53.65% of cases, underestimated in 31.7% of cases, and overestimated in 14.63% of cases. In both boys and girls, the estimated age was within ±6 months of CA in 46.51% of cases, underestimated in 60.43% of cases, and overestimated in 13.95% of cases. Therefore, the TW3 score seems to match more closely with girls’ ages than boys’.
In our study, BA was underestimated more in boys, which is similar to a study on Indian boys. 7 In Indian girls, BA is underestimated until the pubertal growth spurt, after which there is a rapid advancement of BA. 7
According to a study on Turkish children, the TW3 method underestimated the age of both male and female subjects, 9 which is somewhat similar to our results. In a Chinese study, there was a tendency to overestimate the age of both genders. In a sample of normal Korean children, the skeletal age using the TW3 method was overestimated for male individuals (59.6%) and female individuals (72.2%). 8
In a study in Turkey, Büken et al. 10 compared the TW3, GP, and GÖK12 methods in a sample of Turkish children aged between 11 and 16 years. They reported that TW3 underestimates the BA in both genders, resulting in mean differences in years between the CA and the estimated BA of −0.21 years for girls and −0.18 years for boys. They also reported that TW3 was the most accurate method, followed by GP in females, while for males, the GP method was the most accurate, followed by TW3. Our study also found underestimation to some extent (31.7% in girls and 46.66% in boys).
Schmidt et al. 11 found that in the legally relevant BA group between 14 and 16 years, the differences between the skeletal age and the mean value of the CA ranged from −0.4 to +0.2 years for TW3. TW3 (specificity 87.5 for males and 83.87 for females) was more reliable than GP, especially in criminal cases, given the remarkable trend of GP (specificity 87.2 for males and 82.8 for females) to overestimate the age.
Predictions with an age span of six months (EA ± 3 months) produced a very low occurrence of correct classifications (GP: 16% and 11.2%; TW3: 23.5% and 16.1%, respectively, for males and females). Therefore, some workers 12 suggested a greater span of age should be considered appropriate when providing a BA estimation, especially for forensic aims. Thus, we used a greater span of ±6 months, which resulted in a correct classification of 40% in boys, 53.65% in girls, and 46.51% in both boys and girls.
The combination of different methods for estimating skeletal age and an age assessment resulting from the evaluation of skeletal development, along with other biological features, may assure more reliable evidence for accomplishing the legal demands of age estimation.
In a previous study of Turkish children performed by Ersoy, 13 significant differences were found between CA and BA for boys only between 11 and 17 years of age using the TW3 method. The author determined that the differences were between 0.57 and 0.97 years for girls (0.57 years only at 11 years of age) and that the overestimation was between 0.32 and 1.13 years for boys of all ages. The differences were not significant for both genders, except for girls at 15 years of age. In our study, the underestimation between CA and BA for boys was between 0.3 and 1 year, and the overestimation was between 0.3 and 1.7 years. In girls, underestimation was between 0.1 and 1.7 years, and overestimation was between 0.1 and 1 year.
Unlike our findings, Haiter-Neto et al. 14 determined that there was no statistically significant difference between CA and BA using the TW3 method for both sexes in Brazil.
The studies of Birkberk and Herbert 15 and Wenzel and Melsen 16 stated that for boys up to about age nine, there were no discrepancies by the TW3 method. After that age, BA became delayed compared with the TW3 standards. In our study, an underestimation of BA was observed in the 12–18-year age group.
The present study, which is the first TW3 study done in this region, has some limitations. First, this is a cross-sectional study of only the Meiteis, and therefore the sample size is small. Second, it only covers a specific range of the population in the Imphal area. These results may only apply to the urban area of Imphal. Third, age groups under 12 years old were excluded for both sexes. Finally, we could not ascertain the full health of the participants, although no remarkable history of any genetic syndrome or trauma was noted. Hence, in-depth studies of all the tribes of this region are essential to substantiate these findings.
Conclusion
The present study aimed to compare the CA and BA of ethnic Meiteis using the TW3 method to determine the reliability. Based on the results, we could draw the following conclusions: the TW3 method (a) is reliable for BAA in clinical practice with an RMS deviation of ±0.7Y = ±8 months, (b) has a lower rate of correct classification in boys (40%) than girls and is more matching for girls, (c) has a tendency to underestimate in both genders and thus, reading should be done as far as possible towards the higher side. Furthermore, predictions within six months (CA ± 6 months) are above 53.65% in girls and 40% in boys. This study demonstrated that the results of BAA using the TW3 method are reliable.
Footnotes
Acknowledgement
We are grateful to the Department of Radiodiagnosis, Regional Institute of Medical Sciences, Imphal for allowing the utilization of resources for taking radiographs of the study subjects.
Declaration of Conflicting Interests
The authors declared no potential conflicts of interest with respect to the research, authorship and/or publication of this article.
Ethical Approval
The ethical clearance has been granted by the Institutional Ethics Committee.
Funding
The authors disclosed receipt of the following financial support for the research, authorship, and/or publication of this article: Regional Institute of Medical sciences (RIMS) Golden Jubilee Research Initiative (Intramural project).
Informed Consent
The informed consent has been obtained from the participant for this study.