
Abstract
Objectives
When evaluating potential new cancer screening modalities, estimating sensitivity, especially for early-stage cases, is critical. There are methods to approximate stage-specific sensitivity in asymptomatic populations, both in the prospective (active screening) and retrospective (stored specimens) scenarios. We explored their validity via a simulation study.
Methods
We fit natural history models to lung and ovarian cancer screening data that permitted estimation of stage-specific (early/late) true sensitivity, defined as the probability subjects screened in the given stage had positive tests. We then ran simulations, using the fitted models, of the prospective and retrospective scenarios. Prospective sensitivity by stage was estimated as screen-detected divided by screen-plus interval-detected cancers, where stage is defined as stage at detection. Retrospective sensitivity by stage was estimated based on cancers detected within specified windows before clinical diagnosis with stage defined as stage at clinical diagnosis.
Results
Stage-specific true sensitivities estimated by the lung cancer natural history model were 47% (early) and 63% (late). Simulation results for the prospective setting gave estimated sensitivities of 81% (early) versus 62% (late). In the retrospective scenario, early/late sensitivity estimates were 35%/57% (1-year window) and 27%/49% (2-year window). In the prospective scenario, most subjects with negative early-stage screens presented as other than early-stage interval cases. Results were similar for ovarian cancer, with estimated prospective sensitivity much greater than true sensitivity for early stage, 84% versus 25%.
Conclusions
Existing methods for approximating stage-specific sensitivity in both prospective and retrospective scenarios are unsatisfactory; improvements are needed before they can be considered to be reliable.
Introduction
The sensitivity of a cancer screening test is the primary diagnostic measure used to determine whether the test has potential to reduce disease mortality. In practice, high sensitivity for early-stage cancer is paramount. 1 Stage-specific sensitivity is often reported in studies of patients with clinically diagnosed disease, but these metrics may not apply to asymptomatic populations. In such populations, most prior work has focused on methods for estimating overall, but not stage-specific sensitivity.2–5 True pre-clinical stage-specific sensitivity, defined as sensitivity to detect preclinical disease of a given stage at the time of the test, cannot usually be estimated empirically because this requires a gold standard test to be given to everyone, regardless of their screening test result, to determine their true disease status.
To the extent that sensitivity by stage has been estimated, it has usually been assessed in one of two scenarios. The first is when persons are undergoing active screening (prospective setting), where the screening result can prompt a diagnosis and disease staging. 6 The second, typically employing a nested case-control design, is when serum specimens are stored and retrospectively assessed with the test and hence where test results do not affect time of diagnosis or stage 7 (retrospective setting).
Both these scenarios present challenges to validly estimating sensitivity by stage. Under active screening, false negatives are unobserved at the time of the test. This complicates empirically estimating overall sensitivity due to the well-understood issue of verification bias. 8 A stage-specific version of sensitivity based on the detection method, which computes the ratio of screen-detected and screen- plus interval-detected cases, is available for this setting, but its statistical properties have not been studied. In a retrospective study, while the stage at diagnosis is known, the stage at the time of screening is unknown. Further, as the delay between screening and diagnosis increases, the likelihood of stage discordance increases. There has been little literature on how these estimated stage-specific sensitivities compare for the same modality evaluated in the prospective versus retrospective setting.
Multi-state models of disease natural history that include sensitivity parameters reflecting true sensitivity address the verification bias problem in principle, but are typically limited by assuming that screening test sensitivity is constant over time. A number of such models utilizing a single pre-clinical state have been developed; however, these are only able to estimate sensitivity overall and not by stage.9–11 A model with multiple pre-clinical states that parameterizes sensitivity by stage has also been proposed, but its properties have not been widely studied. 12 Additionally, these models need extensive screening study data with adequate numbers of screen- and interval-detected cases to identifiably fit the model parameters.12–14
In this article, we first examine methods that have been used to empirically estimate sensitivity by stage in the prospective and retrospective scenarios. We then utilize a natural history model with early and late-preclinical stages to estimate stage-specific sensitivity parameters for two screening modalities, chest radiographs (CXR) for lung cancer screening, and CA-125 and transvaginal ultrasound (TVU) for ovarian cancer screening. We do this by fitting the model to data from the lung and ovarian components of the Prostate, Lung, Colorectal and Ovarian (PLCO) Cancer Screening Trial. Finally, using the fitted models, we run simulations of the prospective and retrospective scenarios to generate disease and diagnosis histories, from which estimated empirical sensitivity under the two scenarios is computed and compared with true sensitivity.
Methods
Estimates of sensitivity by stage in prospective and retrospective scenarios
In the prospective scenario, under active screening, cases are typically classified as either true positives (TPPRO) or false negatives (FNPRO) according to whether their diagnosis followed (within a specified interval) a positive or negative screen. 6 Sensitivity by stage has previously been estimated by a stage-specific version of the detection method with the estimate given by TPPRO cases of that stage divided by TPPRO plus FNPRO of that stage. 15 Here, stage is that at the time of screen-detected diagnosis for TPPRO and that at the time of clinical diagnosis for FNPRO.
In the retrospective scenario, a cohort not undergoing screening (for the cancer of interest) has blood sampled periodically and stored. 7 After sufficient follow-up, clinically diagnosed cases are identified. The screening test is then retrospectively performed on the stored samples. Stage is defined by stage at (clinical) diagnosis. A true positive (TPRETRO) early- or late-stage case is a case diagnosed in that stage with a positive test on the stored sample, and a false negative (FNRETRO) early- or late-stage case is one diagnosed in that stage with a negative test on the sample. Sensitivity by stage is estimated by the ratio of TPRETRO cases to TPRETRO cases + FNRETRO cases. These sensitivity estimates in the retrospective and prospective scenarios are denoted as empirical sensitivity estimates.
Natural history model
The natural history model we utilize has been described previously. 12 Figure 1 shows a schematic of the model. For simplicity, there are only two cancer stages, early and late. The model posits five disease states as follows: non-cancer, preclinical early and late stages, and clinical early and late stages (Figure 1). This is a Markov model with exponential distributions assumed for the transition times from pre-clinical early to preclinical late stage and from pre-clinical to clinical states within stage. The model also includes parameters for sensitivity by stage, which we term “true sensitivity” (SETR) because these sensitivities are used in the simulation as specifications for the true preclinical sensitivity, which is assumed to be constant over time given stage. Under screening, for subjects in pre-clinical early (late) stage at the screen, cancer is detected (i.e. the screen is positive) with probability equal to the early (late) stage sensitivity parameter. For positive screens, we assume that stage is unchanged from the screen to diagnosis.
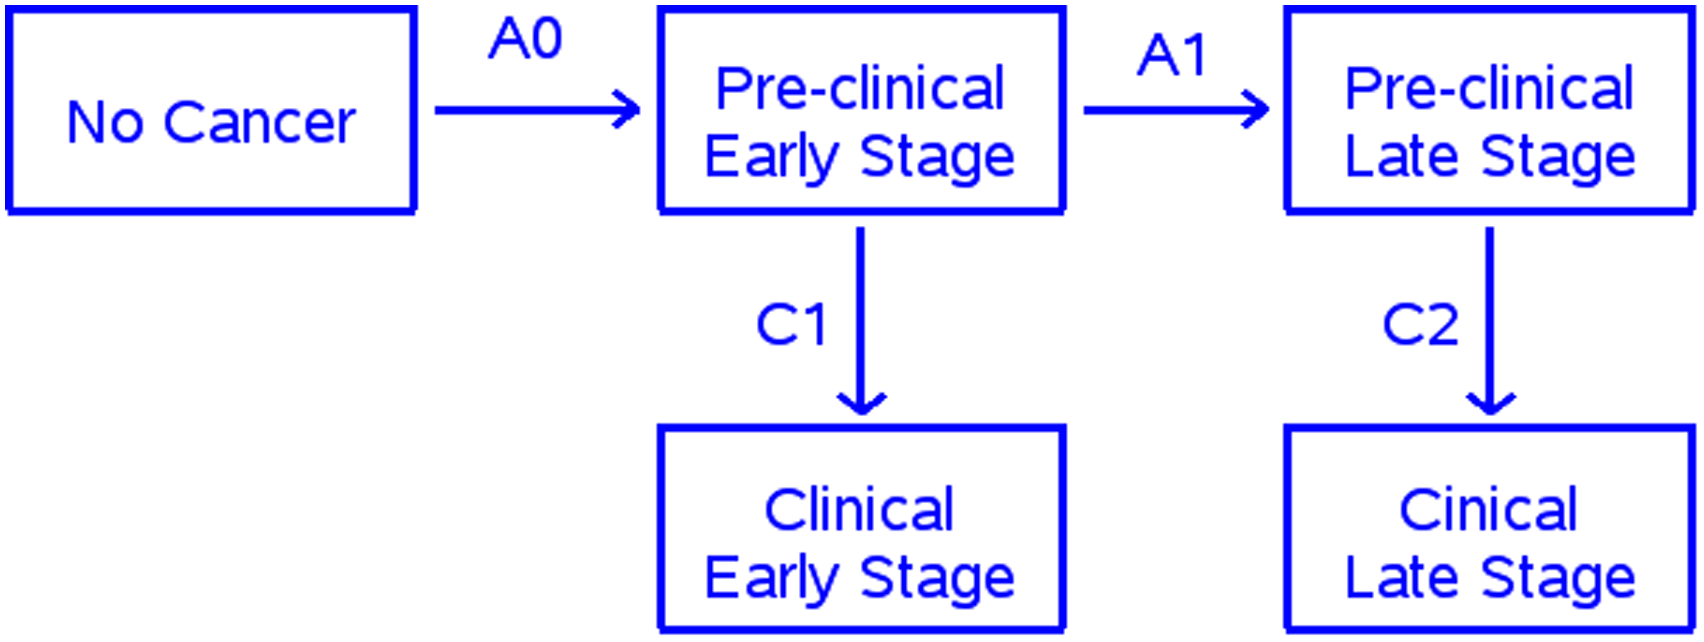
Natural history model.
The PLCO trial
The PLCO lung component compared CXR screening for four annual rounds with no screening. 16 We use data from the CXR-arm non-small cell lung cancer cases diagnosed during the screening and post-screening periods. Early and late stage was defined as stages I-II and III-IV, respectively. All cases diagnosed, either by screening or clinically, within a year of a screen were captured in the screening period (years 0–3). The post-screening period included cases diagnosed 6–10 years after randomization to preclude any residual effects of screening.
The PLCO ovarian component compared screening with CA125 and TVU with no screening. 17 Screening arm women received four annual screens with both modalities (a positive result on either test denoted a positive overall screen), plus two additional annual rounds with CA125 alone. Since sensitivity could change with the dropping of TVU in the later rounds, we only used cases diagnosed during the first four rounds for the screening period data. For post-screening, we used cases diagnosed 8–12 years after randomization, again to preclude any residual effects of screening.
During the screening period, TPPRO and FNPRO early-stage cases were defined as cases diagnosed in early stage and within 1 year of positive and negative screening tests respectively; TPPRO and FNPRO late-stage cases were defined similarly. Early- and late-stage empirical sensitivities were defined as SEPRO = TPPRO/(TRPRO+FNPRO) for each stage.
Model fitting and simulations
We fit the natural history models to the observed PLCO screening and post-screening period data using maximum likelihood and the gradient descent method. 18 Details of the model fitting procedure are given in Supplemental Appendix I. Using the fitted model, we then simulated natural histories and diagnoses and produced virtual datasets corresponding to the prospective and retrospective scenarios. The simulations yielded virtual cohorts (of 150,000 persons) with incidence, mode of diagnosis, and stage at detection for each participant.
In the prospective scenario, we simulated screening over either two or four annual rounds. True positive and false negative cases as defined above for the PLCO trial (i.e. diagnosis within 1 year of a positive and negative screen, respectively) in early and late stage were identified. Screens occurring in the non-cancer state were negative by definition. Empirical sensitivity by stage (SEPRO) was calculated as TPPRO cases divided by TPPRO cases + FNPRO cases for each stage. In the retrospective scenario, pre-diagnosis windows of varying times were used, with the time of sampling taken as a random time within the window. Simulated TPRETRO early (late) stage cases were defined as cases in a preclinical state at the time of the screen, a positive screen result, and clinical diagnosis in early (late) stage. FNRETRO early (late) stage cases were defined as either cases in a preclinical state at the time of the screen and a negative screen result or cases in the non-cancer state at that time, and clinical diagnosis in early (late) stage. Empirical sensitivity by stage in this scenario (SERETRO) was estimated as TPRETRO cases divided by TPRETRO plus FNRETRO cases in each stage.
Results
Table 1 provides observed PLCO results on stage distribution and sensitivity by stage using the detection method for the screening and post-screening periods. For lung cancer, early-stage cases comprised 53% and 36% of cases in the screening and post-screening periods, respectively. The prospective empirical sensitivity estimate derived directly from the PLCO data was higher for early-stage (81%) compared to late-stage (59%) cases. The fitted model parameters are shown in Table 1. The sensitivity parameters (SETR) were 47% and 63% for early and late stage, respectively. Under the prospective and retrospective scenarios, the empirical estimates of sensitivity by stage given by the model simulations were very different. SEPRO estimates (prospective scenario) are higher for early (81%) than for late (62–64%) stage, and similar to observed prospective sensitivity in PLCO (Table 1). In contrast, SERETRO empirical sensitivity estimates (retrospective scenario) are lower for early than late stage and dependent on the length of the window; 34% (early) versus 53% (late) for a 1-year window, and 26% (early) versus 47% (late) for a 2-year window. For early stage, SEPRO and SERETRO are very different from the corresponding SETR values, much higher under prospective screening and somewhat lower in the retrospective scenario. In contrast, for late stage, the two estimates are each similar to the SETR values.
PLCO data and model results.
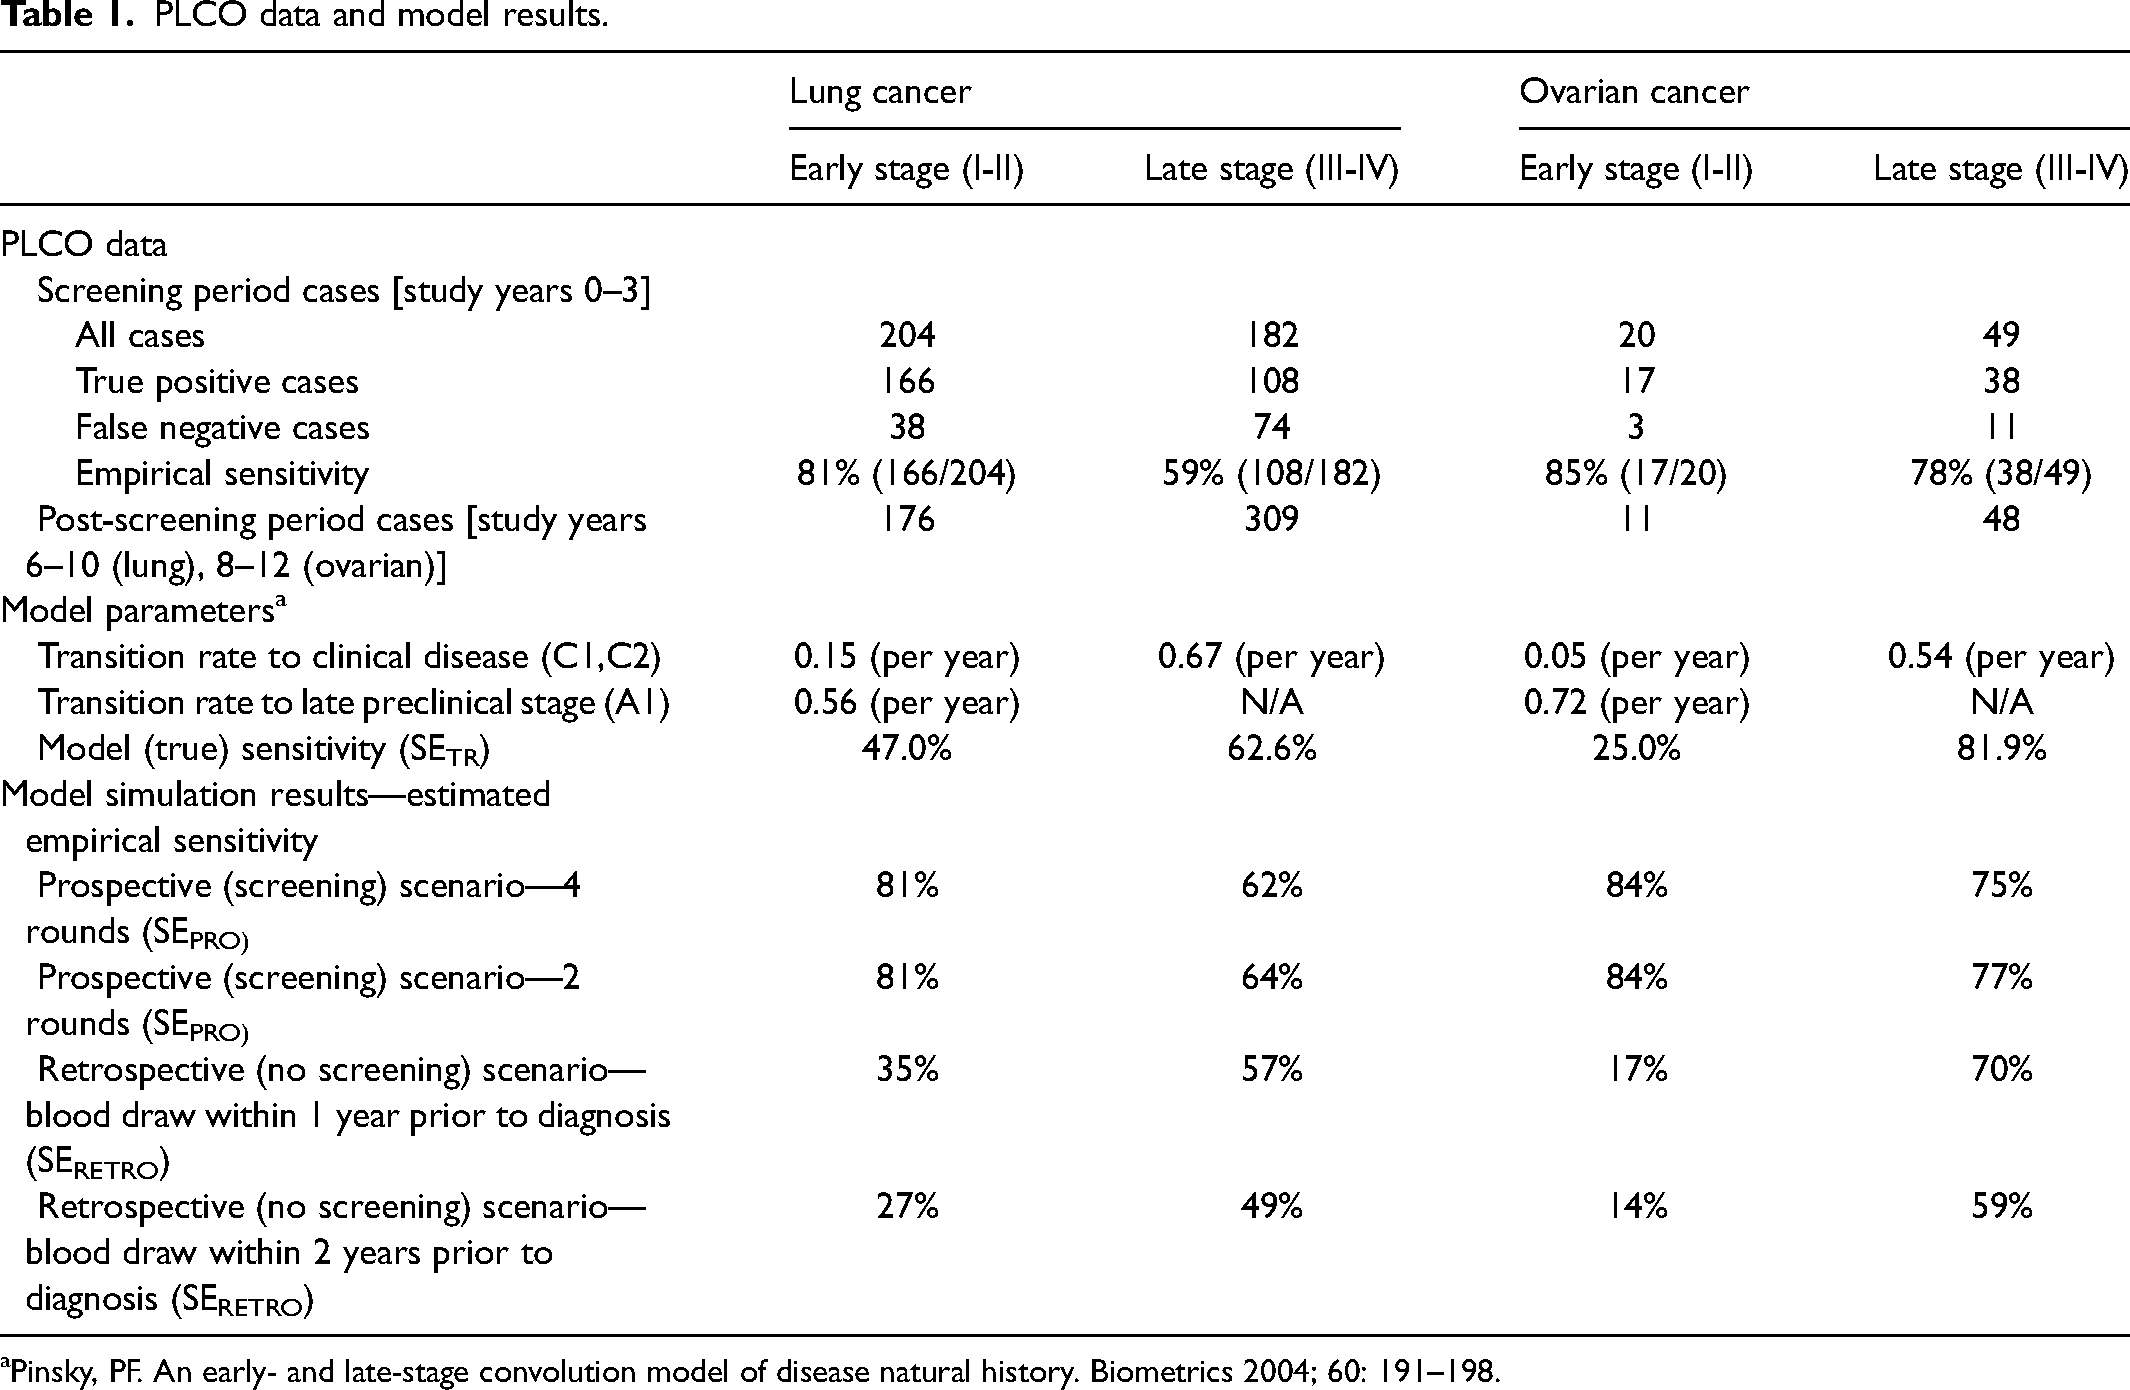
Pinsky, PF. An early- and late-stage convolution model of disease natural history. Biometrics 2004; 60: 191–198.
Similar patterns were seen for ovarian cancer (Table 1). Empirical sensitivity estimates from the PLCO data were 85% (early) and 78% (late), which contrasted sharply with the true sensitivity parameter estimates of 27% (early) and 76% (late). The prospective scenario sensitivity estimates from the model simulations were similar to the empirical estimates (85% and 75% for early and late, respectively, with four rounds of screening). As with lung, empirical sensitivity and simulated prospective sensitivity were higher for early than for late stage, in contrast to the sensitivity parameters. Under the retrospective scenario, sensitivity was much lower in early than late stage (17% versus 69% with a 1-year window).
We further analyzed the lung cancer simulation results to examine quantitatively the reasons for the differences between the stage-specific sensitivity estimates and the parameterized sensitivity values. A detailed quantitative analysis for the retrospective and prospective scenarios is given in Supplemental Appendix II. Briefly, in the retrospective scenario with a 1-year window, about a quarter (24.9%) of early-stage cases had their test sample obtained prior to cancer onset. Thus, labelling these cases as false negatives drives down the SERETRO estimate for early-stage disease. For the prospective scenario, where the early-stage SEPRO estimate was much higher than SETR, among individuals who had false-negative screen results in early stage, most (87%) were not counted as FNPRO early-stage cases, either because they were eventually diagnosed in late stage (whether screen detected or clinically) or were diagnosed post-screening (> 1 year after the last screen). In contrast, everyone with an early-stage positive screen was counted as a TPPRO early-stage case, since by assumption diagnosis was prompt after a positive screen, with no change in stage.
Discussion
In this study, we closely examined two versions of stage-specific sensitivity, one estimable from prospective screening studies and one estimable from retrospective stored serum studies. In the development of novel biomarkers, such studies are important because they directly address the sensitivity of a test to identify asymptomatic cases within each stage. Early-stage biomarker studies estimate stage-specific sensitivity among clinical-detected cases, but this performance is not guaranteed to transport to the asymptomatic population. We used simulations generated from natural history models fit to the PLCO lung and ovarian cancer screening trial data in order to provide estimates of (constant) stage-specific sensitivity as computed under the prospective and retrospective scenarios.
Our results show that these stage-specific sensitivity estimates for the prospective and retrospective scenarios (SEPRO, SERETRO) can depend heavily on the setting and estimation approach, and can differ from true sensitivity (SETR) as parameterized by the models, especially for early stage. They are not unbiased estimates of the true sensitivity parameters. In the retrospective setting, case subjects may not have even been diseased at the time the screening specimen was obtained. The wider the sampling window, the more likely that the test sample was obtained prior to cancer onset, especially for those clinically diagnosed with early-stage disease. For early-stage disease, false negative (FNRETRO) cases overestimate cases with actual false-negative screens, explaining why estimated sensitivity (SERETRO) is less than true sensitivity (SETR) and declines as the sampling window length increases.
In the prospective setting, empirical estimated sensitivity (SEPRO) is given by the ratio of screen-detected cases to the sum of screen- and false-negative (interval-detected) cases by stage. While a positive screen in early or late stage always results in a true-positive (TPPRO) case in that stage, many false-negative screens, especially in early stage, do not result in false-negative (FNPRO) cases in the same stage. In the lung cancer example, this was because most subjects with false-negative early-stage screens were diagnosed later in late stage, either clinically or by screening, or did not progress to clinical disease in the screening interval. Therefore, estimated sensitivity (SEPRO) for early stage was positively biased, greater than true sensitivity (SETR); further, SEPRO was greater for early- versus late-stage cases. As an extreme example of this bias, suppose a cancer type was never diagnosed clinically (i.e. without screening) in early stage. Then early-stage empirical sensitivity would be 100% regardless of true early-stage sensitivity, since the only early-stage cases would be the true-positive, screen-detected ones. In this example, everyone with false-negative screens in early stage would be diagnosed in late stage or outside the screening window, or at a subsequent true-positive screen in early stage.
We used a previously described model to estimate not only natural history (stage transition rates) but also sensitivity by stage for early- and late-stage cases. Natural history models have been fit to screening and diagnosis data for several cancers, but they generally do not estimate sensitivity due to the data requirements needed for model identifiability. We rigorously examined this issue and concluded that the data were adequate to assure identifiability of stage-specific sensitivity, particularly given the relatively lengthy follow-up for clinical disease after the last screen, which was found to enhance identifiability under a related model. 9
Our modeling exercise provides quantitative confirmation that the estimates derived via prospective and retrospective studies are likely to be different, but the differences go beyond study design or estimation method. In fact, the concepts of sensitivity in the two settings are different; they are not measuring the same thing. This is clarifying as it indicates that although the same term (“sensitivity”) is used in both settings, this is misleading. Neither is actually estimating true stage-specific sensitivity as it is typically defined. The prospective stage-specific sensitivity measures the fraction of cases diagnosed at each stage that are screen-detected and is subject to artifacts introduced by the screen result affecting timing of diagnosis and the fact that stage may differ at screen and diagnosis in interval cases. The retrospective stage-specific sensitivity measures the chance that disease detected at a certain stage would have been diagnosed up to k years earlier at that stage where k is the length of the sampling window. As we have seen, this is not the same as the chance that a test conducted today identifies a case in a given stage today, particularly for an early-stage case and a wide sampling window. We conclude that both of these versions of sensitivity are imperfect. We encourage practitioners to be apprised of their limitations and to use language that qualifies the version of sensitivity being estimated. Specifically, estimated sensitivity from the prospective and retrospective scenarios should be interpreted with caution, and not be taken to estimate true sensitivity.
A critical take-away from these results is that sensitivity estimates derived from prospective versus retrospective settings should not be directly compared. For example, if a new blood test for lung cancer is evaluated retrospectively using banked samples, the resulting sensitivity estimate should not be compared to sensitivity estimates for modalities such as CXR or low-dose computed tomography scans that were derived from prospective studies employing active screening. In addition, when comparing sensitivity estimates all derived from retrospective studies, it is important to consider the length of the sampling windows.
An alternative to estimating sensitivity by stage empirically in either the prospective or retrospective setting is to develop natural history models with parameters for stage-specific sensitivity as well as for transitions from preclinical to clinical disease. Although such models require data from large interventional screening studies and have well-known limitations, in principle the sensitivity estimates derived from them avoid the bias associated with the empirical estimates and can allow fairer comparisons across modalities. More research on the properties of these models with respect to estimating stage-specific sensitivity within and across different modalities would be a valuable addition to the literature.
Supplemental Material
sj-docx-1-msc-10.1177_09691413231154801 - Supplemental material for Estimating stage-specific sensitivity for cancer screening tests
Supplemental material, sj-docx-1-msc-10.1177_09691413231154801 for Estimating stage-specific sensitivity for cancer screening tests by Paul Pinsky, Jane Lange and Ruth Etzioni in Journal of Medical Screening
Footnotes
Declaration of conflicting interests
The author(s) declared no potential conflicts of interest with respect to the research, authorship, and/or publication of this article.
Funding
The author(s) received no financial support for the research, authorship, and/or publication of this article.
Supplemental material
Supplemental material for this article is available online.
References
Supplementary Material
Please find the following supplemental material available below.
For Open Access articles published under a Creative Commons License, all supplemental material carries the same license as the article it is associated with.
For non-Open Access articles published, all supplemental material carries a non-exclusive license, and permission requests for re-use of supplemental material or any part of supplemental material shall be sent directly to the copyright owner as specified in the copyright notice associated with the article.