
Abstract
Objective
To provide proof of concept for a simple model to estimate the stage shift as a result of breast cancer screening in low- and middle-income countries (LMICs). Stage shift is an essential early detection indicator and an important proxy for the performance and possible further impact of screening programmes. Our model could help LIMCs to choose appropriate control strategies.
Methods
We assessed our model concept in three steps. First, we calculated the proportional performance rates (i.e. index number Z) based on 16 screening rounds of the Nijmegen Screening Program (384,884 screened women). Second, we used linear regression to assess the association between Z and the amount of stage shift observed in the programme. Third, we hypothesized how Z could be used to estimate the stage shift as a result of breast cancer screening in LMICs.
Results
Stage shifts can be estimated by the proportional performance rates (Zs) using linear regression. Zs calculated for each screening round are highly associated with the observed stage shifts in the Nijmegen Screening Program (Pearson’s R: 0.798, R square: 0.637).
Conclusions
Our model can predict the stage shifts in the Nijmegen Screening Program, and could be applied to settings with different characteristics, although it should not be straightforwardly used to estimate the impact on mortality. Further research should investigate the extrapolation of our model to other settings. As stage shift is an essential screening performance indicator, our model could provide important information on the performance of breast cancer screening programmes that LMICs consider implementing.
Keywords
Introduction
Breast cancer is the most frequent cancer occurring in women in both high-income countries (HICs) and low- and middle-income countries (LMICs), and is a major public health problem. In 2008, breast cancer was responsible for about 485,000 deaths worldwide, and some 1.4 million new cases of breast cancer were diagnosed. The incidence and mortality rates of breast cancer are expected to rise in most LMICs in the coming years. 1
Early detection, followed by appropriate treatment, is currently the most effective strategy to reduce breast cancer mortality. 2 Mammography screening is widely used for early detection in HICs and is generally applied to women aged between 50 and 70. Although the benefits and harms of mammography screening are still being debated, the impact of mammography screening on breast cancer mortality in HICs seems to be about 20% to 30%.3–5
LMICs could also establish early detection strategies based on mammography screening or, perhaps, clinical breast examination (CBE) screening. 6 So far, however, the impact and practicability of screening strategies in LMICs is largely unknown due to a lack of cancer registries and experimental studies.6–9 In addition, extrapolating the impact of screening programmes from Western populations to populations in LMICs is not a straightforward process, due to the diversity in epidemiology, socio-cultural aspects, and the differences in the organization of health care systems.
While actions to control breast cancer seem essential in LMICs, it is not easy to make well-informed decisions on how to control the disease in these countries. We therefore propose a simple model to assess the performance of different modalities of breast cancer screening in LMICs, and possibly their further impact. The model estimates the shift in the proportion of early vs. late stage breast cancers (ie, stage shift), based on the expected performance rates in the screened population. Although the amount of stage shift cannot be straightforwardly linked to breast cancer mortality, it can be regarded as an important proxy for the performance of early detection programmes.8,10–16 Particularly in LMICs where the stage distribution of newly diagnosed breast cancer cases is often poor, the amount of stage shift is an essential performance indicator that could help LIMCs to decide on which breast cancer control programmes to implement.
The objective of this study was to provide a proof of concept for our model, to explain the model parameters and assumptions, and to provide an example of its application to an LMIC. Our model is based on data from the Nijmegen Screening Program 17 and established screening theories.18,19 The model can assess the stage shift related to mammography and CBE screening with different screening frequencies and age groups, relies on accessible data, 20 and could be easily adopted in LMICs. The model could provide important information for LMICs on the potential performance and further impact of a breast cancer screening programme.
Methods
Our model requires three steps to estimate the shift in the proportion of early vs. late stage breast cancers (ie. stage shift) related to mammography screening. Firstly, we calculate the proportional performance rates (ie. index number Z) based on observations from the Nijmegen Screening Program.17,21 Secondly, we assess the association of Z and the amount of stage shift observed in the Nijmegen Screening Program. Thirdly, we hypothesize how Z could be used to estimate the stage shift as a result of breast cancer screening in other countries.
Step one – calculating the detection rates and “Z”
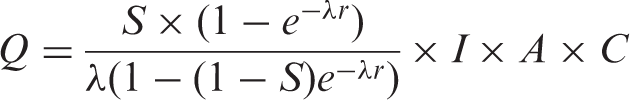
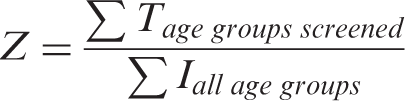
Age-specific proportional detection rates (5-year age groups) 18 are calculated, and used to calculate Z, a theoretical measure for the proportion of screen-detected breast cancers out of the total number of incident breast cancer cases per year (proportional performance rate) in a defined geographical area. We hypothesize that Z, which accounts for the local screening and population characteristics, can be used to estimate the stage shift, and can thus predict screening performance.
Mathematical framework
To calculate proportional performance rates, we used targeted age groups, age-specific incidence, frequency of screening, age-specific Mean Sojourn Times (MST), age-specific sensitivity of the test, age-specific attendance rates, and age-specific population. These parameters are explained in more detail below and in Appendix A, and relate to each other according to equations 1 through 4. These equations were adopted from Duffy et al. 18 and adjusted for the addition of the parameters attendance, coverage by invitation, and the fraction of prevalent screens (ie. A, C and ps) in equations 2 and 3. The summation of proportional performance rates of each 5-year age group will eventually result in a Z, (Equation 4).


Estimates of input parameters
Average age-specific parameters over 16 screening rounds (1975–2005).
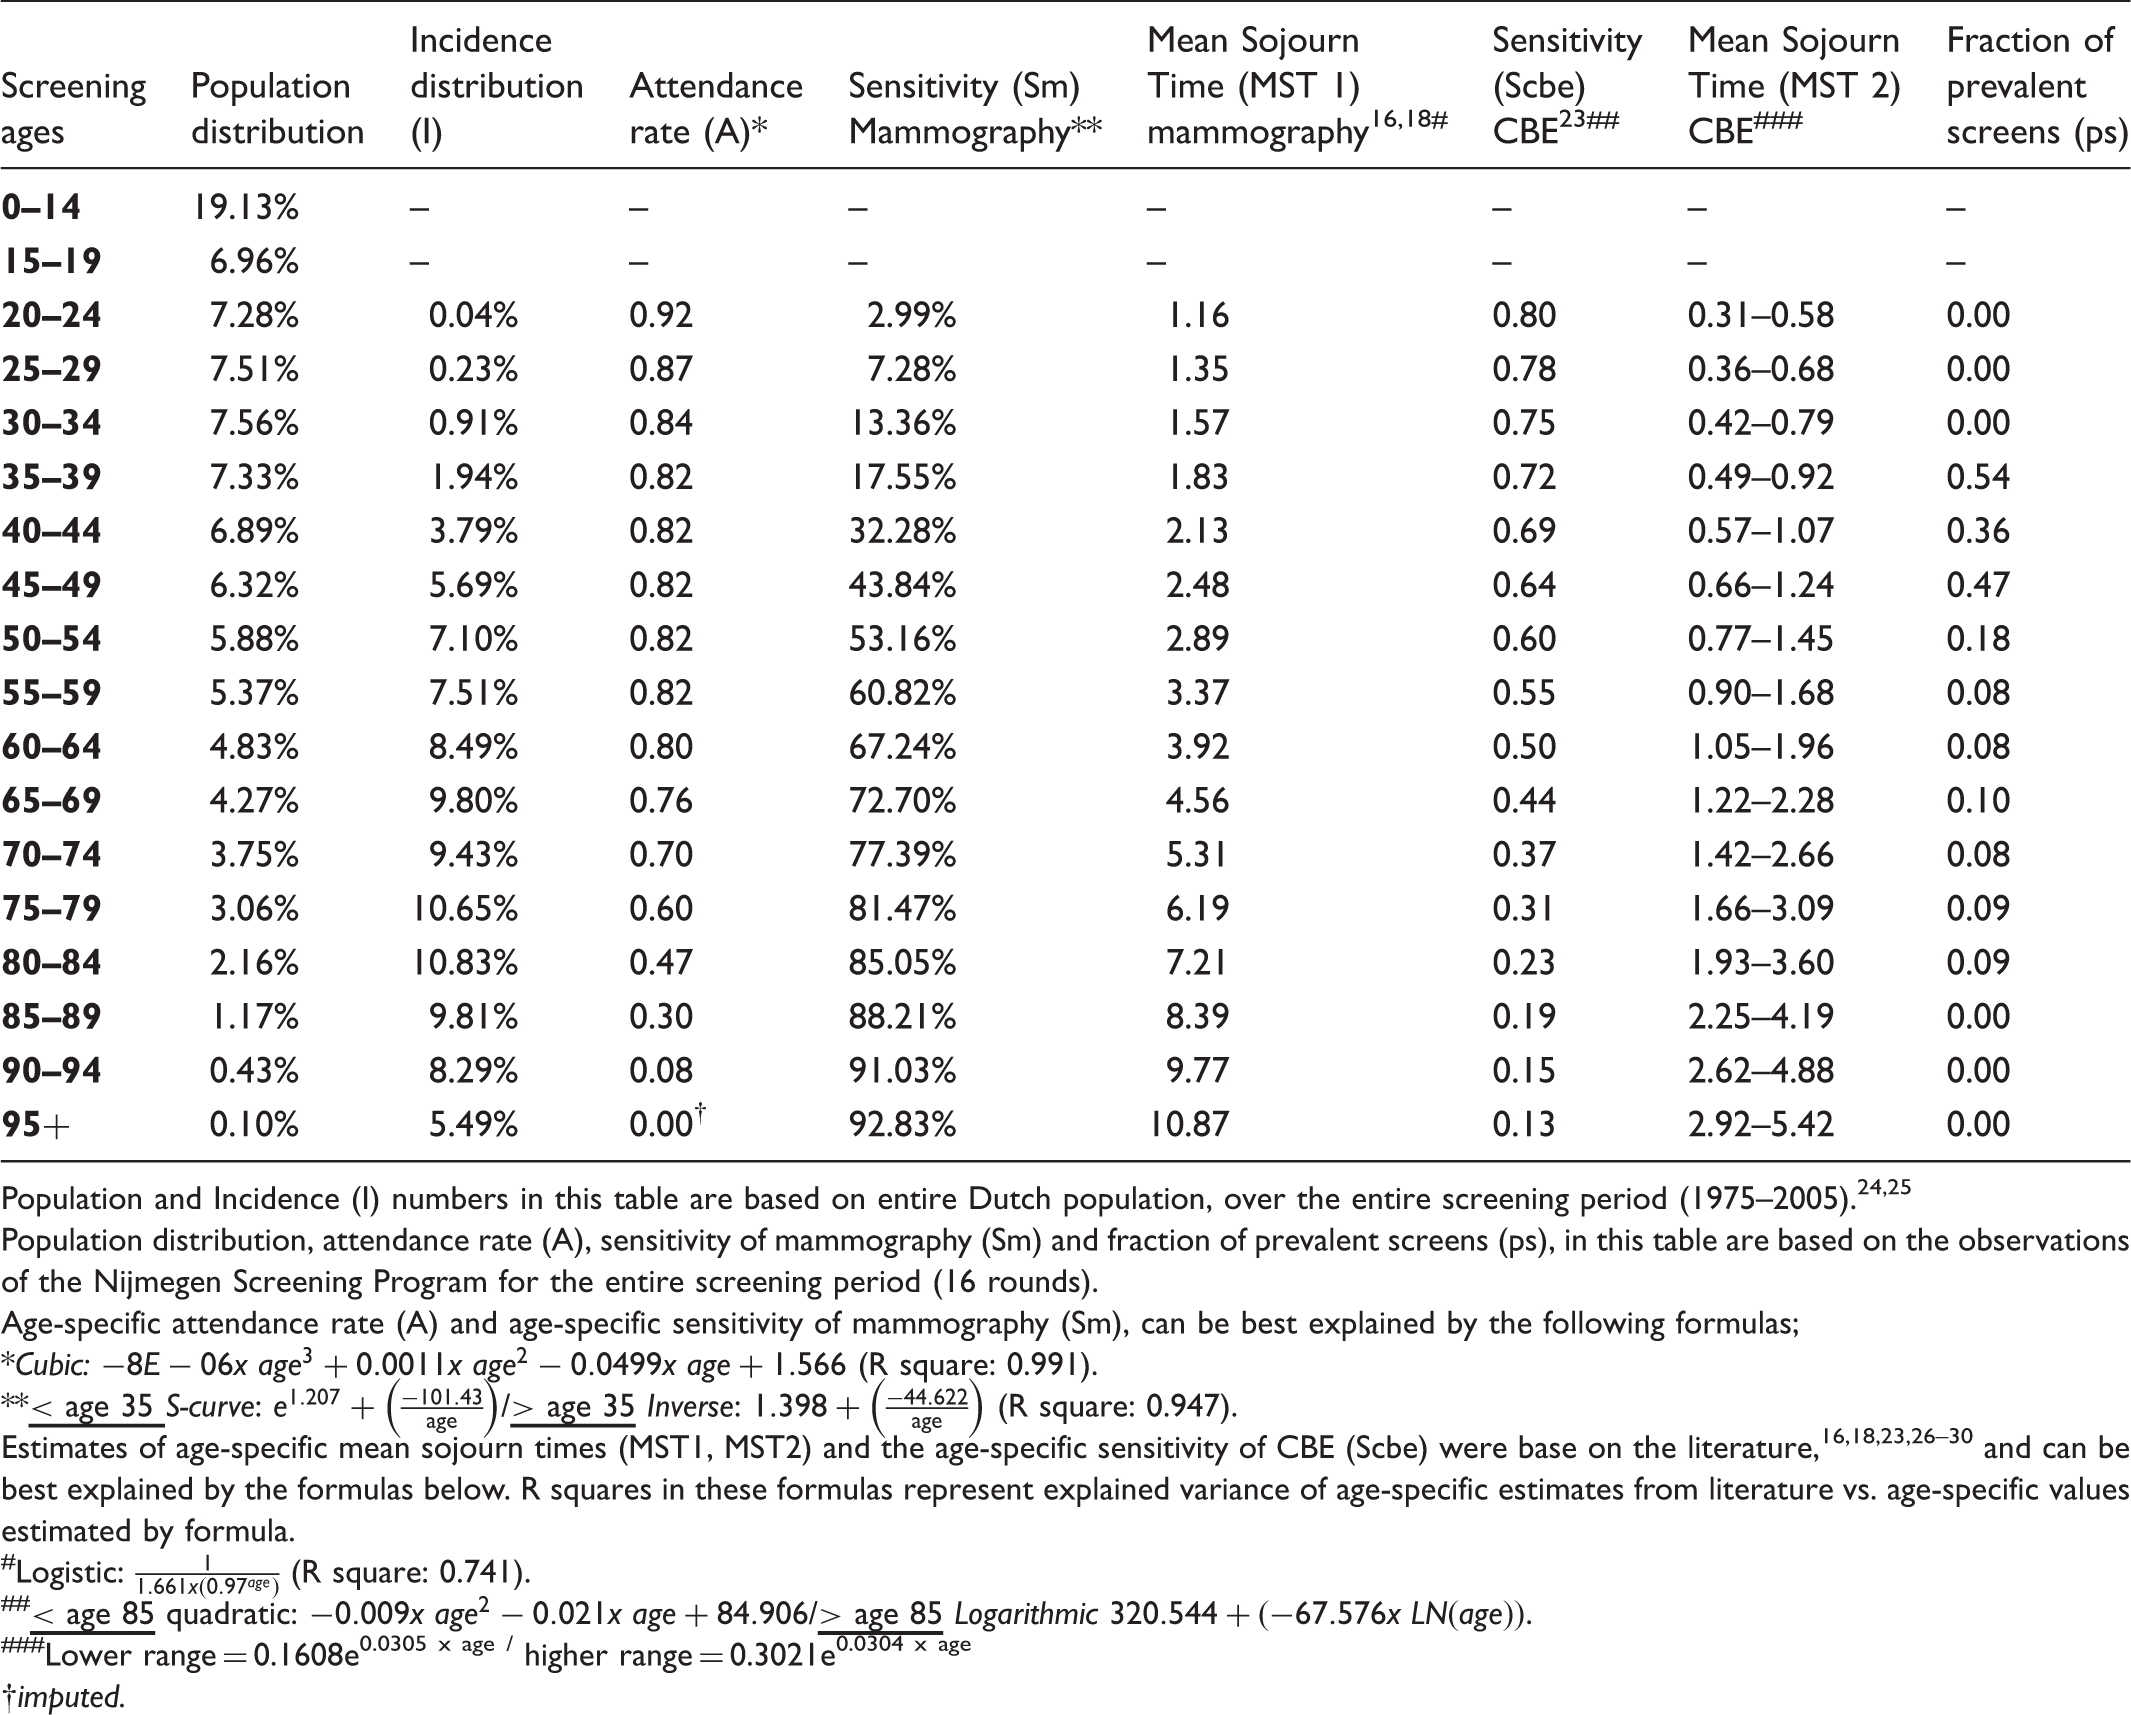
Population and Incidence (I) numbers in this table are based on entire Dutch population, over the entire screening period (1975–2005).24,25
Population distribution, attendance rate (A), sensitivity of mammography (Sm) and fraction of prevalent screens (ps), in this table are based on the observations of the Nijmegen Screening Program for the entire screening period (16 rounds).
Age-specific attendance rate (A) and age-specific sensitivity of mammography (Sm), can be best explained by the following formulas;
Cubic:
Estimates of age-specific mean sojourn times (MST1, MST2) and the age-specific sensitivity of CBE (Scbe) were base on the literature,16,18,23,26–30 and can be best explained by the formulas below. R squares in these formulas represent explained variance of age-specific estimates from literature vs. age-specific values estimated by formula.
Logistic:
Lower range = 0.1608e0.0305 x age / higher range = 0.3021e0.0304 x age
imputed.
Not all parameters could be derived from the Nijmegen Screening Program. The Mean Sojourn Ttimes (MST1, MST2) and the sensitivity of CBE screening (Scbe) were based on the international literature.16,18,23–28 Other unobserved parameters, such as the sensitivity of mammography (Sm) in age groups that were not included in the Nijmegen Screening Program, were derived from an assumed parameter distribution (Table 1). More detailed information on these parameters can be found in Appendix A. For the unobserved parameters that were predominantly based on the literature and were used in our model (MST1, Sm), we performed univariate sensitivity analyses.
Step two - relating the calculated Z with the shift in breast cancer stage distribution
The second step relates the calculated Z with the stage shift observed in the population of the Nijmegen Screening Program, using the American Joint Committee on Cancer definition of cancer stages. 29
Hypothesis on stage shift – equal Z’s, equal stage distributions
We hypothesize that the calculated Z is related to the magnitude of the stage shift. If this is so, Z can be used to estimate the potential stage shift of a breast cancer screening programme. Figure 1 illustrates a hypothetical example of a country where no screening is applied, and in which the current stage distribution is poor (about 25% of breast cancers detected in early stage [stages I and II]).
30
When breast cancer screening is implemented, a shift in stage distribution is expected, with more breast cancer patients presenting in the early stages I and II (85%), as in the experience from the Nijmegen Screening Program. The extent of this stage shift depends on the local screening and population characteristics, which are included in calculating Z.
Hypothetical stage shift assumptions. When Z1 and Z2 are equal, both screening programmes perform equally well and the stage distribution is expected to be the same.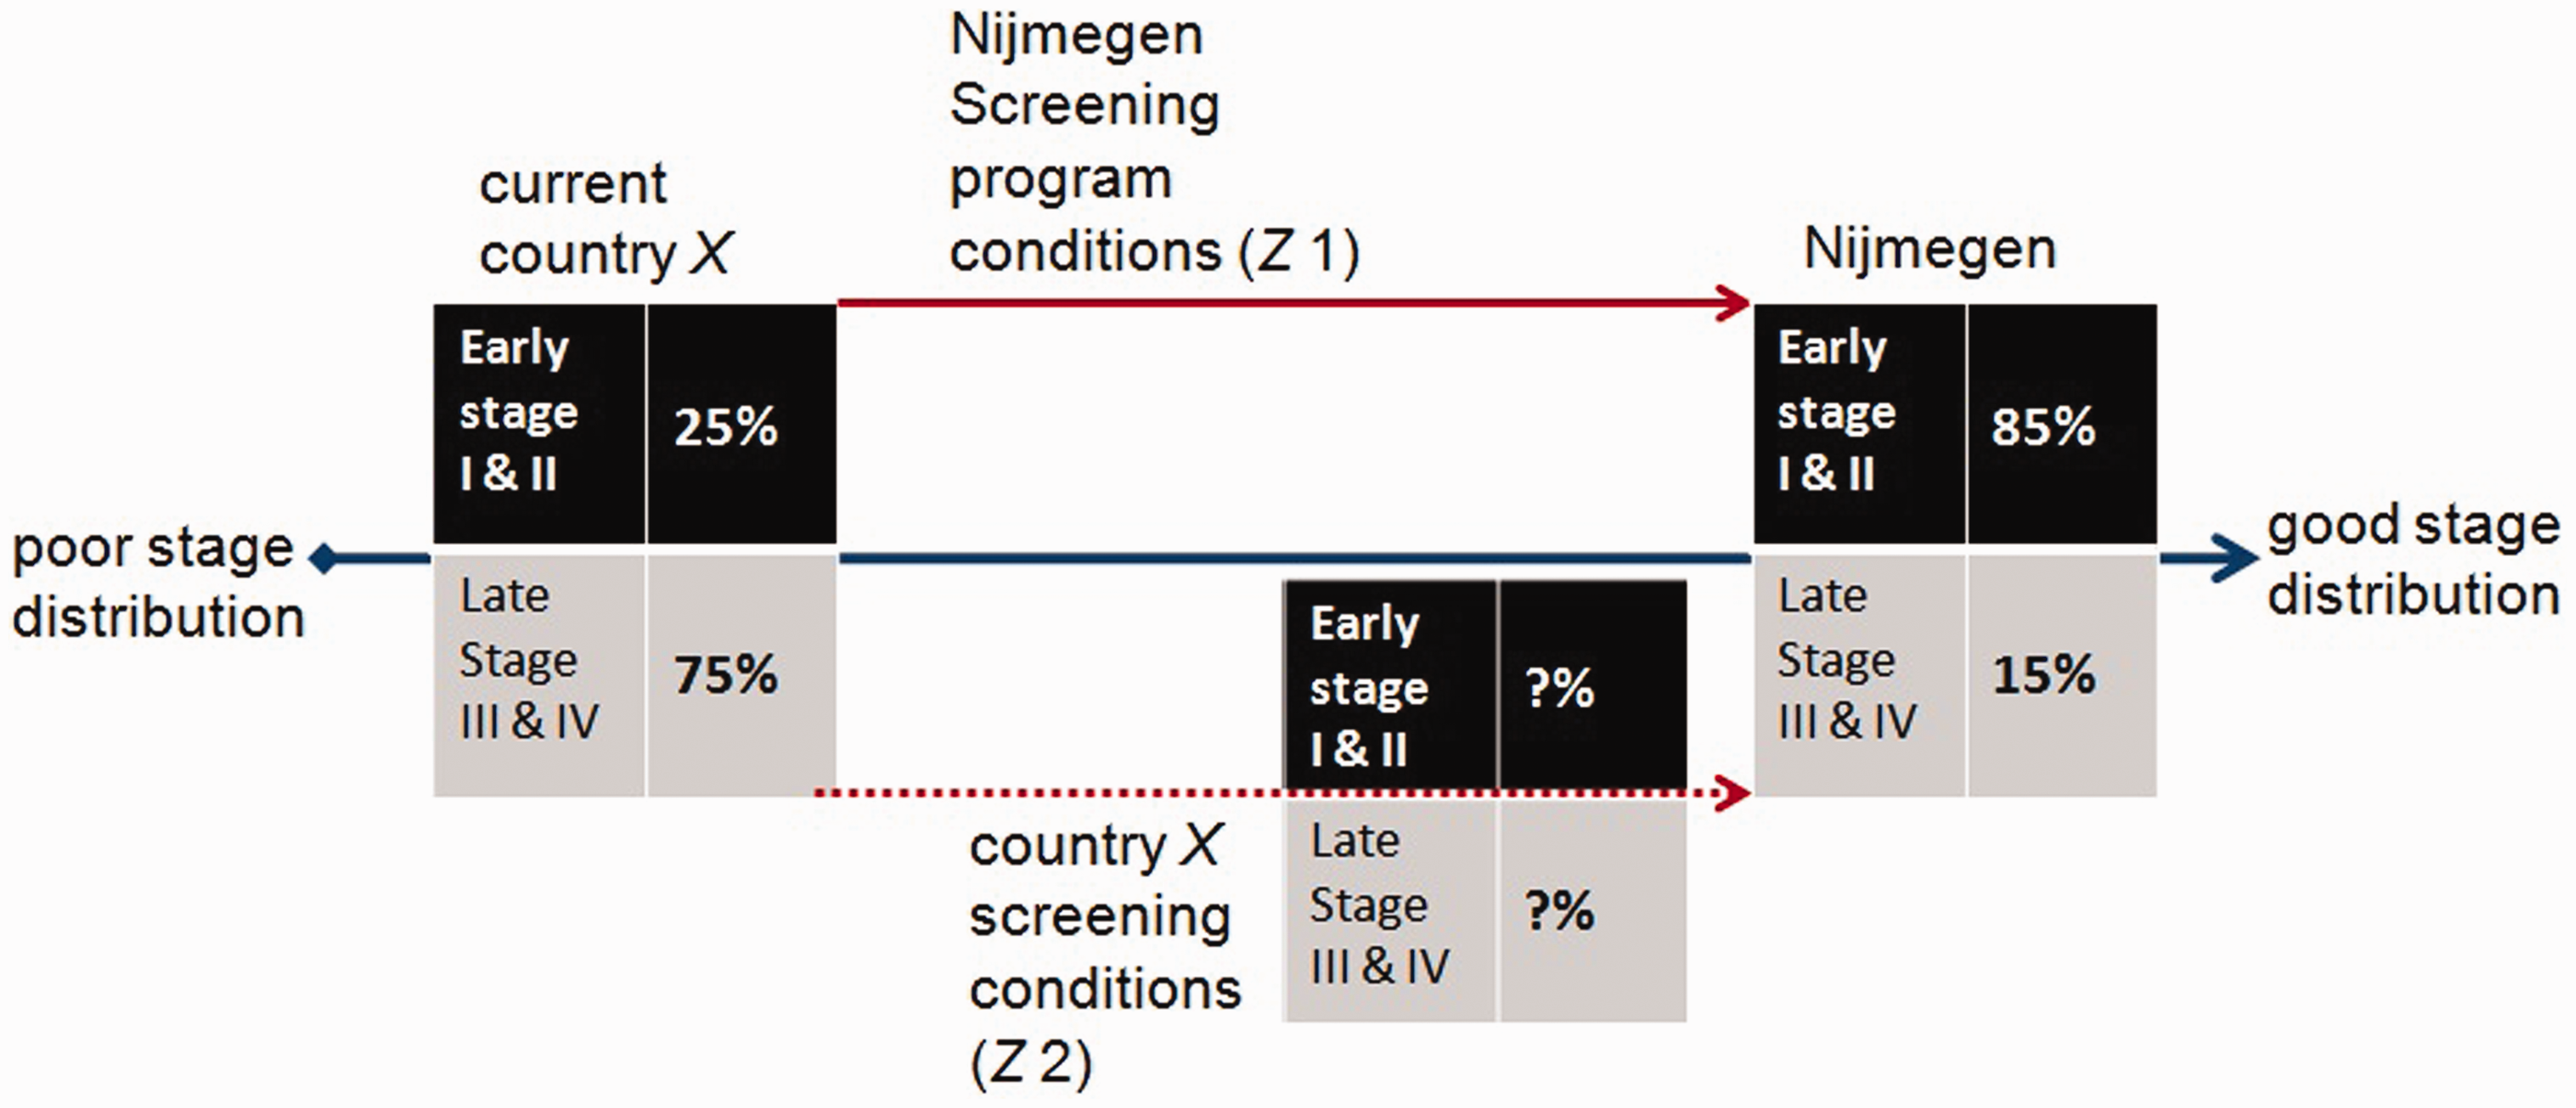
We hypothesize that a country with a Z equal (ie. equal proportional performance rates) to that in the Nijmegen Screening Program will arrive at the same stage distribution as observed in Nijmegen (ie. equal Z’s - equal stage distributions). By adjusting the screening and population characteristics corresponding to the country under evaluation, we can calculate the relevant Z, and hence the extent of stage shift in this country when screening is applied (Figure 1).
Linear regression
We hypothesize that Z is linearly associated with the shift in breast cancer stage distribution, and use linear regression to predict the proportion with early stage breast cancer in the population (y), with Z as a single predictor (ie. y = intercept + ß-coefficient * Z).
Step three – interpretation and use of regression coefficients
In step 3, the linear regression model is used, but the regression coefficients are adjusted according to the conditions of a particular LMIC, to estimate the stage shift for a given Z. Although we hypothesize that a country with a Z equal to that observed in the Nijmegen Screening Program will also have the same stage distribution as that observed in Nijmegen, the current stage distribution in a given country is likely to be different from the stage distribution at which the Nijmegen Program started. The current stage distribution is represented by the intercept of our regression model. The intercept of our regression model can vary by country, and we need to adjust the ß-coefficient according to these different intercepts. When the country has a Z equal to the Nijmegen Screening Program, the ß-coefficient should theoretically change to arrive at the same stage distribution. By changing the intercept (eg. based on the current stage distribution of a country) while leaving the stage distribution unchanged, we can estimate the adjusted ß-coefficient for that country.
Results
Step one – calculating the detection rates and “Z” of the Nijmegen Screening Program
Observed screening outcomes (1975–2005) of the biennial Nijmegen Screening Programme.
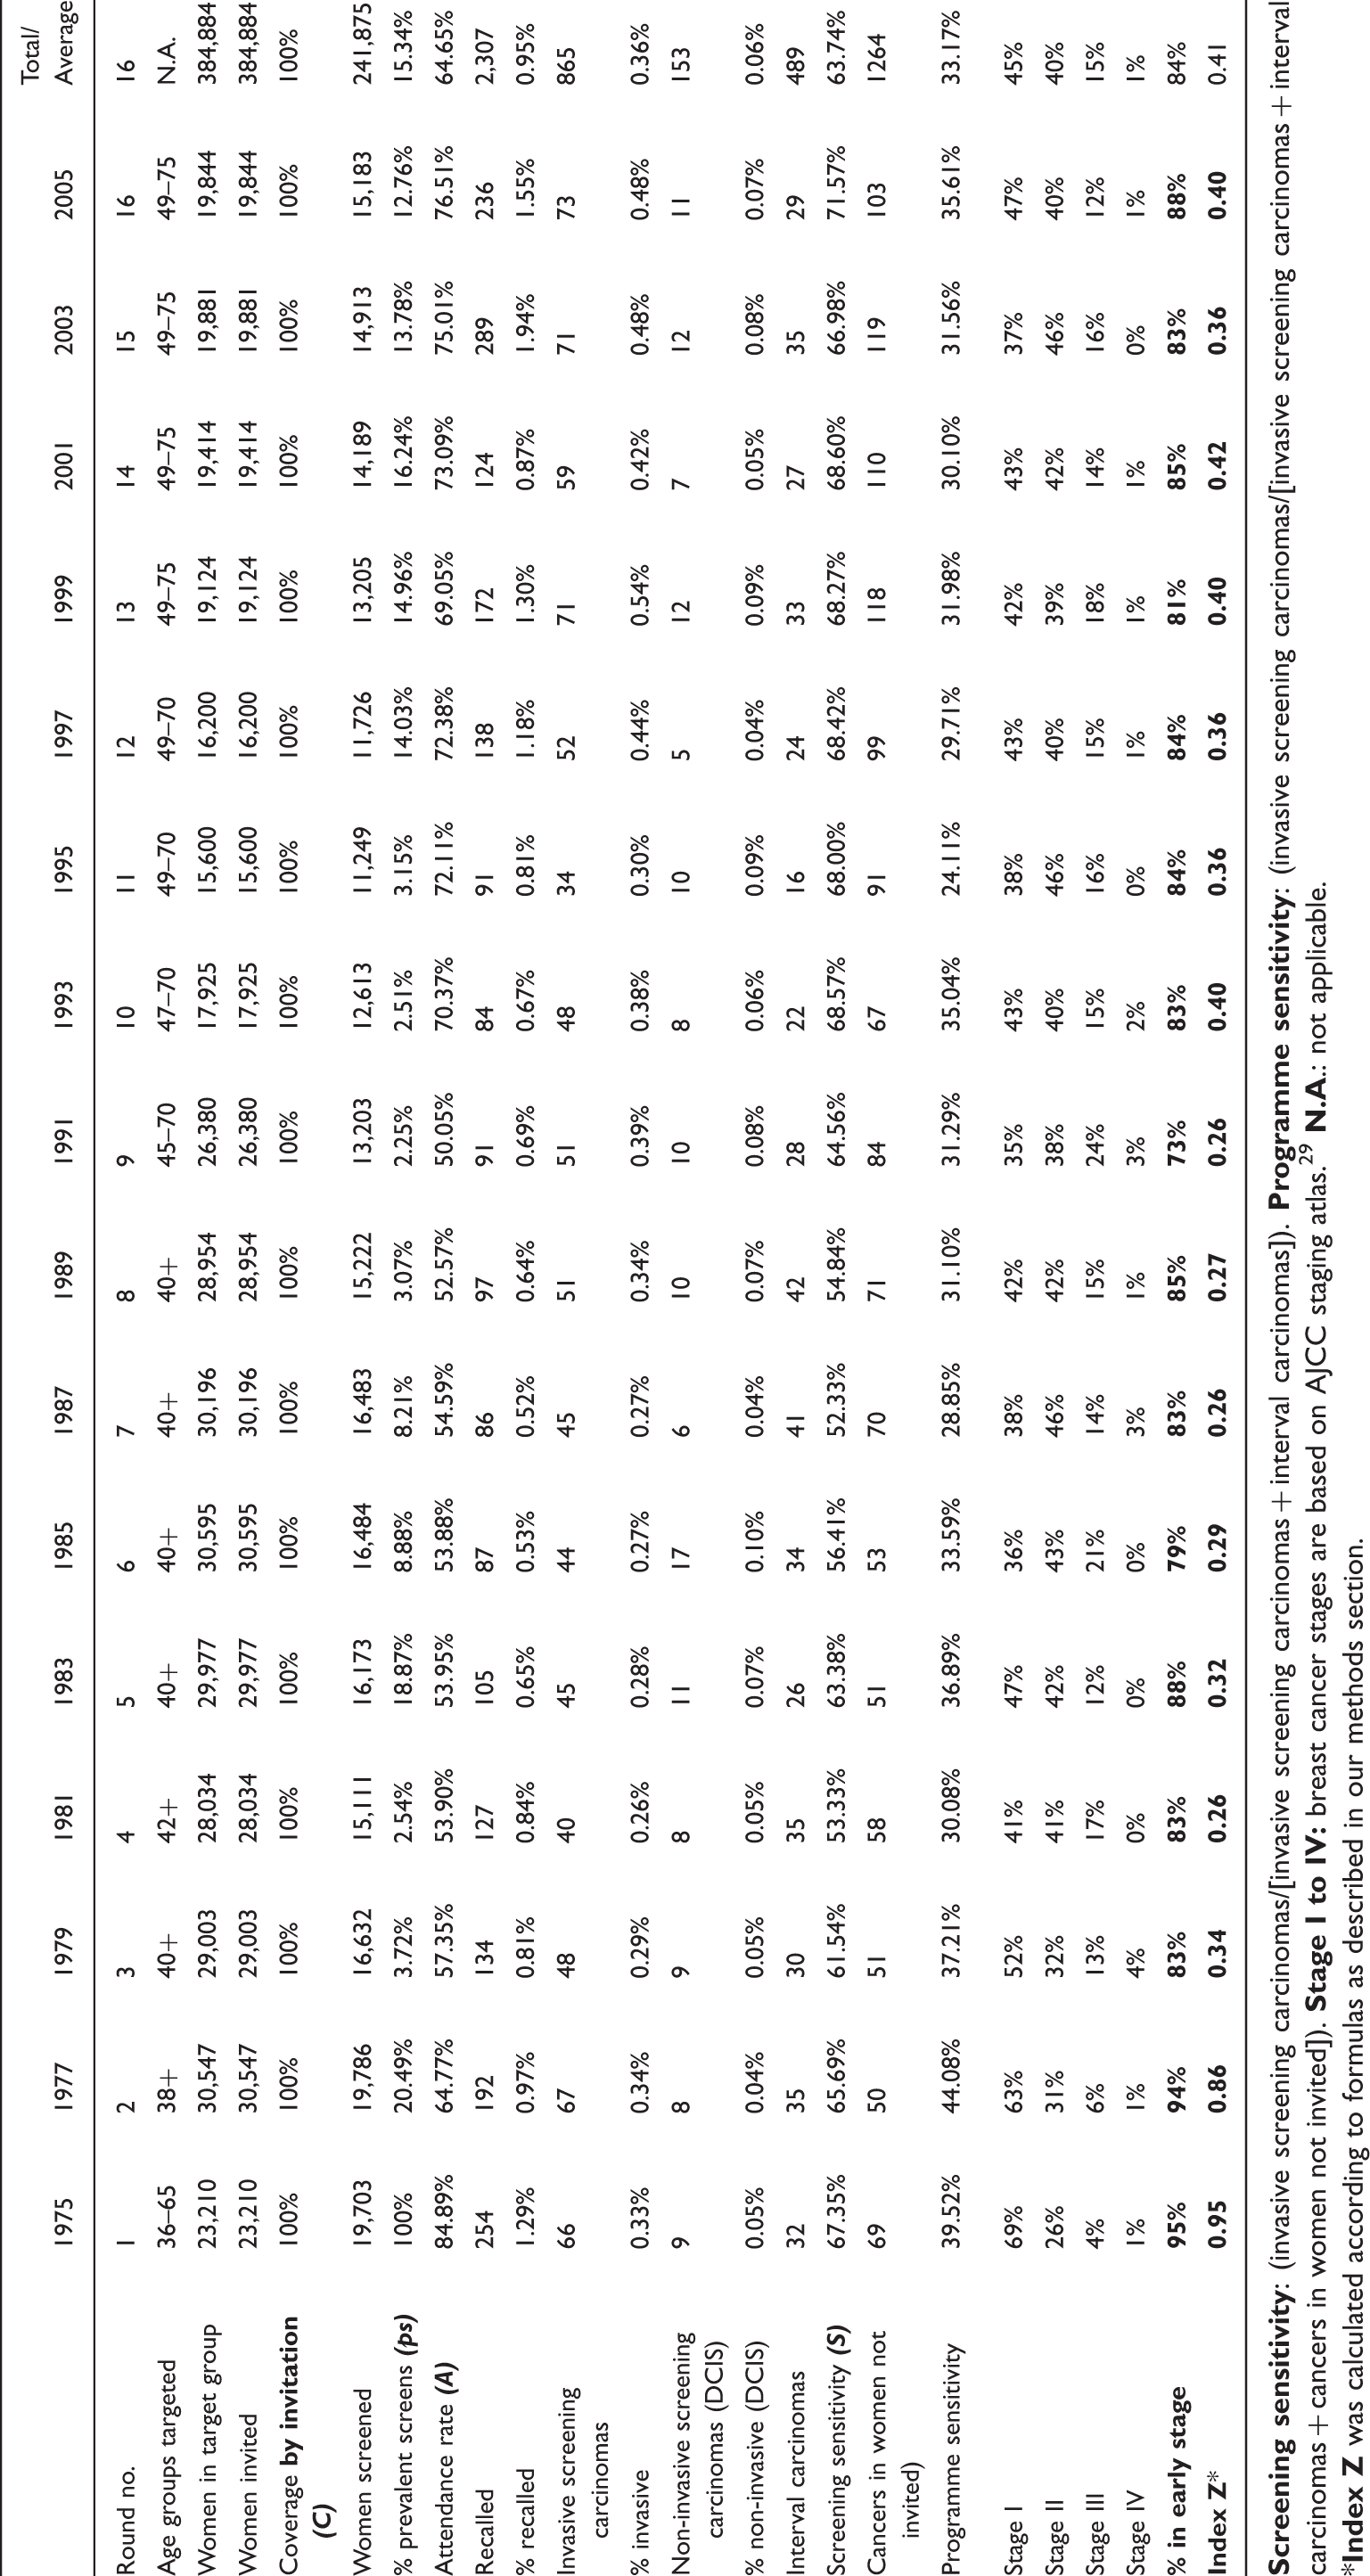
Table 2 shows the estimated Z’s per screening round in relation to the actual observed outcomes from the Nijmegen screening dataset. These Z’s equal the proportional performance rates (Equation 4 in the methods section) and were calculated using the observed age-specific outcomes from the Nijmegen screening dataset. The start of the screening programme in 1975 and 1977 is represented by high Z’s (99% and 67%, respectively) and high actual observed outcomes (95% and 93% in early stages, respectively).
Step two - relating the calculated Z with the shift in breast cancer stage distribution
The estimated Z’s start to decrease in 1979 and remain at the same level until 1993, with some fluctuations. The observed outcomes during this same period, however, remain relatively high, which indicates a low correlation between Z and observed outcomes during these screening rounds. Nevertheless, the overall linear correlation between the Z’s and the observed outcomes over the entire screening period (1975–2005) is significant (Pearson’s r = 0.798). The results of our simple linear regression model are visualized in Figure 2. Our selected model has an explained variance (R square) of 0.637 and can estimate the proportion of breast cancers early stage (y) using Z with the following equation: y = 0.761 + 0.202 * Z (p = 0.000).
Correlation of ‘Z’ and the percentage of early stage cases of screening rounds 1975–2005 and the corresponding regression function (values per round are presented in Table 2).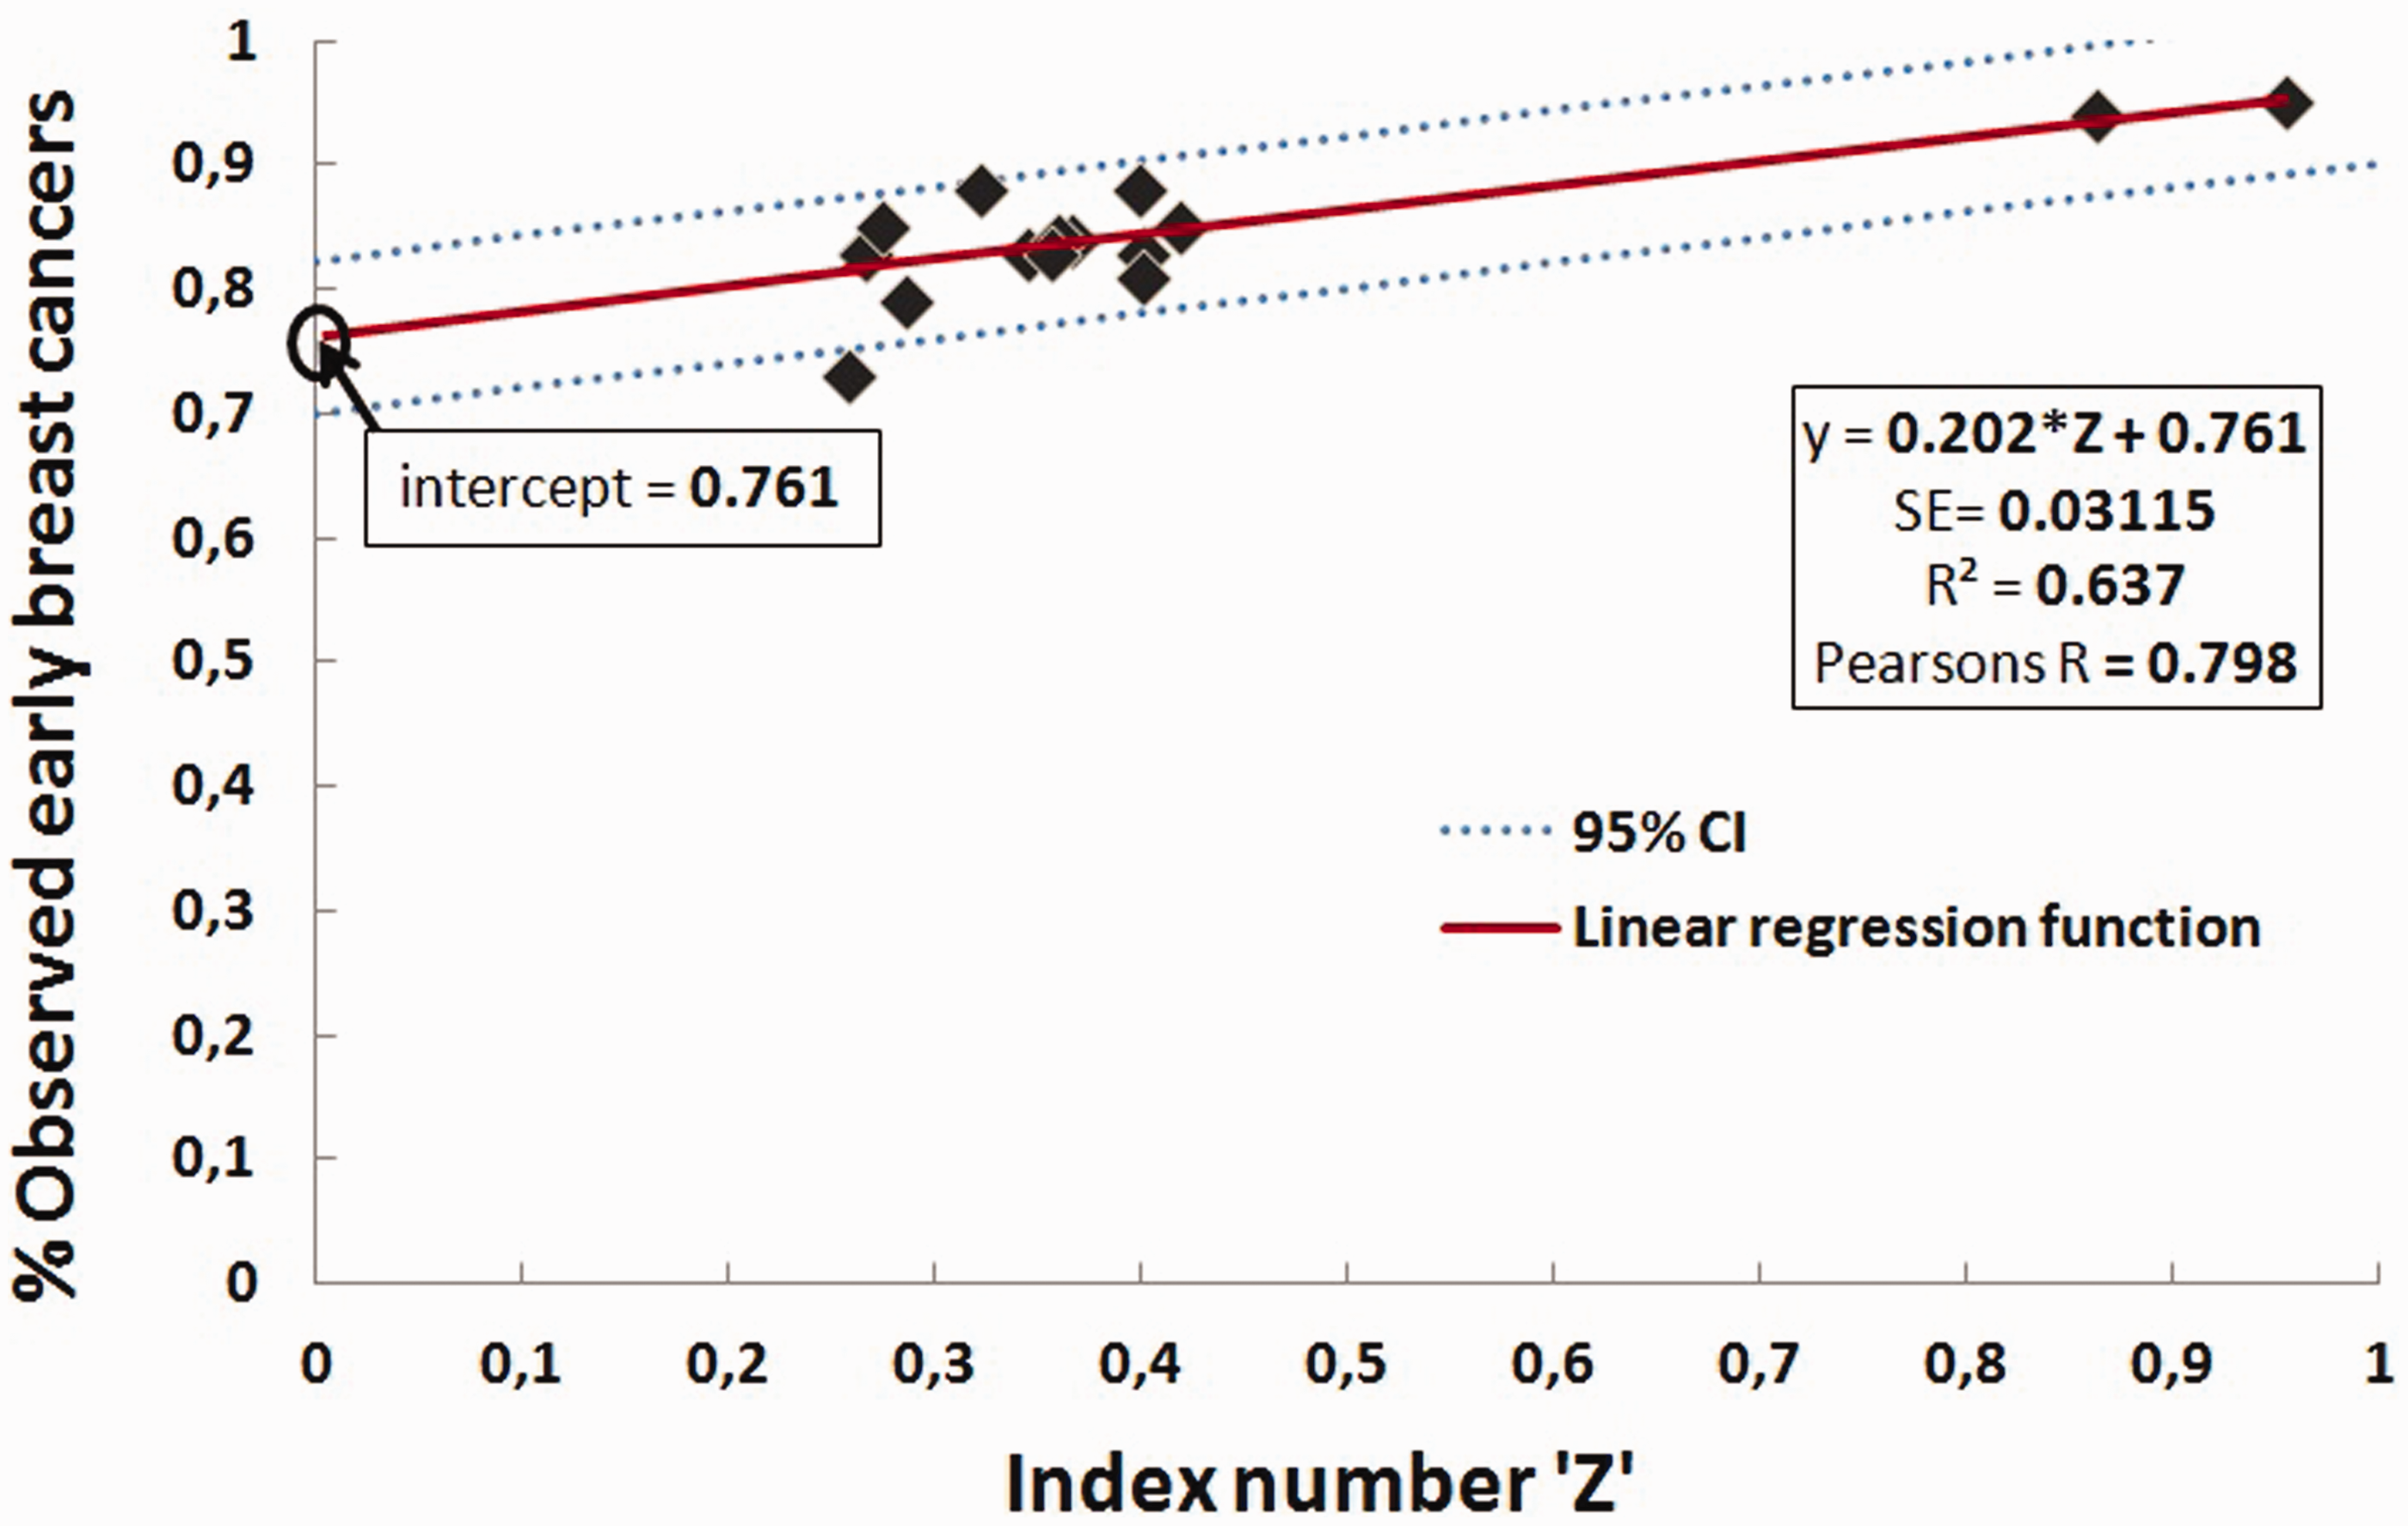
Step three – interpretation and use of regression coefficients
Regression coefficients under different starting conditions.
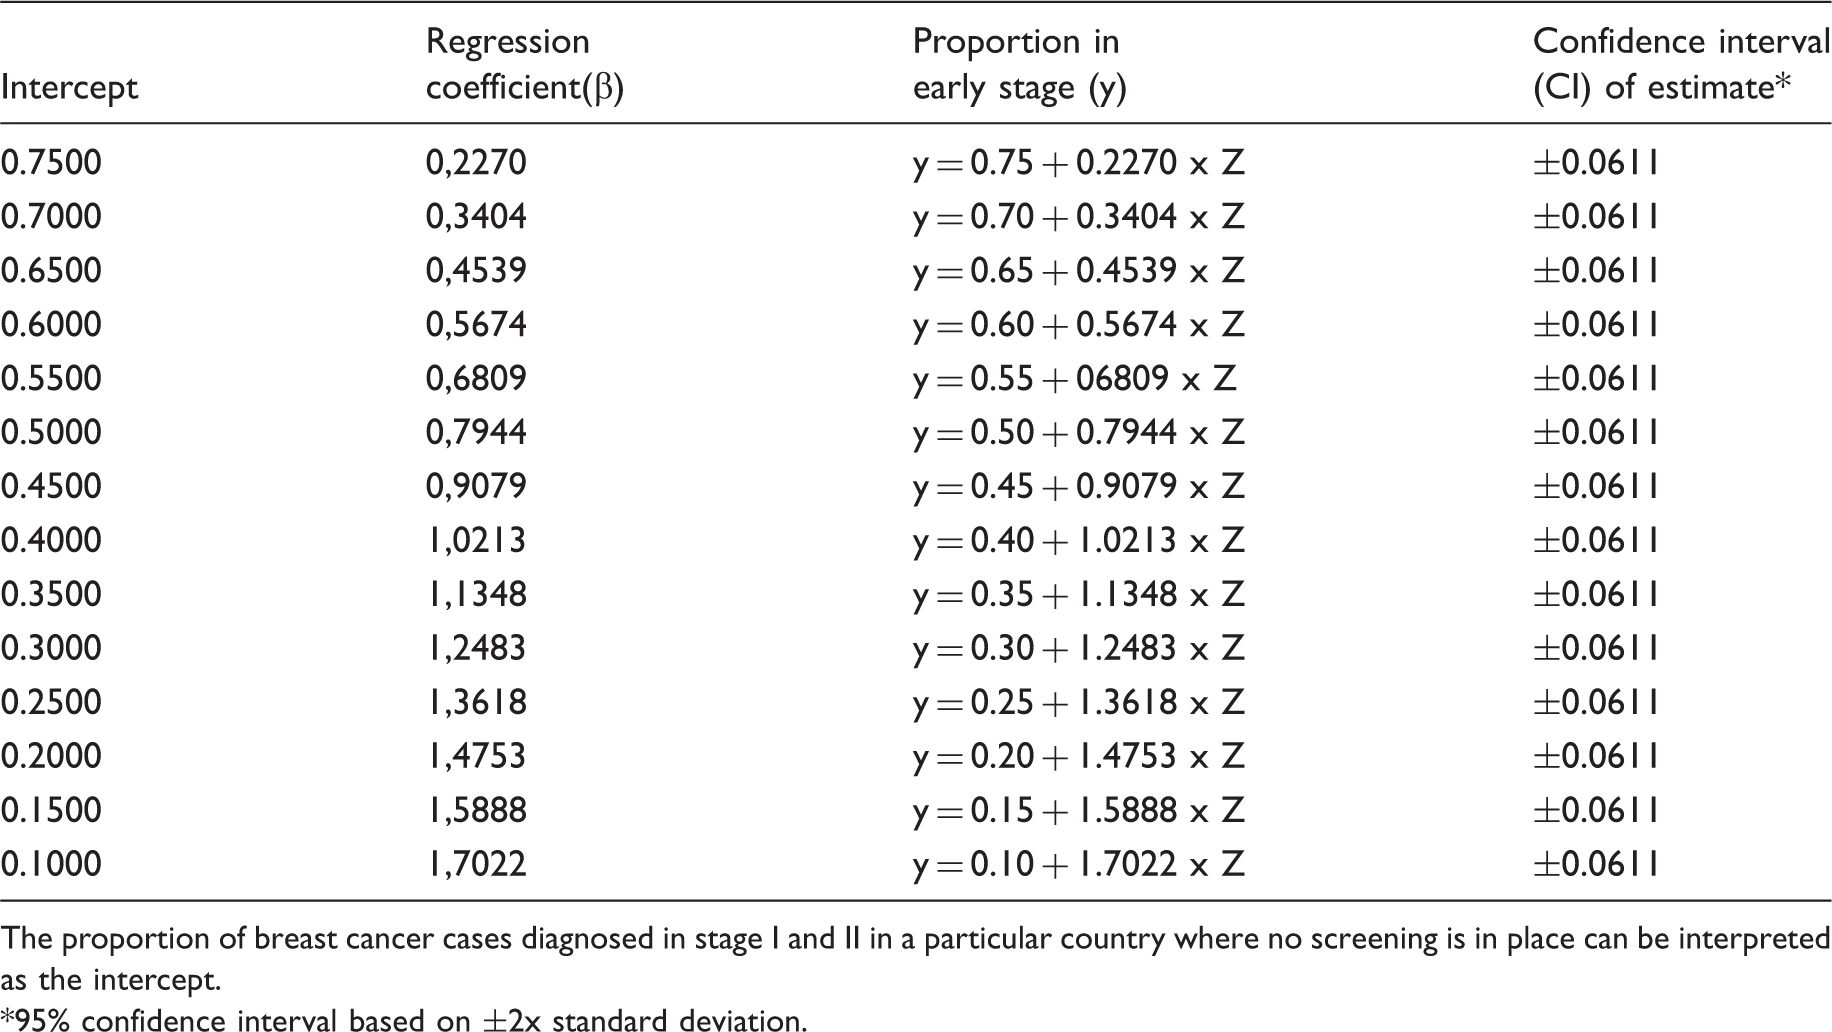
The proportion of breast cancer cases diagnosed in stage I and II in a particular country where no screening is in place can be interpreted as the intercept.
95% confidence interval based on ±2x standard deviation.
Application of our model, example Colombia
As a hypothetical example, the Ministry of Health (MoH) of Colombia, a middle-income country, is interested in providing an organized breast cancer screening programme as part of their national cancer control strategy. The country faces an increase of breast cancer incidence, with most women arriving in late stage (15%, 30%, 35%, 20% in stage I to IV respectively) having a vast impact on their budget for cancer treatment. The MoH would like to know the impact of two screening options, biennial mammography screening or biennial CBE screening programme, for women aged 40 to 65, in terms of stage shift, over a period of 10 years.
Step 1
Estimated index numbers (Z) for Colombia for (first two screening rounds only).
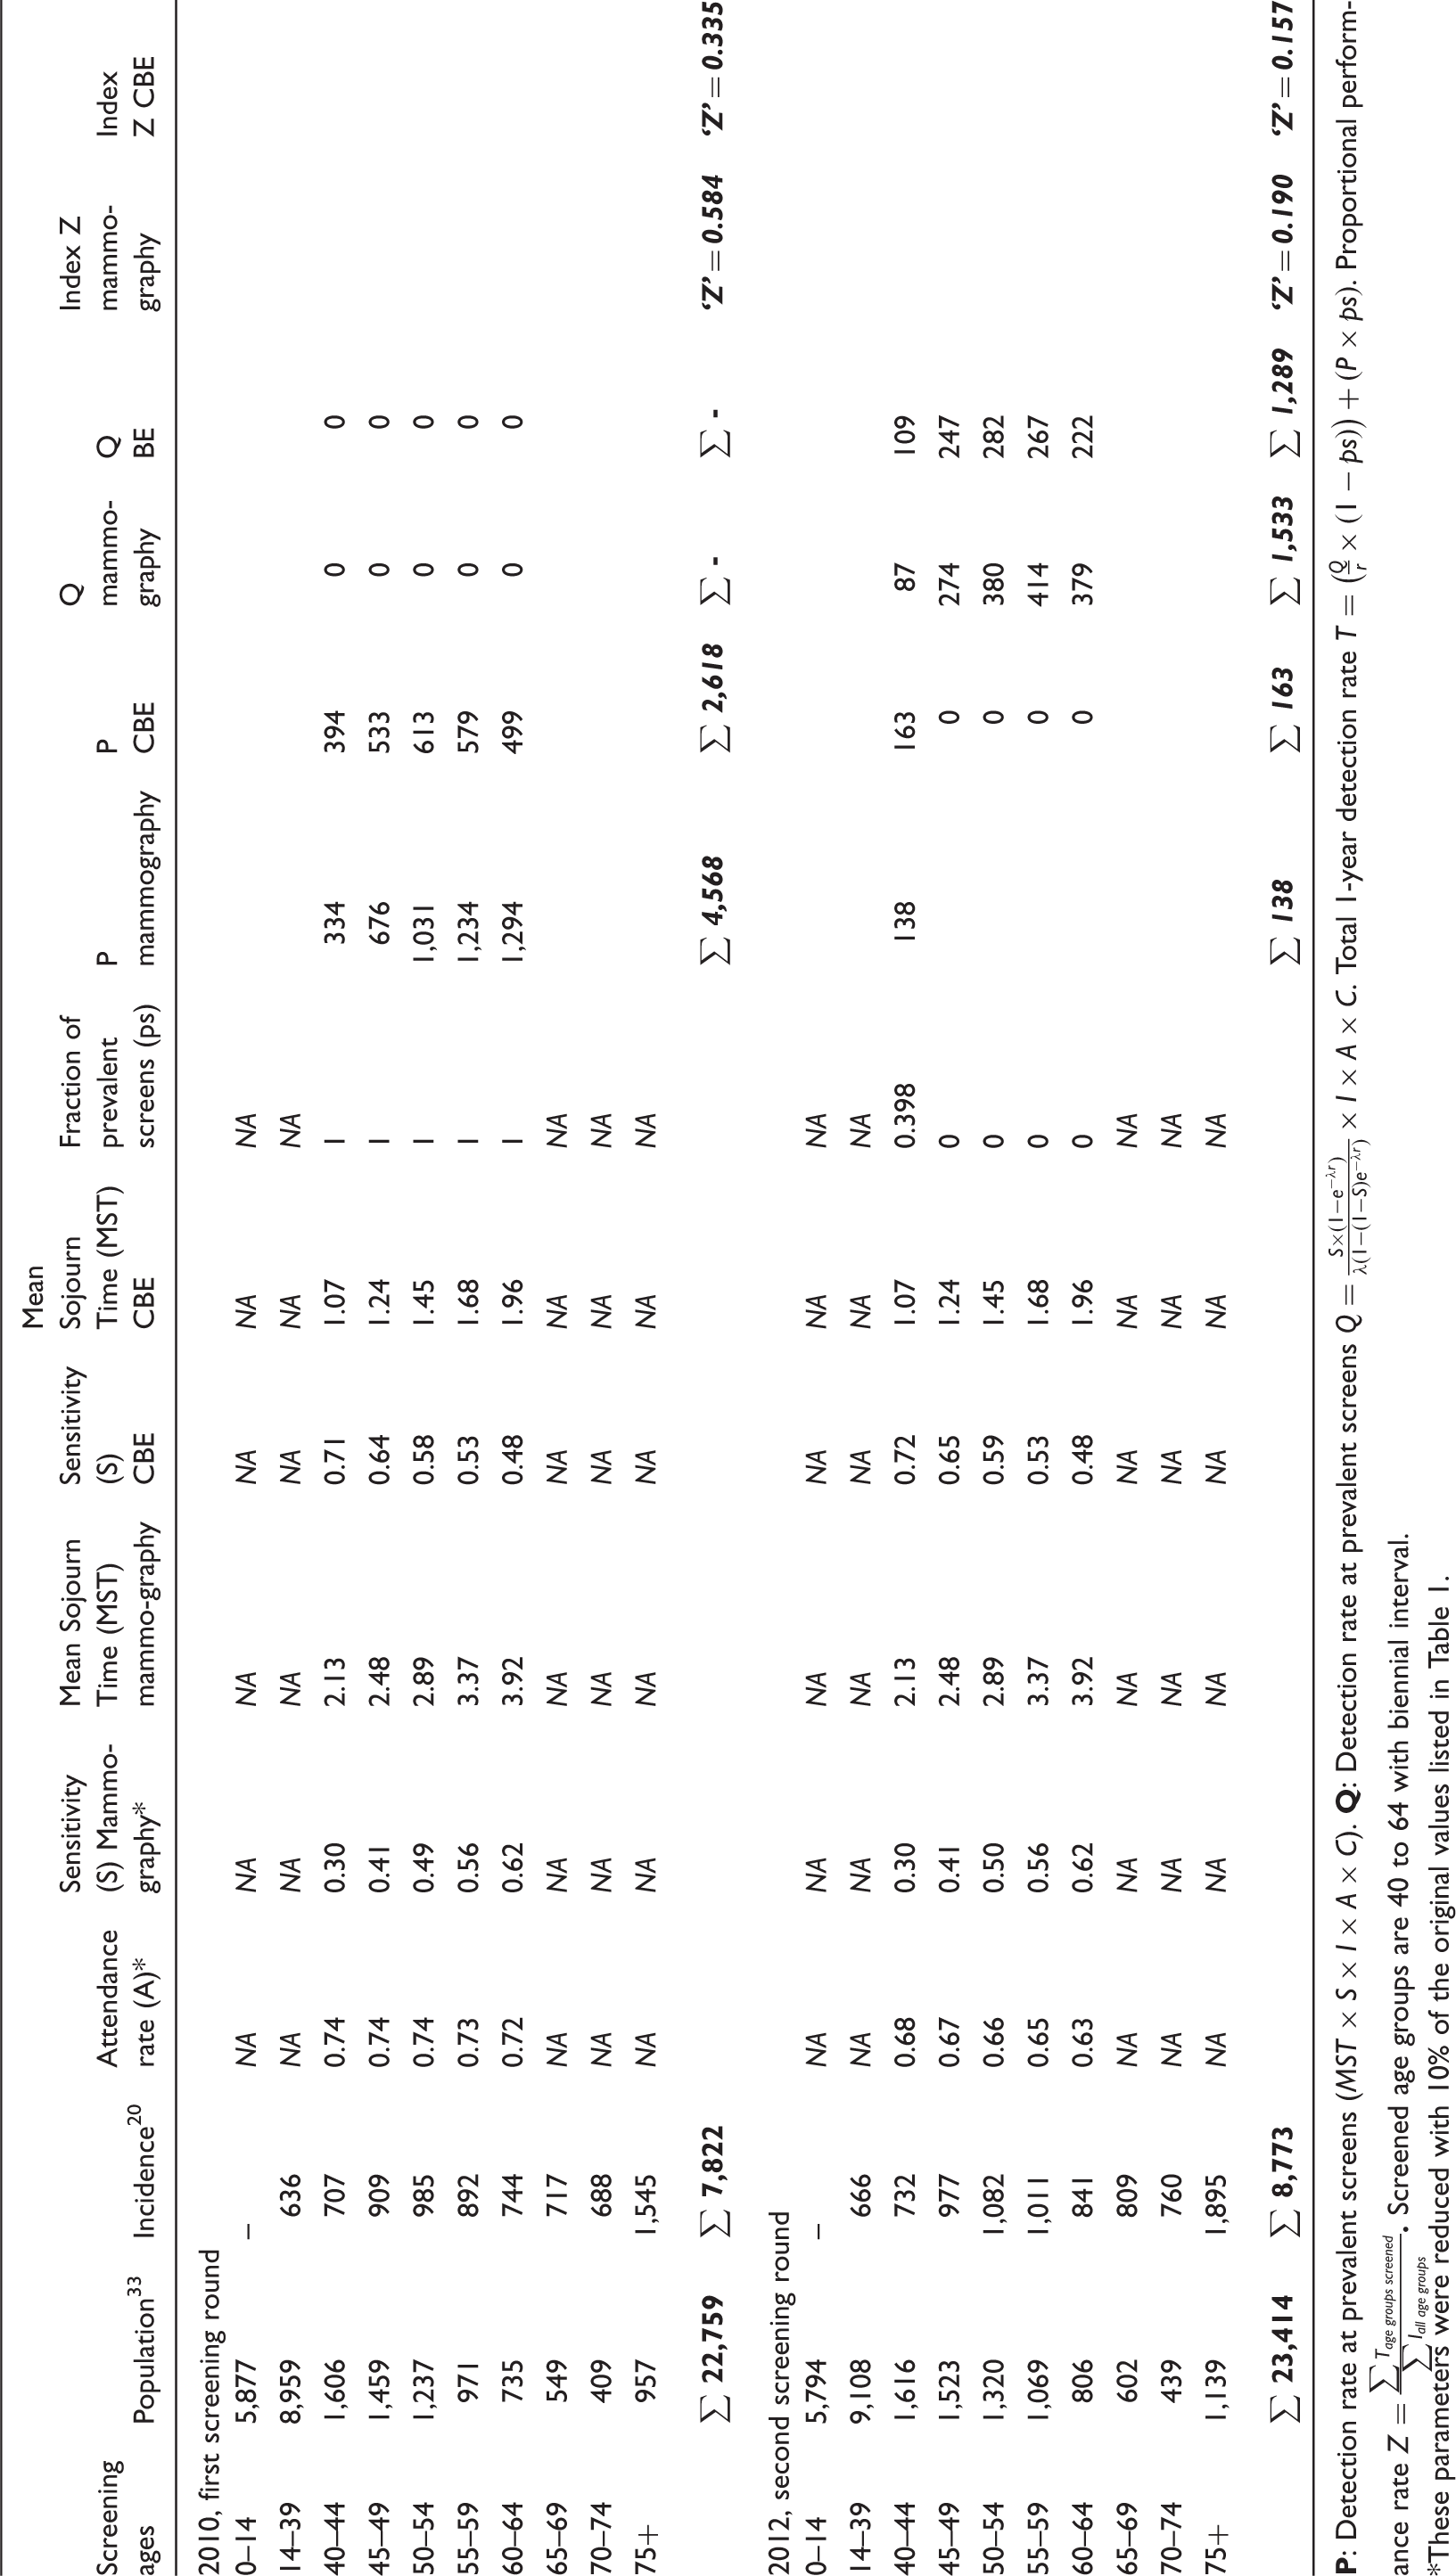
These parameters were reduced with 10% of the original values listed in Table 1.
Steps 2 and 3
Interpretation of index numbers (Z) using our proposed model for Colombia.
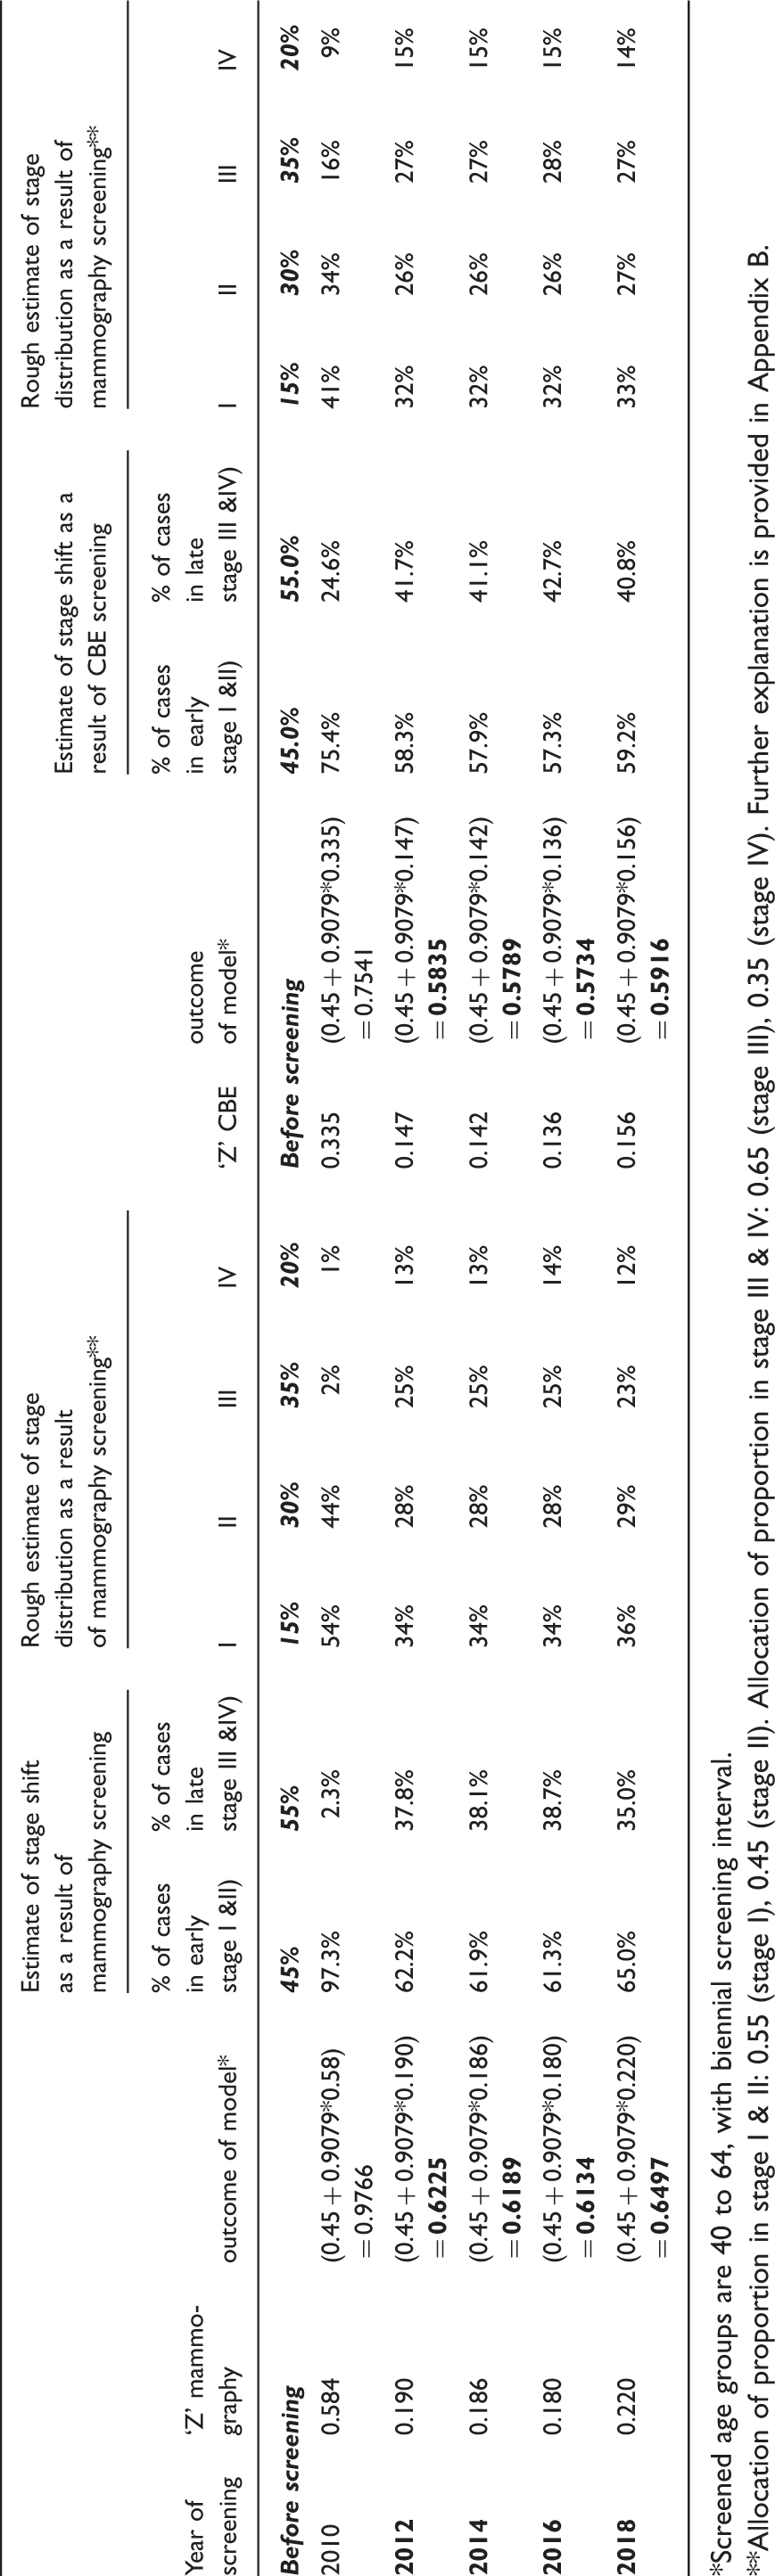
Screened age groups are 40 to 64, with biennial screening interval.
Allocation of proportion in stage I & II: 0.55 (stage I), 0.45 (stage II). Allocation of proportion in stage III & IV: 0.65 (stage III), 0.35 (stage IV). Further explanation is provided in Appendix B.
Sensitivity analysis on parameter assumptions
Whereas most of the parameters used in our proposed model are based on actual observations, we investigated different mathematical functions for our key unobserved parameters in the Nijmegen Screening Program. These unobserved parameters are the age-specific MST for mammography (MST1), and the sensitivity of mammography (Sm) in age groups that were not targeted by the programme (ie. under age 30 and above age 75). The overall impact of varying these functions on our regression model can be found in Appendix Table C1. When using a logistic or S-curve function for MST1 (model B, E and F), the explained variance (R square) of our regression model is relatively high. For sensitivity (Sm), a combined S-curve and inverse function (model F) results in the highest R square. In our selected model, we therefore used a logistic function for estimating MST1, and combined an S-curve and inverse function for estimating mammography sensitivity (Sm). Age-specific MSTs and sensitivity for CBE screening (MST2, Scbe), could not be analyzed in a sensitivity analysis because CBE screening is not part of the Nijmegen Screening Program, and therefore observations are lacking.
Discussion
We provide the first proof of concept for a model to estimate the potential impact of screening on the stage distribution of breast cancer. Our model is based on a comprehensive mathematical framework that employs important screening performance parameters. These parameters were, where possible, derived from observations from the Nijmegen Screening Program, comprising over 30 years of screening data (1975–2005) in various age groups. In this study, we propose a three step approach to assess the potential impact of biennial mammography screening on breast cancer stage shifts. This approach could also possibly be used to predict the stage shifts from CBE screening programmes, and mammography screening programmes with alternative screening frequencies and age groups, for which we provided an example (Colombia). Our model could provide important information on the possible performance of breast cancer screening programmes that may be considered by LMICs.
Our results confirm that our model can be used to estimate the stage shifts based on proportional performance rates (Z’s), using linear regression. Our regression model explains a high proportion of the variability in our data (R square: 0.637), and the observed stage shifts in the Nijmegen Screening Program are highly associated with the Z’s (Pearson’s R: 0.798). This provides a conceptual proof for the first two steps of our model, although these steps should also be confirmed in other countries with different screening datasets.
Based on the hypothesis that countries with screening programmes that perform equally well will have an equivalent stage distribution (equal Z’s - equal stage distributions), any country could use the regression model (step three). Theoretically, the regression coefficients of this model should be selected according to the current stage distribution of the country under study. However, whether our hypothesis (equal Z’s - equal stage distributions) can be accepted and, hence, whether it is valid to use step three of our model to extrapolate this regression model and use it for any country (external validity), is not proven by this study. Further research in other settings should be performed to verify this hypothesis.
Our model can also be used to assess the impact of CBE screening, as well as other low-cost screening modalities that might become available.9,32,33 However, although CBE screening trials are conducted in a number of LMICs (eg. India, Peru, and Vietnam15,28,34,35), these trials currently lack estimates on important screening outcomes. The estimated impact of CBE screening by our model should, therefore, be interpreted carefully. In our model, we based the mean sojourn time (MST2) of CBE screening on an exponential growth model, and assumed a range of preclinical- and clinical -detection sizes, but these preclinical- and clinical -detection sizes and growth models are still being debated.36–38 Also, the age-specific sensitivity of CBEs (Scbe) were adopted from Bobo et al. and corrected according to Sankaranarayanan et al.,25,28 and the findings from these studies cannot be generalized to CBEs performed in other settings. Despite these differences, our CBE sensitivity estimates have been used in other modelling studies, 39 and could initially be used to assess the impact of CBE screening in developing countries. Future research should investigate the MSTs and the sensitivity of CBEs and mammograms in LMICs.
Our model is based on the use of accessible data. Population registries exist in most LMICs, and population estimates could otherwise be obtained from other sources. 31 If appropriate cancer registries are lacking, LMICs could use GLOBOCAN estimates to acquire age-specific breast cancer incidence rates. 1 While the quality of GLOBOCAN information from most LMICs might not be highly reliable, this data is often the only relatively unbiased source of information available on the profile of cancer. As in our example in Colombia (Appendix B), LMICs could also assume different estimates based on their current stage distribution, sensitivity, or attendance rates, and adjust the age-specific estimates provided in this study (Table 2). Although LMICs could easily adopt our model and adapt the estimates we provide, we suggest that when our model is used different assumptions on these estimates should be addressed through uncertainty analyses.
Our study and model have some important limitations: First, although the Nijmegen Screening Program comprises data from over 30 years, our results are based on 16 screening rounds. This may affect the overall accuracy of our model (internal validity), and the inclusion of data from more screening rounds may improve our regression model.
Second, as mentioned previously, the Nijmegen Screening Program only includes a population screened by mammography with a biennial screening interval, and the extrapolation of our model to other settings (external validity) is not yet proven by this study. In addition, although there is no clear evidence of this, natural history parameters could differ in the breast cancer populations of LMICs. 40
Third, our model is based on average, age-specific parameters, and does not allow dynamic modelling or simulation of individual patients. Because we use averaged parameters, our estimates may be less precise compared with more advanced models. Nevertheless, advanced models rely on difficult mathematical approaches, and require advanced information at the expense of their usefulness for policy makers,39,41,42 and few of these models have been tested or applied in LMICs.
Fourth, not all factors relating to health care access are accounted for in our mathematical model. The insurance status, level of poverty, rate of obesity, and the method of detection could also affect screening performance,43,44 although these factors should be partly covered by selecting locally relevant attendance rates.
Fifth, our model does not provide much more insight on the harms and benefits of screening (eg. impact on mortality, over-diagnosis, survival, false positives), 3 and can only be used for estimating stage distributions. An improved stage distribution can be the result of diagnosing additional stage I cancers, but does not necessarily mean a reduction of the absolute numbers of stage III-IV cancers or, correspondingly, a reduction of mortality from the disease. Higher proportions of breast cancers detected in the early stages are not straightforwardly linked to higher levels of averted breast cancer mortality. Moreover, if early detection is not followed by appropriate treatment, which could often be the case in LMICs, the indirect impact of screening on breast cancer mortality would also decrease. The impact of screening on breast cancer mortality should therefore not (directly) be assessed through our proposed model, specifically in LMICs where appropriate breast cancer treatment could be lacking. Despite this, estimating the stage distribution as a result of screening is helpful for the selection of early detection programmes, as the amount of stage shift is a useful performance indicator for a screening programme. This information could be of particular interest for LMIC’s, where stage distributions are often poor, the continuum of early detection, treatment and follow-up services is not always available, and hence the eventual impact of screening on breast cancer mortality is difficult to estimate.
Sixth, whether a proposed screening programme is beneficial to a particular country cannot be based entirely on the outcomes of our model (ie. the estimated stage shift). Multiple criteria, including effectiveness, budget impact, cost-effectiveness, safety, accessibility of disadvantaged populations, or other equity considerations, are often considered in deciding this. 45 The trade-off between, for example, the costs and effects of the proposed screening programme depends on the willingness to pay for a unit of effect (eg. QALY/DALY) of a country, and on the available budget. Previous experiences indicate that the budget for controlling breast cancer may increase two- or three-fold due to a screening programme. The effectiveness, however, will increase between zero- and five-fold, dependent on the current stage distribution of a particular country. 46 Our model can be used to support this discussion, by estimating the potential stage shift of a proposed programme so the potential costs or effects of this programme can be estimated. The interpretation of the amount of stage shift as a result of breast cancer screening is, therefore, not straightforward, though we believe that 60% of breast cancer cases in early stage should nominally be obtained through a breast cancer screening programme.
The above limitations fit within our aim to provide broad indications on the performance and potential impact of different screening options in LMICs, rather than providing very precise estimates.
Conclusion
We have developed a three step model to estimate the potential impact of screening on the stage shift of breast cancer. Our results show that our model can be used to estimate the stage shifts of the Nijmegen Screening Program, and provide proof of concept that it could, theoretically, be adapted to other settings with different characteristics. This is a promising and important step, although further research should investigate the extrapolation of our model to other settings and investigate the assumptions used in our parameters.
Footnotes
Acknowledgements
We thank the MISCAN group of the department of public health, Erasmus Medical Centre, Rotterdam, for providing assistance with the theoretical concepts of our research, Erik Brummelkamp (data manager of the Nijmegen Screening Program), who formatted the data for this study, the Susan G. Komen for the Cure foundation for their indirect financial support, and Hans Bor and Reinier Akkermans for their advice on statistics.
References
Supplementary Material
Please find the following supplemental material available below.
For Open Access articles published under a Creative Commons License, all supplemental material carries the same license as the article it is associated with.
For non-Open Access articles published, all supplemental material carries a non-exclusive license, and permission requests for re-use of supplemental material or any part of supplemental material shall be sent directly to the copyright owner as specified in the copyright notice associated with the article.