
Abstract
Objectives
In addition to invasive breast cancer, mammography screening often detects preinvasive ductal carcinoma in situ (DCIS) lesions. The natural progression of DCIS is largely unknown, leading to uncertainty regarding treatment. The natural history of invasive breast cancer has been studied using screening data. DCIS modeling is more complicated because lesions might progress to clinical DCIS, preclinical invasive cancer, or may also regress to a state undetectable by screening. We have here developed a Markov model for DCIS progression, building on the established invasive breast cancer model.
Methods
We present formulas for the probability of DCIS detection by time since last screening under a Markov model of DCIS progression. Progression rates were estimated by maximum likelihood estimation using BreastScreen Norway data from 1995–2002 for 336,533 women (including 399 DCIS cases) aged 50–69. As DCIS incidence varies by age, county, and mammography modality (digital vs. analog film), a Poisson regression approach was used to align the input data.
Results
Estimated mean sojourn time in preclinical, screening-detectable DCIS phase was 3.1 years (95% confidence interval: 1.3, 7.6) with a screening sensitivity of 60% (95% confidence interval: 32%, 93%). No DCIS was estimated to be non-progressive.
Conclusion
Most preclinical DCIS lesions progress or regress with a moderate sojourn time in the screening-detectable phase. While DCIS mean sojourn time could be deduced from DCIS data, any estimate of preclinical DCIS progressing to invasive breast cancer must include data on invasive cancers to avoid strong, probably unrealistic, assumptions.
Introduction
Breast cancer is the most prevalent women’s cancer worldwide, 1 with early detection by mammography screening being a common health service. In addition to invasive breast cancers, mammography screening detects preinvasive ductal carcinoma in situ (DCIS) lesions.2,3 DCIS detection by mammography screening varies, typically constituting 10–25% of all mammography detected lesions. 4 The natural progression of DCIS is largely unknown and optimal treatment is uncertain. 5 In practice, treatment of screen-detected DCIS is usually similar to that of invasive cancer, to avoid progression to invasive breast cancer.2,6 While DCIS detection might contribute to reduced breast cancer mortality,7–9 it may also result in substantial overdiagnosis and overtreatment. 10
Ultimately, results from ongoing randomized active surveillance trials of low-grade DCIS might provide information about optimal DCIS treatments, but the trials are hampered by slow recruitment.11,12 DCIS progression models based on screening data report varying results.13–16 These variations might be partly due to a wide range of modeling assumptions. We here propose a new DCIS natural history model without complex model assumptions, to study the basic DCIS progression paths.
Methods
Population and data
Between 1995 and 2004, the Norwegian government initiated a population-based breast cancer screening program, 17 BreastScreen Norway, organized by the Cancer Registry of Norway. BreastScreen Norway started with analog film-based mammography before they gradually changed to digital mammography between 2000 and 2011. Under BreastScreen Norway all women aged 50–69 received a written invitation biennially. Two view screening mammograms were independently evaluated by two readers. At initial screening until 2002, the program collected questionnaires on time since the last mammogram before entering the program (Table 1). We used these questionnaire data from 1995–2002 with varying time since previous mammography, combined with the corresponding screening results, to estimate DCIS progression. During this period, 78% of invited women attended screening, resulting in 364,731 being screened. Among them, 333,304 answered a question about former mammography experience. Of these 333,304 women, DCIS was detected in 399 women.. Time since the last mammography was categorized as 0–1, 1–3, 3–5, or 5+ years (Table 2). As numeric values were needed for the estimation, 0.67, 2, 4, and 6.5 years were chosen as representative points for each interval, as shown in Weedon-Fekjær et al. 18
Description of the applied BreastScreen Norway data.
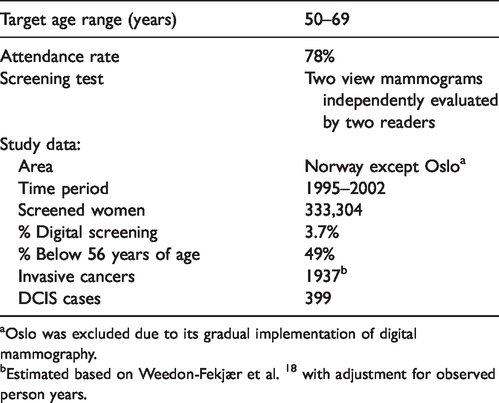
Oslo was excluded due to its gradual implementation of digital mammography.
Estimated based on Weedon-Fekjær et al. 18 with adjustment for observed person years.
Norwegian DCIS detection at screening by time since last mammogram.
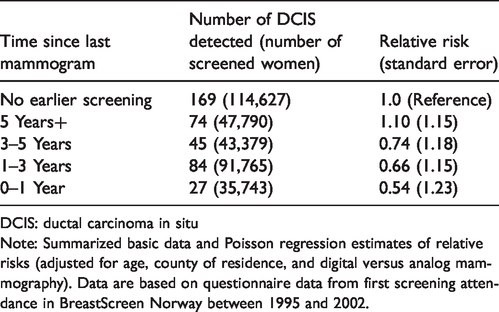
DCIS: ductal carcinoma in situ
Note: Summarized basic data and Poisson regression estimates of relative risks (adjusted for age, county of residence, and digital versus analog mammography). Data are based on questionnaire data from first screening attendance in BreastScreen Norway between 1995 and 2002.
Natural progression of DCIS and its arrest by screening
As DCIS natural progression is not directly observable, it is studied indirectly using detection rates from repeated mammography. If DCIS progression is slower, with a long sojourn time in the screening-detectable phase, a larger drop in detection rate from initial to subsequent screenings is expected, as many potential cases at subsequent screening have already been detected at the initial screening. At subsequent screening examinations, there will be a combination of new cases, who have progressed to the screening-detectable phase since the previous examination, and old cases overlooked at previous screenings. In practice, the reservoir of overlooked DCIS cases with a longer sojourn time will gradually decline by screening round. Hence, a lower DCIS detection rate will give a larger drop from second to third screening, as fewer earlier overlooked DCIS cases will be available for each added screening round. Overall, the relative DCIS frequencies for subsequent screening rounds contain important information about DCIS progression and screening test sensitivity. While ordinary screening programs have fixed time intervals between screening examinations, our Norwegian questionnaire data, with varying intervals between screening examinations, are especially suited for evaluating models of DCIS progression.
A DCIS progression model
For invasive cancer progression, Markov models are often used to estimate the time tumors spend in the mammography-detectable phase.19–21 DCIS progression models become more complicated, as preclinical screening-detectable DCIS lesions might progress to clinical DCIS, preclinical invasive breast cancer, or possibly regress to a state not visible on later mammograms. To avoid limiting the potential natural history pathways, our initial model includes all three potential progression pathways in addition to some non-progressive DCIS (Figure 1). However, if some of these progression options are not present, its estimated probability would tend to zero. In practice, this could guide an exclusion of some progression paths.
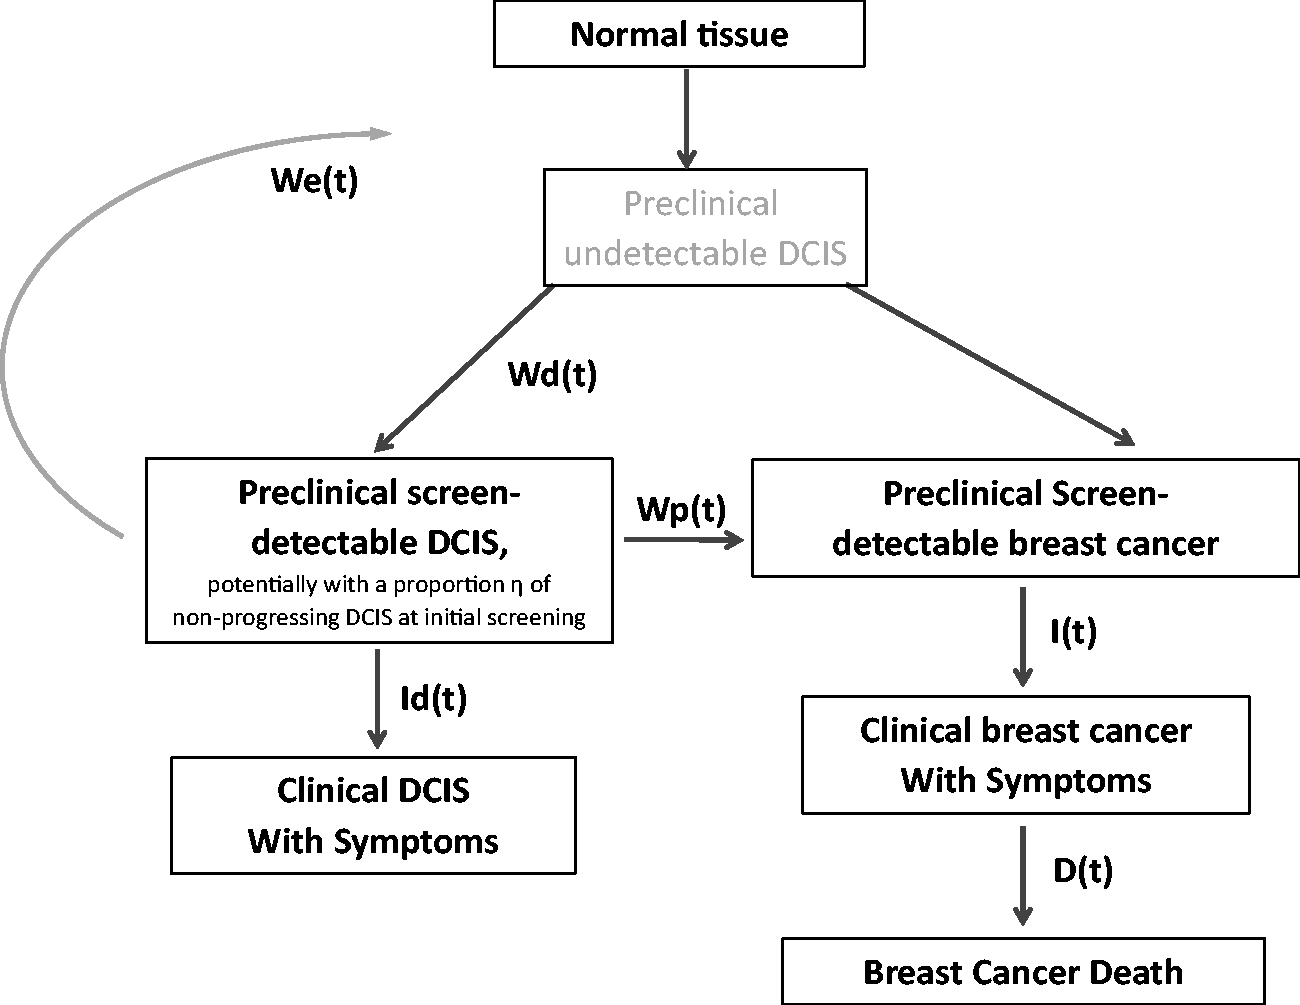
Model of DCIS (ductal carcinoma in situ) progression. Given the limited mortality in the study’s age range, other cause mortality was not modelled. We have assumed that all invasive cancers go through an undetectable DCIS phase, but this is not a key modeling assumption as progression in and out of this phase is not estimated.
Formulas for estimating mean sojourn time and screening sensitivity (assuming only progressive tumors)
Markov models characterize cancer progression by modeling the sojourn time in the preclinical screening-detectable phase.19,22,23 For invasive breast cancer, a constant progression rate by time, equaling exponentially distributed sojourn times, has given a good model fit.19,21,22 Assuming a (locally) stable disease model, the rate leaving the preclinical screening-detectable phase equals the rate of entering the preclinical screening-detectable phase. Given a mean sojourn time of
Given a mean sojourn time of 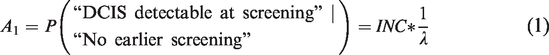
With a screening test sensitivity of 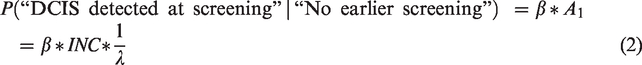
At second screening, the pool of screening-detectable DCIS is a sum of (i) earlier overlooked DCIS cases still in preclinical screening-detectable phase and (ii) new preclinical DCIS cases which have entered the screening-detectable phase after initial screening. Following the exponential distribution, 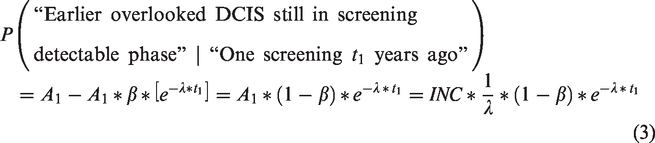
Assuming a locally stable disease model, the probability of a preclinical screening-detectable DCIS is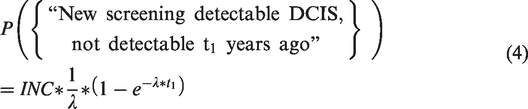
Hence, putting equations (2) and (3) together, the probability of being in the preclinical screening-detectable DCIS phase at second screening, 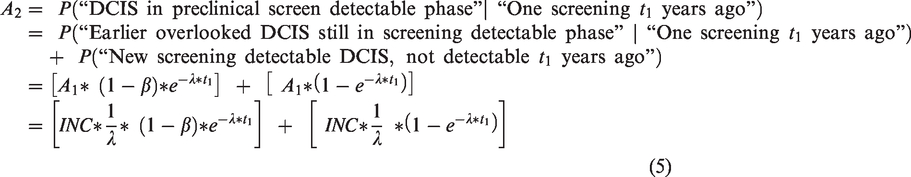
Thus, the probability of DCIS detection at second screening becomes
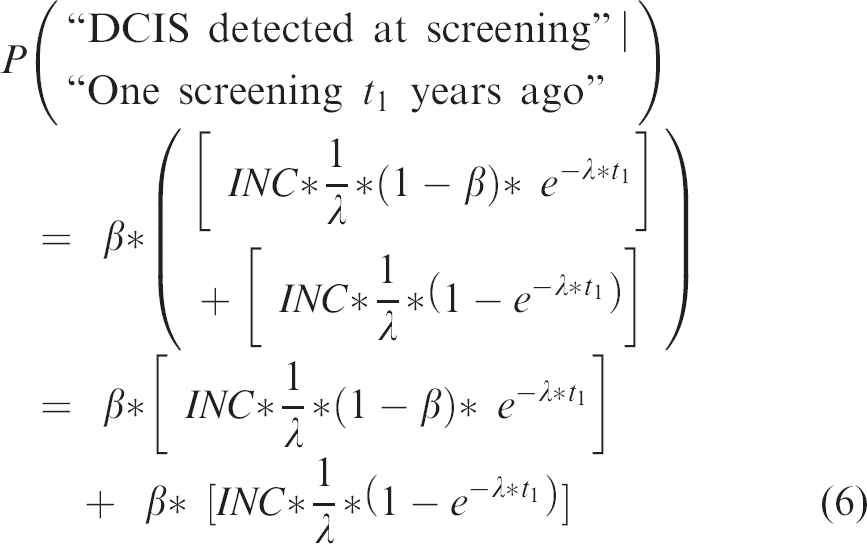
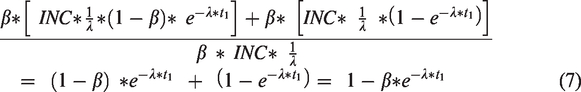
Then based on equations (2) and (6), the expected relative DCIS detection rate at second versus first screening becomes
As progression rates of Markov models are constant by time, Markov models have no memory and the frequency of DCIS available at the third screening will only depend on the number of cases missed at the previous screening exam, time since previous screening exam, and number of new preclinical DCIS since previous screening exam. In practice, formulas for repeated screening exams become recursive. Hence, for a third screening, 
Hence, resulting in a relative DCIS frequency at third versus initial screening of

Note that both 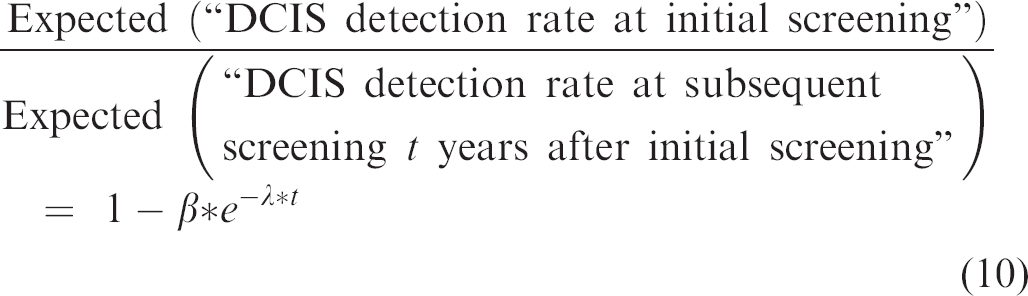
With the exponential sojourn times, the rate going out of the preclinical screening-detectable state is constant (“non-memory”). It is, however, possible that the transitions rates might vary by the time spent in the preclinical screening-detectable DCIS state. For the initial and subsequent screening, changing the sojourn time distribution only requires updating the exponential distribution term,
Expanding the model with non-progressive DCIS
The basic model for DCIS progression might be extended, allowing for some non-progressive DCIS being present at initial screening. If we assume a prevalence
Estimation of transition probabilities
The transition rate from preclinical screening-detectable DCIS to clinical DCIS, 
Hence, expected incidence,

Three possible progression paths exist for DCIS leaving preclinical screening-detectable DCIS phase, each with different progression rates in our applied Markov model: Progression to clinical DCIS,
Estimation of mean sojourn time and screening sensitivity using maximum likelihood estimation
Based on the expected and observed number of DCIS at screening, model parameters can be estimated by maximum likelihood estimation. Available data from screening registries are, however, an unbalanced mixture of age groups, mammography modalities, and Norwegian counties. DCIS is less frequent than invasive cancer so subgroup analysis used for invasive cancer is not suitable.21,22 Aiming for a single overall average estimate across the diverse data, we added a Poisson regression step. The data were first analyzed by Poisson regression to adjust for differences in baseline DCIS frequency across different age groups, counties of residence (Akershus, Hordaland, and Rogaland vs. all other study counties), and mammography modalities (digital vs. analog film mammography). The Poisson regression estimates and their covariance were then used in a maximum likelihood estimation, utilization that Poisson regression parameters are asymptotically normal distributed. Given a set of
and
In practice, maximum likelihood estimates are obtained by maximizing the log-likelihood function

Statistical uncertainties associated with both estimation steps were evaluated jointly by bootstrap replications. For the bootstrap, regression coefficients were sampled from a multivariate normal distribution based on the estimated Poisson regression coefficients and their covariance. Based on 10,000 bootstrap replications, 95% percentile bootstrap confidence intervals were calculated. The R statistical package was used for all data management, analysis, and figures. 24 Estimating routines were double-checked by testing on simulated data. R code for estimating parameters under the DCIS Markov model with only progressive DCIS is given in the Supplemental Material and on Github (https://haraldwf.github.io/Rmarkdown-pub/DcisProg-EstMet.html), including an example with the Poisson regression estimates from the here given analysis.
Input for estimating model parameters
The Poisson regression adjustment included data regarding age, county of residence, and digital vs. analog mammography (Table 2). Data from Oslo were excluded because of the gradual implementation of digital mammography. County of residence was defined as Akershus, Hordaland, and Rogaland vs. all other study counties, to adjust for higher DCIS rates in the counties where screening was first disseminated.
For estimating the transition rate from preclinical screening-detectable DCIS to clinical DCIS,
Results
Model fit and DCIS progression estimates
All preclinical DCIS lesions are estimated to progress or regress, with no non-progressive DCIS present at initial screening (Table 3, model I). Applying the proposed model with no non-progressive DCIS to Norwegian data, we obtained a very good model fit (Figure 2(a)), with a model deviance of 2.16 under 2 degrees of freedom (equaling a chi-square goodness of fit p-value of 0.34). Estimated sojourn time in preclinical DCIS phase before progression or regression was 3.1 years (95% confidence interval; 1.3, 7.6) and mammogram sensitivity was 60% (95% confidence interval; 35%, 93%) (Table 3, model II).
Estimated DCIS progression through preclinical screening with 95% confidence intervals.
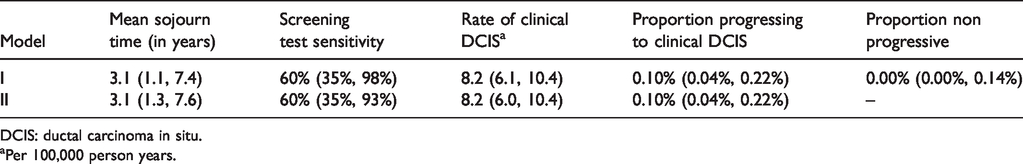
DCIS: ductal carcinoma in situ.
Per 100,000 person years.
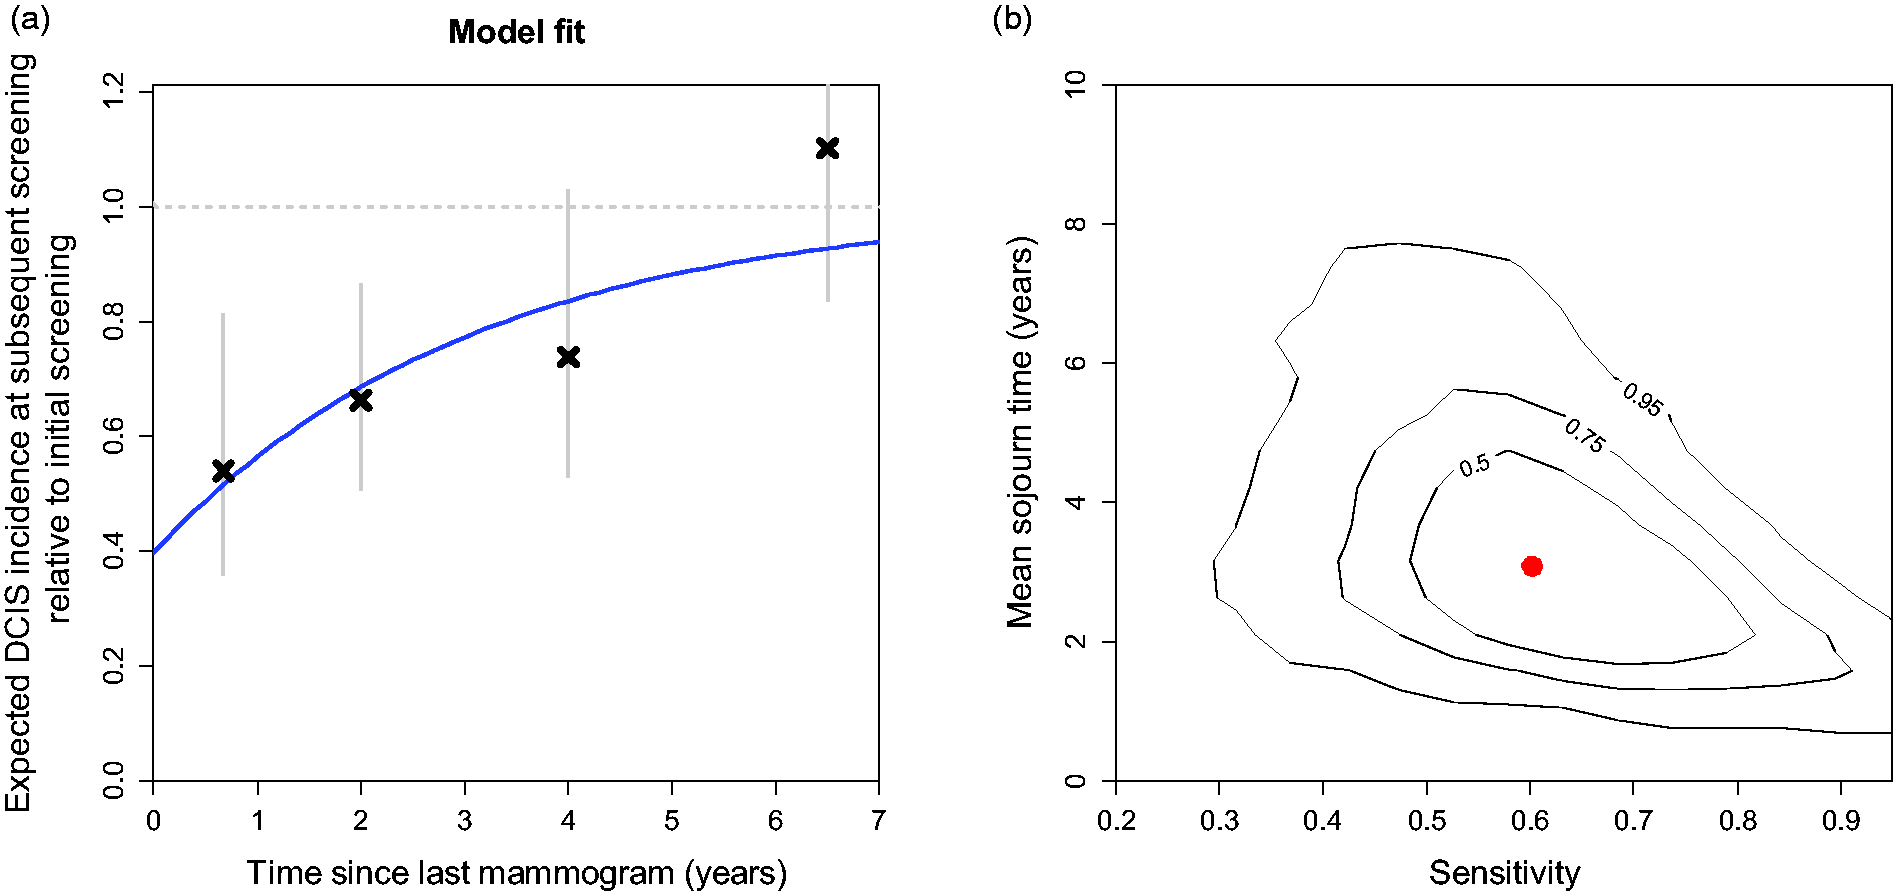
Fit of Markov model (II) to Norwegian DCIS data. (a) Observed data with 95% confidence intervals and model fit. (b) Joint 50%, 75% and 95% confidence regions for estimates of DCIS mean sojourn time and screening sensitivity (based on 10,000 bootstrap replications, evaluated on a 20 × 20 square grid using a two-dimensional bivariate normal density kernel).
Generally, mean sojourn time and sensitivity estimates were highly correlated, with long sojourn times coinciding with low sensitivity and vice versa (Figure 2(b)).
To explore beyond the exponential distribution assumption, decreased or increased variance (overdispersion) was added, extending the exponential sojourn time distribution using a gamma distribution. 25 Variations in sojourn time distributions had a moderate effect on our estimated mean sojourn time and screening test sensitivity. Best fit was found with a mean sojourn time of 3.7 years, screening test sensitivity 44%, and an estimated 50% lower variation of sojourn times than seen in the exponential distribution (Table 4). Relative to the number of model parameters, the simpler baseline exponential model gave best fit with the lowest Akaike information criterion (AIC).
DCIS progression Markov model (II) with varying degree of spread in sojourn times, using a gamma distribution extension of the basic exponential distribution.
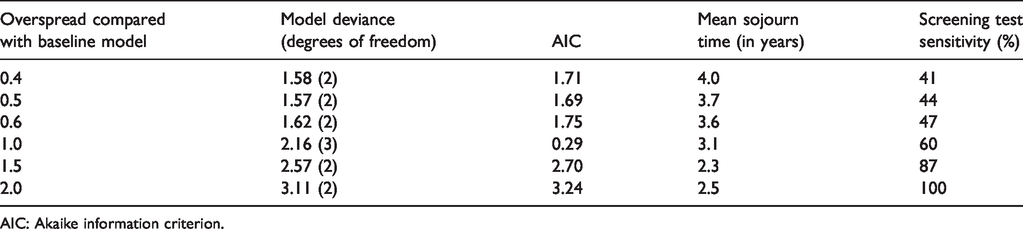
AIC: Akaike information criterion.
Maximum likelihood estimation was fairly straightforward for the Markov model, but as the applied quasi-Newton optimizing method (“L-BFGS-B” in R) needs initialization values, a grid search was conducted confirming the reported estimates.
Estimating mean sojourn time and mammogram sensitivity without Poisson regression adjustment, mean sojourn time was 3.8 years (95% confidence interval; 1.8, 10) and sensitivity 63% (95% confidence interval; 39%, 95%).
For a reference group with a digital mammography screening taken at 60 years of age, in one of the last 15 counties to enter the screening program, progression rates were estimated. The rate of clinical DCIS,
Discussion
We propose a DCIS progression model with few model assumptions, avoiding complex and uncertain natural history assumptions. As DCIS data usually are much sparser than invasive breast cancer data, we combined Poisson regression and Markov models to adjust for relevant covariables in sparse datasets. To the best of our knowledge, this is the first application of the combined procedure. Applying the model to Norwegian data, the sojourn time distribution was evaluated using six separate data points giving good model fit. We found no evidence of non-progressive DCIS. Estimated mean sojourn time in the preclinical DCIS state was 3.1 years (95%) confidence interval: 1.3, 7.6) with a screening sensitivity of 60% (95%) confidence interval: 35%), 93%).
As an early phase preinvasive condition, DCIS might be considered as slowly progressing. Our estimated mean sojourn time of 3.1 years showed, however, that sojourn time for preclinical DCIS is likely to be short to moderate. This is not very different from the estimated mean sojourn time of 3.9 to 7.9 years for invasive breast cancer based on the same BreastScreen Norway data.18,21 The few other available estimates of DCIS sojourn time also indicate it to be relatively short, 26 with de Gelder et al. estimating a sojourn time of 2.6 years. 27 It is possible that sojourn time might be longer in older women or a cohort only screened by digital mammography.10,18 However, the sparseness of DCIS data does not allow for subgroup analysis. This result implies that moderate screening intervals are needed if we want to detect many DCIS cases. The model also estimated screening test sensitivity. However, Markov model test sensitivity estimates for cancer screening models should be interpreted with caution since no reference tests exist and screening sensitivity is only an internal variable related to the corresponding sojourn time estimate. 21 Our estimates have wide confidence intervals, even with a moderate number of model parameters. This is in line with general uncertainties associated with DCIS modeling. 26
Interestingly, we found no evidence of non-progressive DCIS. There is a possibility that non-progressive DCIS appears in older age, but this is not likely as our data partly cover women up to 69 years of age. Thus, we project that non-progressive DCIS is uncommon.
The progression rate from screening-detectable DCIS to invasive breast cancer,
Optimally, our model parameters should be estimated based on randomized trials, but those data are not yet available for DCIS.11,12 In the absence of randomized data, our Norwegian screening data with mandatory reporting 32 on several levels 3 is probably an excellent data source. The questionnaire data are, however, more uncertain. Some women will not remember the date of their last mammogram, and there might be substantial variations in mammography frequency across DCIS risk factors. The higher DCIS incidence seen among women with more than five years since last mammogram, compared to women with no earlier mammography, may indicate some selection bias limiting the estimated proportion of non-progressive DCIS. However, the high number of mammograms taken before the public screening program began indicates that also women outside selected risk groups had mammograms taken before the official program. Opportunistic screening might also have affected the observed DCIS incidence before screening. 33 Our questionnaire data indicate substantial levels of opportunistic screening, 33 while incidence trends before screening show moderate signs of screening before the official program began.18,34
Extending the modeling to DCIS grade and hormonal status would be useful for clinical decision-making. However, this is challenging as there are no suitable data to evaluate the DCIS progression by subtypes. With the currently available data, DCIS modeling by subtype would entail stricter, more questionable, model assumptions, leading to uncertainties regarding the estimated model parameters. Since we were not able to separate DCIS regression from progression to invasive breast cancer, we could not draw a firm conclusion on the extent of DCIS overdiagnosis. However, a relatively short sojourn time in the preclinical screening-detectable DCIS phase indicates that most DCIS lesions progress or regress within a moderate timeframe. In practice, this potentially suggests a moderate duration of follow-up time if active surveillance will be considered for screening-detected DCIS lesions.
Conclusions
Most preclinical DCIS lesions probably progress or regress, with a moderate mean sojourn time estimated to be 3.1 years.
Footnotes
Acknowledgements
The authors are very grateful for deceased professor Marvin Zelen for his guidance on natural history modeling of breast cancer. The study has used data from the Cancer Registry of Norway. The interpretation and reporting of these data are the sole responsibility of the authors, and no endorsement by the Cancer Registry of Norway is intended nor should be inferred. The authors want to thank Ragnhild Falk for thoroughly reading the manuscript and providing helpful comments.
Declaration of conflicting interests
The author(s) declared no potential conflicts of interest with respect to the research, authorship, and/or publication of this article.
Funding
The author(s) disclosed receipt of the following financial support for the research, authorship, and/or publication of this article: This work was supported by the National Institutes of Health under National Cancer Institute Grants R01CA165301 and U01CA199218. The funding agreement ensured the authors’ independence in designing the study, interpreting the data, writing, and publishing the report.
Supplemental material
Supplemental material for this article is available online.