
Abstract
Objective
The first and second rounds of the Basque programme for organised colorectal cancer screening were implemented between 2009 and 2014. Our objective was to measure the changes in incidence, tumour, node, metastasis staging distribution and tumour, node, metastasis-adjusted survival of patients with colorectal cancer from 2003 to 2014.
Method
Colorectal cancer cases with screening (patients <70 years old) and without screening (patients ≥70 years old) were compared during three four-year periods: 2003–2006, 2007–2010 and 2011–2014 (fully implemented phase). Cox regression, five-year relative survival and cancer probability of death were calculated for each four-year period, age group and tumour, node, metastasis stage. Adjusted incidence rates were analysed by joinpoint regression.
Results
In an analysis of 23,301 cases of colorectal cancer, the incidence in patients younger than 70 years in 2013 showed a 17% annual decrease. The survival hazard ratios for stages I, II and III for 2003–2006 and 2007–2010 were compared to those for 2011–2014. From the first to the third period, diagnosis in the early stages (I and II) rose from 45.1% to 50.9% in the younger patient group and remained stable in the older group (49.6% and 49.4%). Additionally, the five-year relative survival rate increased significantly from 0.67 to 0.82 in those patients younger than 70 years, whereas in patients 70 years or older the rate did not change significantly (0.61 and 0.65).
Conclusion
The screening reduced incidence and improved survival by anticipating the diagnosis and by reducing mortality for each tumour, node, metastasis stage in the target population. The effect on survival could also be due to lead-time bias.
Introduction
Colorectal cancer (CRC) meets the criteria of Wilson and Jungner for screening due to its high incidence, long preclinical stage, effective early treatment and correlation between stage and mortality. 1 The epidemiological impact of screening has been recognised in countries with long-term programmes, such as the United States and Germany, where the incidence has begun to decline, while in most countries it is stable or growing.2–4 Nonetheless, CRC screening programmes have been implemented in only some European countries, Canada and regions of North America, Asia and Oceania. 5 The Basque Country initiated a population programme of CRC screening in 2009. The first round reached full coverage at the beginning of 2014, with a participation rate of 68.4% among the 586,700 residents aged 50–69 years. 6 A statistically significant annual increase in the incidence of CRC in the Basque Country was registered between 2000 and 2013. 7
In addition to the incidence, mortality is the other key indicator for the assessment of cancer prevention policies. A long follow-up is required to assess mortality, and thus survival is used as a surrogate. 2 , 8 However, the interpretation of survival in the context of cancer screening could be misleading, because of lead time and length time biases. 9 , 10 Nevertheless, comparison of the survival of individuals with cancer with that of the general population through the estimation of relative survival (RS) has been widely used. 11 , 12 Thus, the RS at five years for those with CRC in the US has grown steadily in recent decades to reach 65%. 13 In Spain, this indicator is 57% for cases diagnosed between 2000 and 2007.14–17 However, these studies are limited because the population registries do not include the tumour, node, metastasis (TNM) stage. 18 , 19 With the assumption of this limitation and in order to measure whether the screening changes the survival of patients with CRC beyond the spurious effect of lead time, it is necessary to adjust RS for the TNM stage, since this is the main prognostic factor.20–23 Assessing whether the Basque organised screening programme is reducing the incidence and improving survival through these two mechanisms would reaffirm it as a CRC prevention policy and support its implementation in countries that do not currently have a programme.
The objective of this study was to measure the impact of the first and second rounds of the population CRC screening programme of the Basque Country disaggregated by age group (<70 years old and ≥ 70 years old) on the incidence, stage distribution and TNM-adjusted survival of patients diagnosed from 2003 to 2014 in three four-year periods: the period without screening (2003–2006), that of initiation (2007–2010) and the period with screening (2011–2014).
Methods
An observational study was initially carried out to analyse the evolution of the survival and incidence of CRC cases using data from the cancer registries in the Basque Country. The study protocol was approved by the Clinical Research Ethics Committee of the Basque Country (Number PI2016099). In the organised screening programme, all residents aged 50–69 years were invited every two years to receive testing for faecal occult blood by quantitative immunochemical techniques (FIT), which would be followed by colonoscopy if the test result was positive. 24 The second round began in 2011, and by the end of 2014, 80.5% coverage of invitations was achieved. The third round, which was started in 2013, had attained 26% at the end of 2014. The supplementary material includes a table (Table A1) and a Lexis diagram (Figure A1) showing the age and period approach of the CRC screening program built on the method of Giorgi Rossi et al. 25 Since the screening programme was starting its third round in 2014, we hypothesised that the incidence and survival for patients less than 70 years of age in the four-year period 2011–2014 would change significantly. Thus, to approach a natural experiment, the analysis was disaggregated by age at diagnosis into individuals younger than 70 years and those 70 years or older, to use the former as an intervention group and the latter as a control group.
Sources of information
The source of information for the analysis of the incidence of CRC in the Basque population was the Basque Cancer Registry from 2003 to the last available year (2015), and only carcinomas in situ were excluded. 26 This registry is the most complete because it is fed by different sources including the Osakidetza Cancer Hospital Registry (RHCO). RHCO collects cases of cancer treated in public hospitals in the Basque Country. Although the population registries apply an adapted Condense Summary Stage classification system for the whole period, the RHCO uses the TNM classification. 18 As cases of CRC, codes C18, C19 and C20 of the International Classification of Diseases (ICD10) were identified. The differences in the characteristics of variables between the four-year periods (2003–2006) and (2011–2014) were statistically assessed by means of a χ2 test or Fisher’s exact test for the categorical variables and the Student’s t-test for mean comparison in the continuous variables.
Incidence analysis
The age-adjusted incidence rates disaggregated by patients younger than 70 years and those 70 years and older were estimated for the period 2003–2015 by direct standardisation, with the standard European population of 2013 as the reference population. To assess incidence by stage we assigned the TNM stage of the missing cases through multiple imputation based on the distribution of stages found in the year of diagnosis. Through regression models (joinpoint regression) the time evolution of the incidence rates was studied by estimating the annual percentage change and identifying the points where the slope of the regression function changed (joinpoints), which indicated a change in trend in the evolution of rates. 27 This joinpoint regression analysis was also carried out by five-year age groups.
Survival analysis
A retrospective observational design study was carried out to assess the survival rate in CRC cases from 2003 to 2014 (TNM stage was not available at that time for year 2015) until October 31, 2017. The variables obtained for each patient were: stage TNM (I, II, III and IV), age, location (colon, rectum), sex, date of diagnosis of CRC, vital status at the end of follow-up and date of death without specification of the cause.
The descriptive analysis of variables was carried out for each four-year period. In the survival analysis, the mortality rate for each 4-year period was initially compared for each stage with the use of Cox proportional hazards regression models adjusted for age, sex and location. The analysis of the proportionality of the risks was documented by the Pearson correlation between the scaled residues of Schoenfeld and the logarithm of time (Table A2). 28 All the statistical analyses were performed with the statistical package R (version 3.2.2). In the second stage, the changes in the survival rate for cases of CRC were analysed by calculating the five-year RS rates for each cohort by stage, four-year period and age group (less than 70 years old and 70 years old or more). We calculated the RS as the quotient between the observed survival for cases of CRC and the expected survival according to the mortality of the general population, which is that of the Basque Country. 29 For this purpose, the web application WebSurvCa 30 was used, which allows calculating RS by the Hakulinen method and the probabilities of death due to the disease under study (DPcancer) and from other causes (DPoc). In the trend analysis, it was established that the differences were significant when the confidence intervals at 95% of the RS of the compared periods did not overlap. To separate screening effects (early diagnosis) from other effects (survival improvement by stage) on the probability of death by cancer (DPcancer), we used the method proposed by Duffy et al. and applied the 2003–2006 stages’ distribution to the probabilities of the 2011–2014 period. 31
Results
Of the 23,301, 7990 (34%) were not classified with the TNM code (Table 1). Therefore, 15,311 cases comprised the sample for survival estimations. The percentage of staged cases rose from 60.2% in 2003–2006 to 72.3% in 2011–2014. Table 1 shows the characteristics distributed by four-year periods (2003–2006, 2007–2010 and 2011–2014). Approximately two-thirds of cases were cancer of the colon, and one-third was cancer of the rectum. There were no changes in the proportion of men (65%) and women (35%) or in age (mean: 69 years) of the cases in the three study periods. However, the percentage of stage I rose from 13.1% in the first four-year period to 23.4% in the third four-year period. When cases for each period were aggregated between early (I and II) and late (III and IV) stages, the distribution showed an increase in early diagnosis. Early-stage cases increased from 47.4% in 2003–2006 and 44.8% in 2007–2010 to 50.1% in 2011–2014. Those slight differences were due, to a much greater extent, to the number of cases in patients less than 70 years of age. In these patients, the percentage of stages I and II cases rose from 45.1% to 50.9%, whereas in those 70 years or older that percentage remained stable (49.6% and 49.4%). However, approximately 50% of cases in patients both younger and older than 70 years remained in early stages in all three periods.
Characteristics of cases of colorectal cancer according to four-year periods.
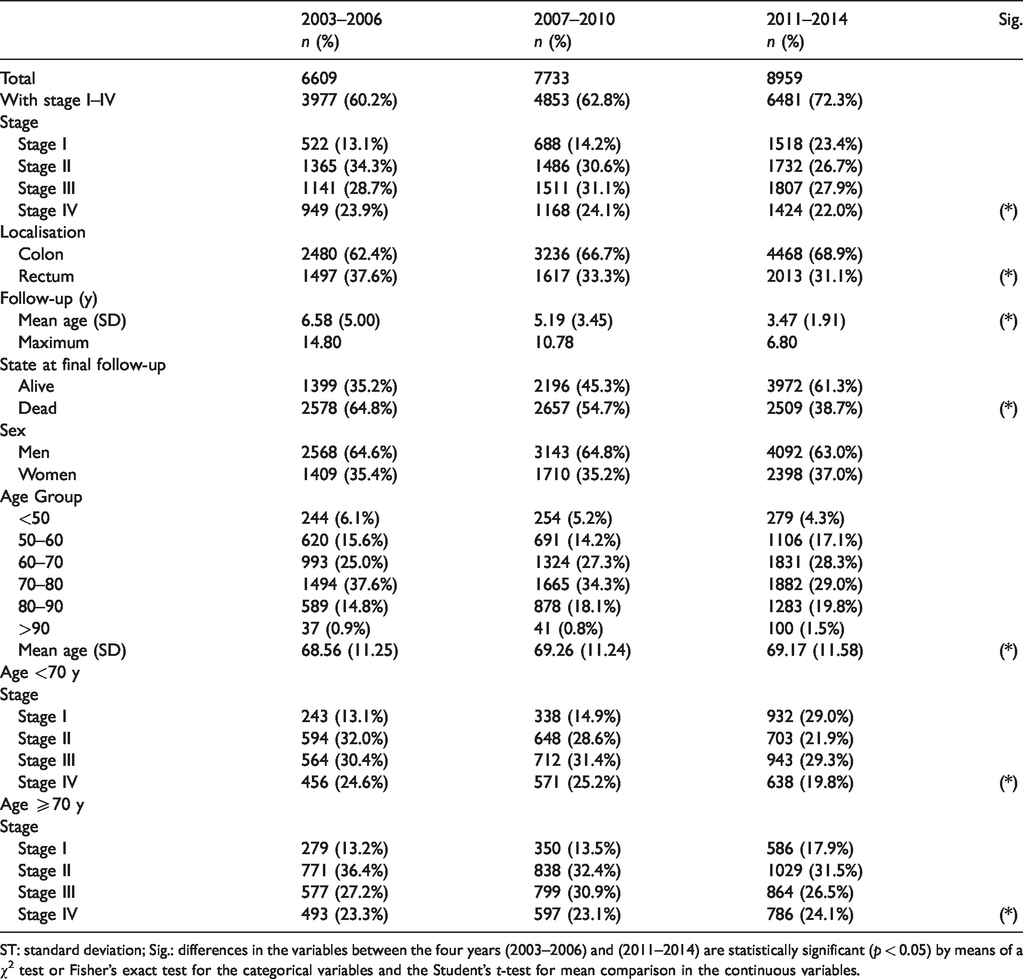
ST: standard deviation; Sig.: differences in the variables between the four years (2003–2006) and (2011–2014) are statistically significant (p < 0.05) by means of a χ2 test or Fisher’s exact test for the categorical variables and the Student’s t-test for mean comparison in the continuous variables.
The evolution of CRC incidence can be seen in Figures 1, 2 and Figure A3 in the supplementary material. Two phases can be distinguished in the age groups; the first phase shows a statistically significant upward trend and the second phase a downward trend. In the younger patient group, which included the target population for screening, the incidence rate between 2003 and 2013 showed a statistically significant annual percentage increase of 5%. However, in 2013 there was a change in trend (joinpoint) that resulted in an annual statistically significant decrease of 17% to 2015. In the older patient group, there was also a statistically significant increase of 1% in the incidence rate between 2003 and 2012. However, in the older group the annual decrease of 4% between 2012 and 2015 was not statistically significant. When the analysis was carried out by five-year age groups (Figure 2 and Table A3), the results were consistent because the only significant results were found in cohorts younger than 70 years. The 75–79 cohort behaved atypically as it showed a statistically significant annual increase (2%) which changed from 2012 to 2015 to a non-significant annual decrease (7%) manifested by a joinpoint in 2012 (Table A3 Supplementary material). Incidence over time by stage did not show statistical significance in the joinpoint regression (Figure A3).
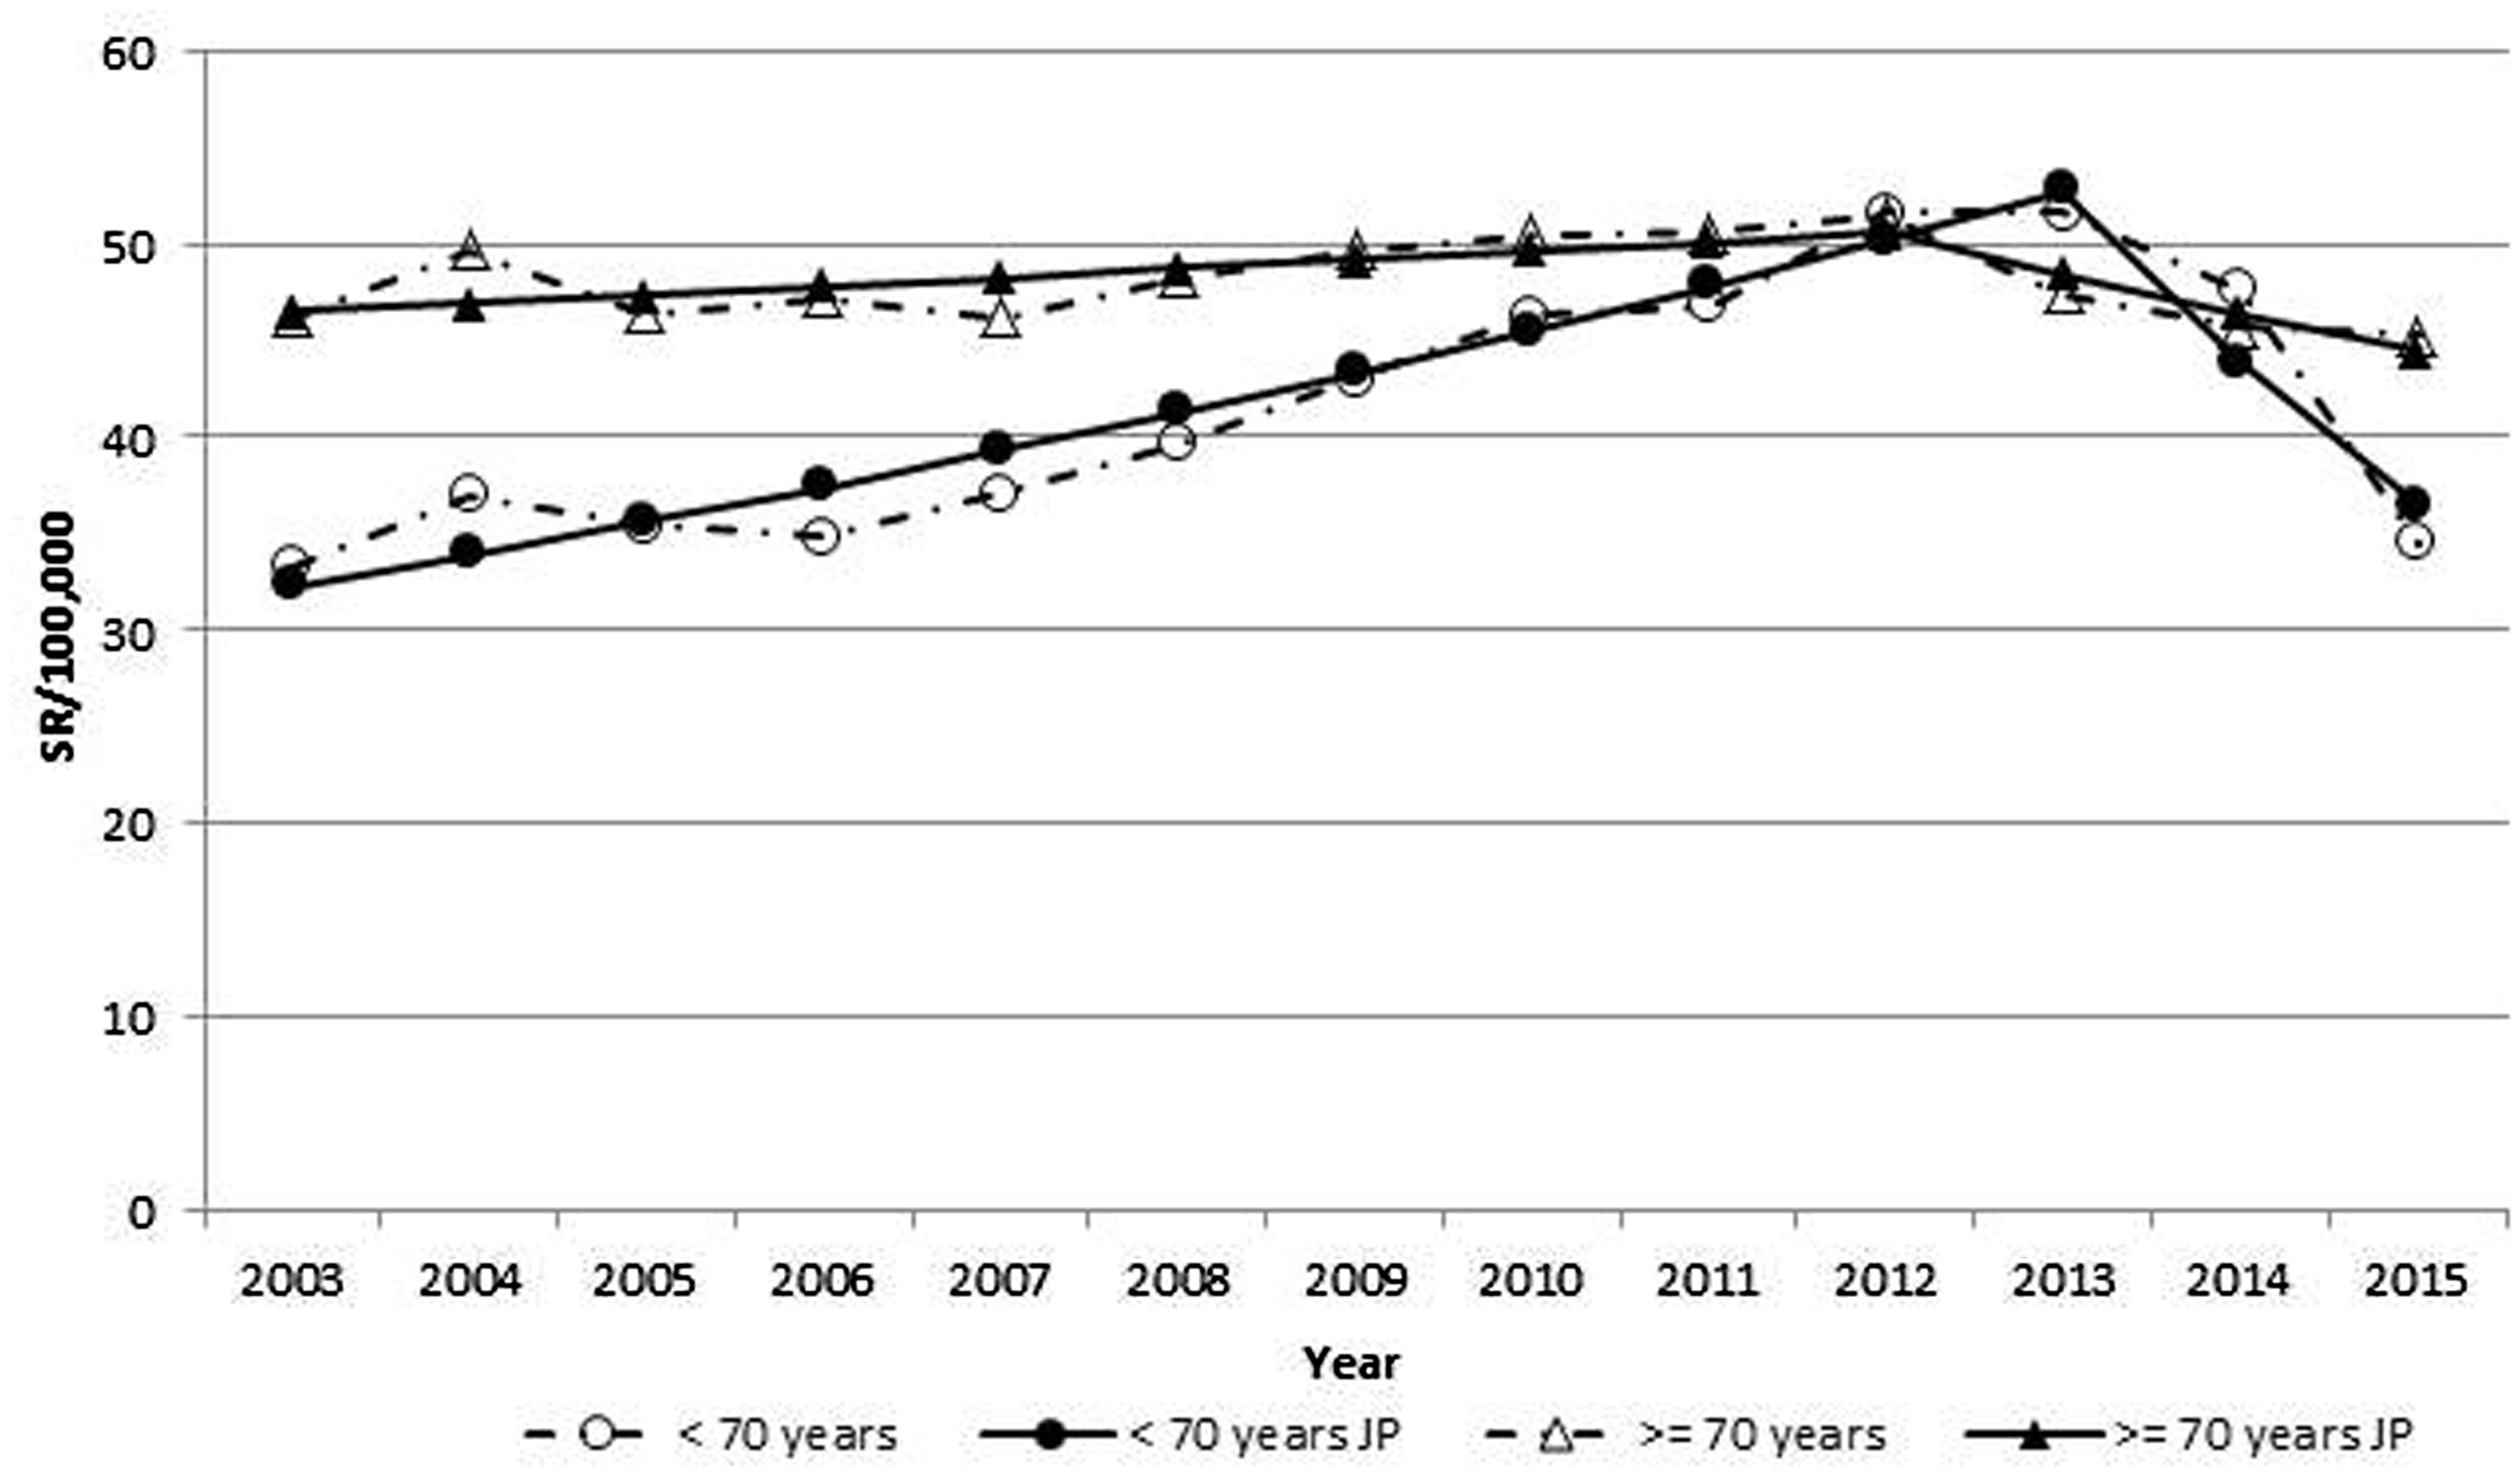
Evolution of the total incidence of colorectal cancer shown through joinpoint regression.
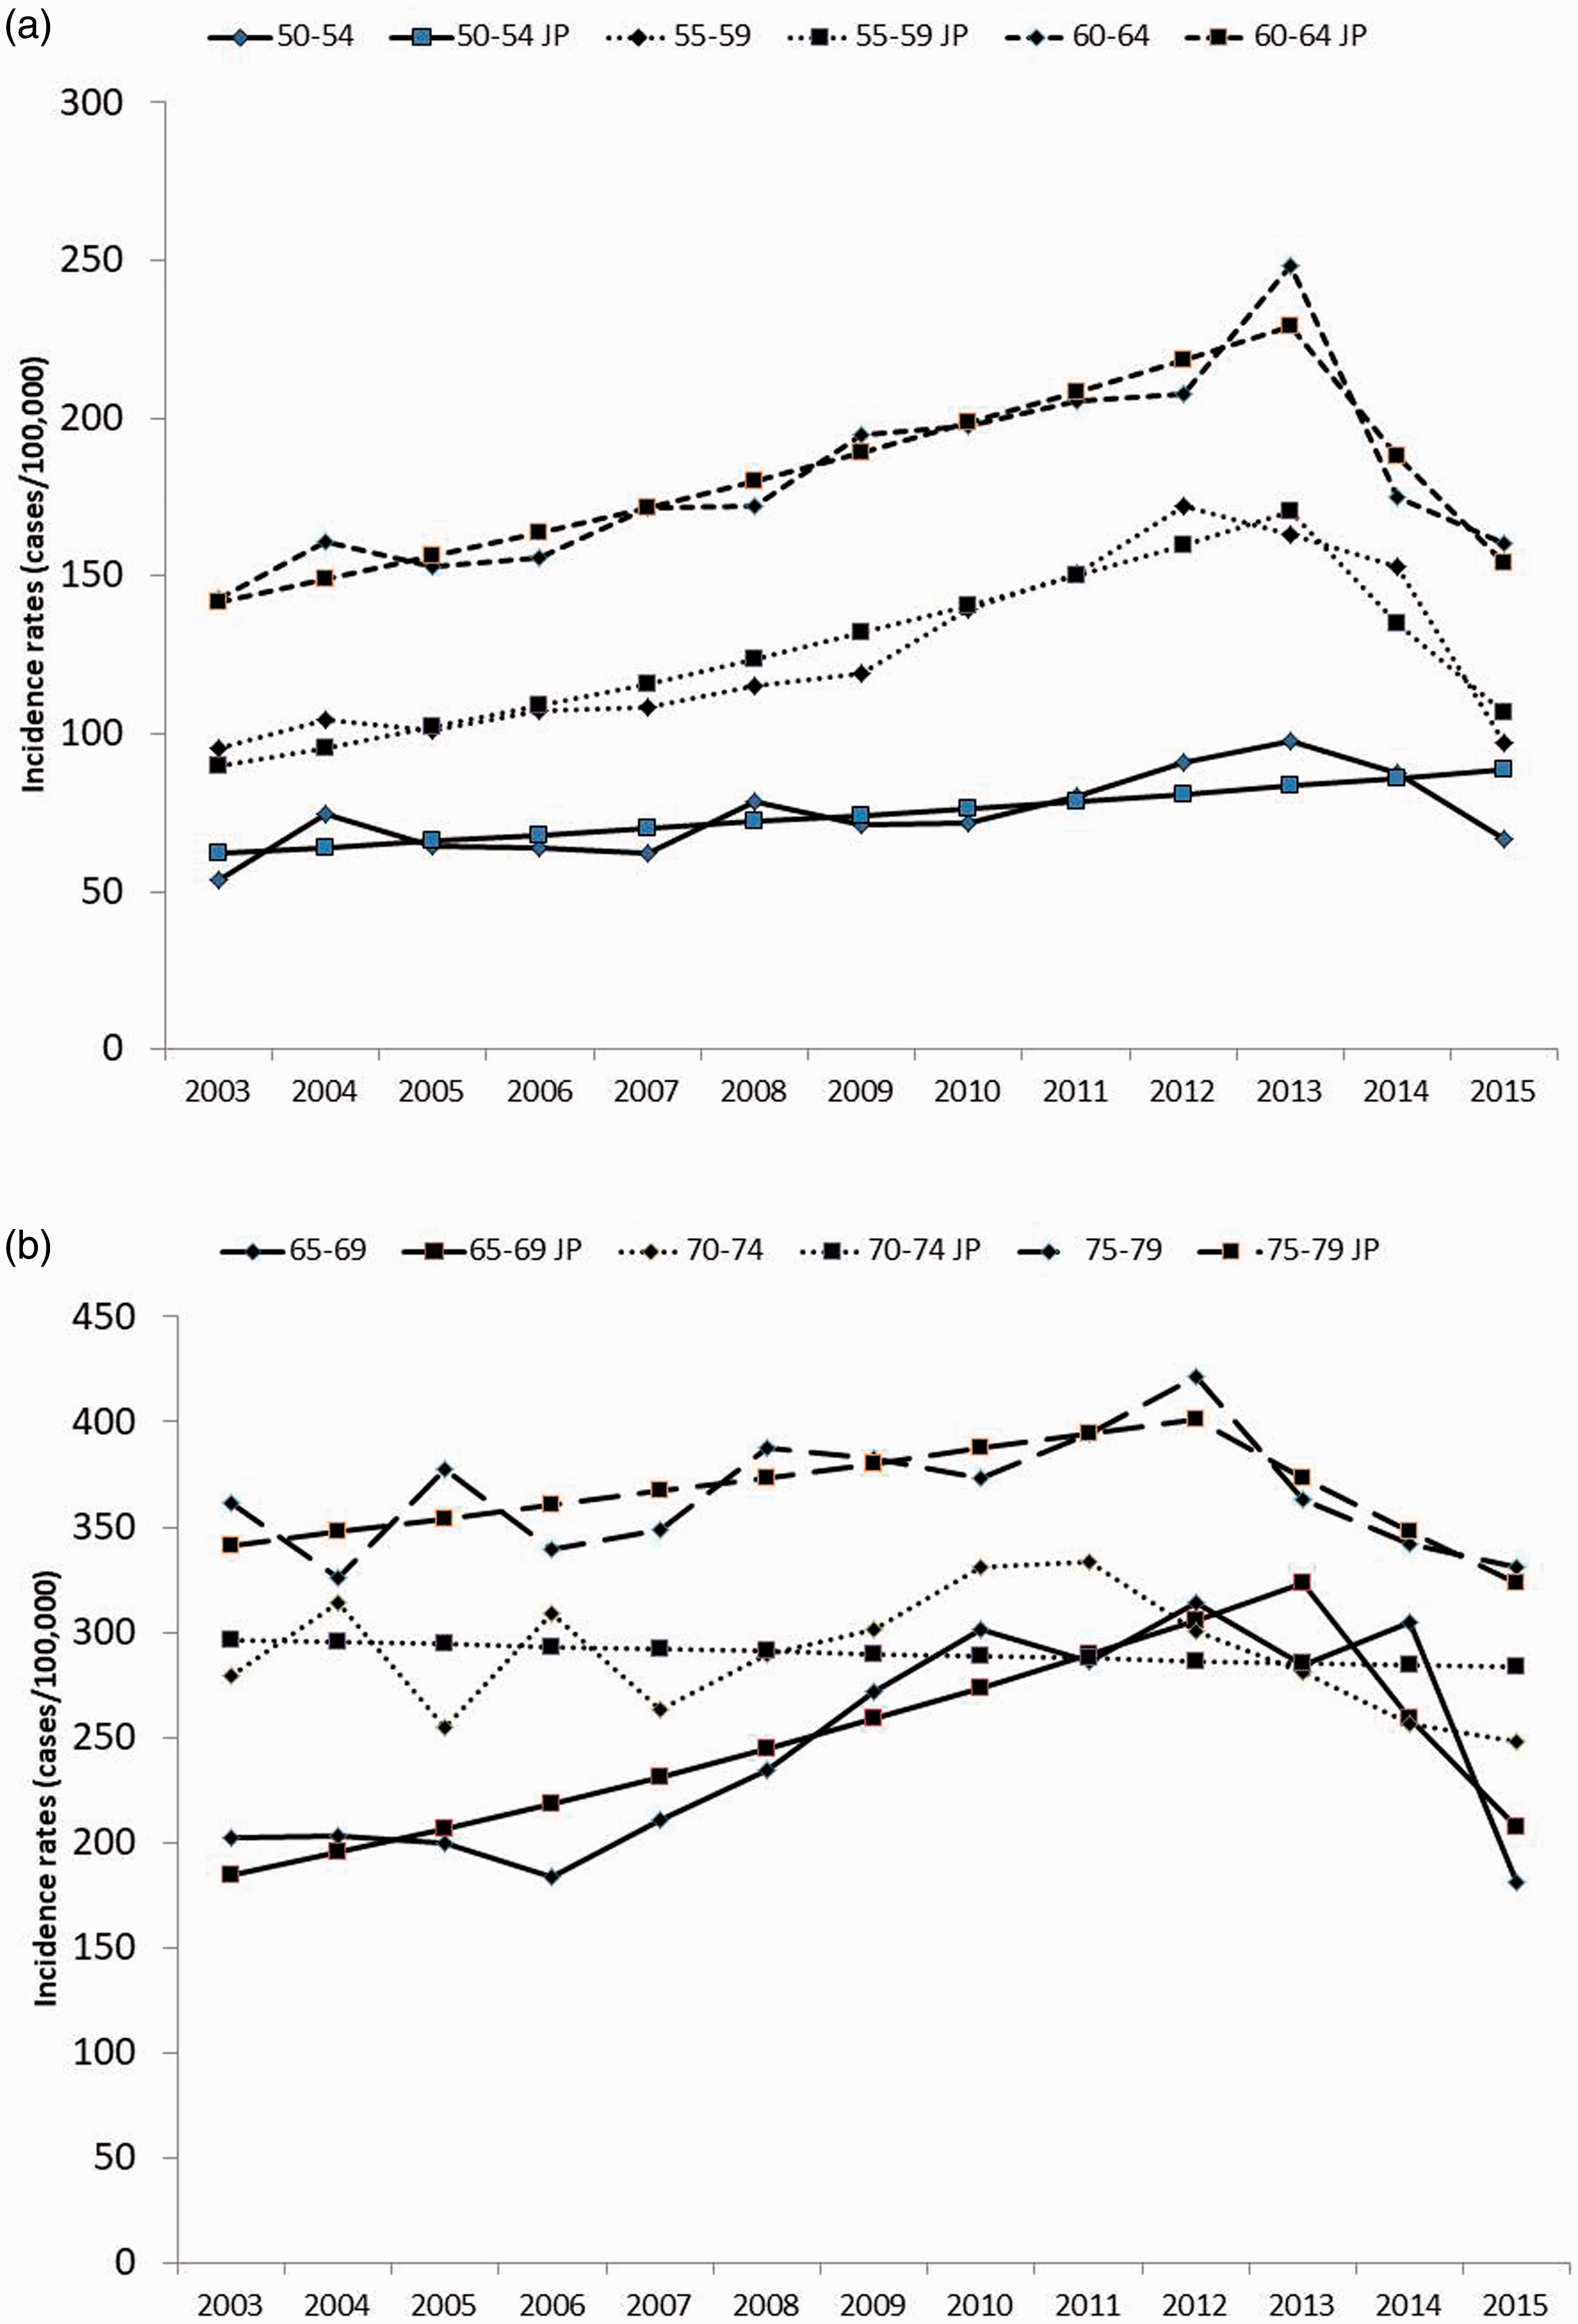
Evolution of the incidence of colorectal cancer by 5-year period shown through joinpoint (JP) regression by age group. (a) From 50–54 to 60–65. (b) From 65–69 to 75–79.
The Cox regression analysis by stage indicated that, from the period 2003–2006 to the period 2011–2014, statistically significant improvements occurred in the survival rates adjusted by sex and age in stages I–III, but not in stage IV (Table 2). The hazard ratios (HR) of death from 2011 to 2014 compared to those from 2003 to 2006 were 0.81 for stage I, 0.80 for II and 0.81 for III, all of which were statistically significant. Except in stage IV, the mortality rate in men was greater than that in women. Differences were higher for patients younger than 70 years. In Table A2 of the supplementary material, the results of the risk proportionality tests are displayed for the different Cox models.
Comparison of colorectal carcinoma survival rates for the four-year periods 2007–2010 and 2003–2006 with the four-year period 2011–2014 using Cox regressions for each stage.
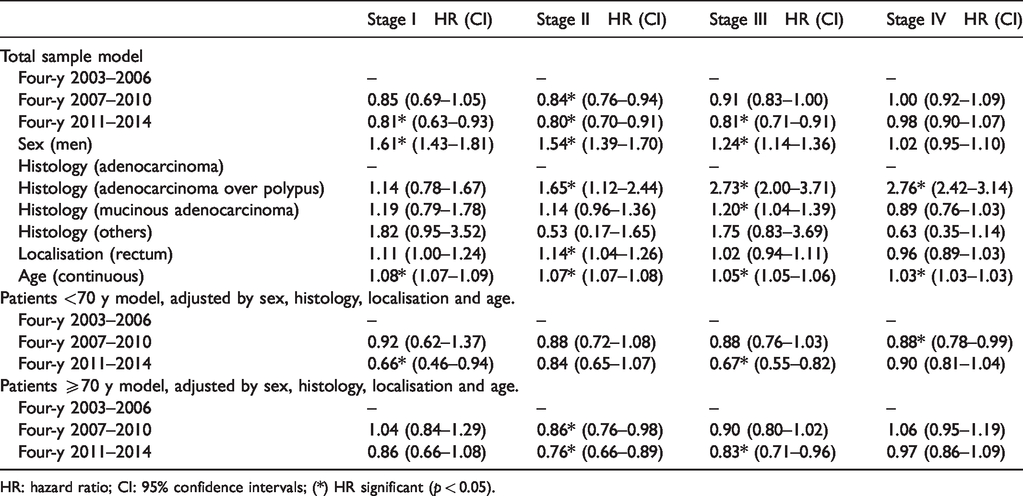
HR: hazard ratio; CI: 95% confidence intervals; (*) HR significant (p < 0.05).
The five-year RS of the patients with CRC disaggregated by four-year periods, stage and age group is shown in Table 3 (and Table A4 with confidence intervals) and allows visualising the change in RS with the progress of stages and age. At stage I, the RS is approximately 0.9, and changes by stage IV to figures between 0.234 and 0.069. The RS improvements associated with the 4-year period reflecting full implementation of the CRC screening programme (2011–2014) are statistically significant for patients less than 70 years of age at stages I and III, but not in those 70 years or more. In patients with stage I cancer younger than 70 years, RS reached 0.97 in 2011–2014. When the entire sample including all stages was disaggregated by four-year periods of diagnosis, the RS was 0.64 in the period without screening (2003–2006), 0.68 in the starting period (2007–2010) and 0.74 in the implemented one, with statistically significant differences. However, in the same analysis, when the differences observed in the entire sample were compared by age group, they were significant only in those less than 70 years. In addition, Table 3 allows the separate comparison of the risk of death from cancer and from other causes for each subgroup. Tables 4 and A5 show that in patients younger than 70 the probability of death by cancer decreased by 28% from the first to the third period according to the method proposed by Duffy et al. 31 This percentage was attributed in 52% (15%) of cases to TNM stages’ distribution change and in 48% (13%) to improvement in survival. Meanwhile, in patients older than 70 years the probability of death by cancer was similar in both periods.
Five-year relative survival and probability of death of patients with colorectal cancer disaggregated by four-year period, stage and age group.
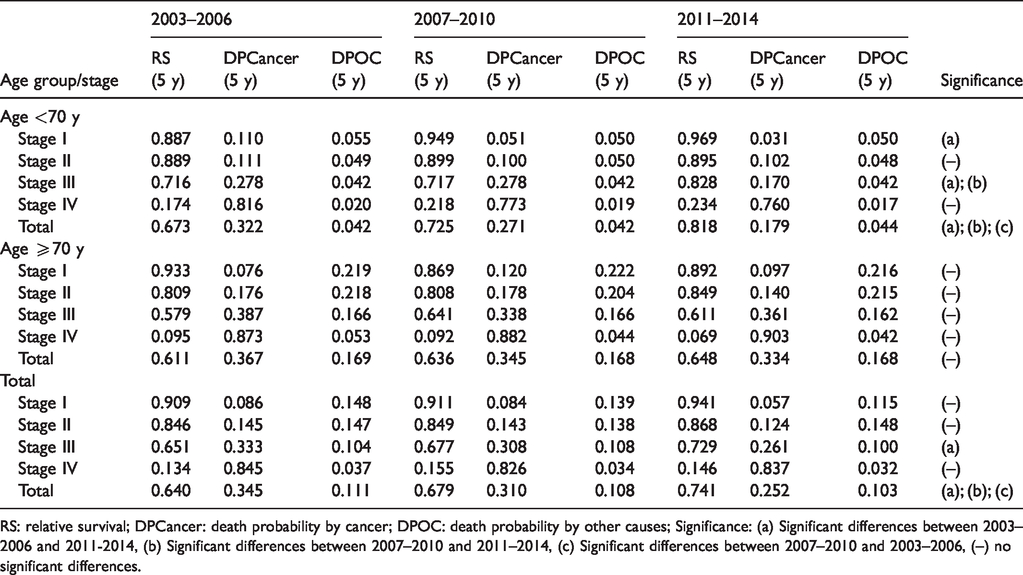
RS: relative survival; DPCancer: death probability by cancer; DPOC: death probability by other causes; Significance: (a) Significant differences between 2003–2006 and 2011-2014, (b) Significant differences between 2007–2010 and 2011–2014, (c) Significant differences between 2007–2010 and 2003–2006, (–) no significant differences.
Impact on the probability of death by cancer (DPcancer) of screening according to effects on stages’ distribution and effects on better survival by stage.
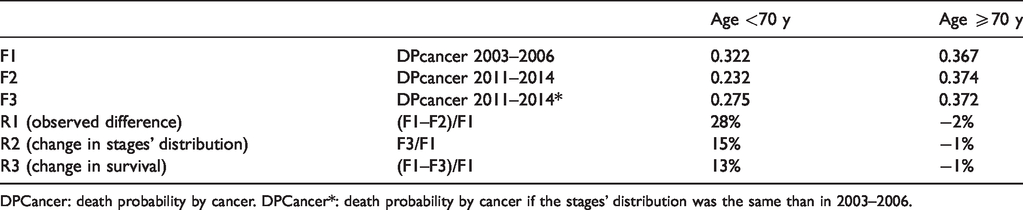
DPCancer: death probability by cancer. DPCancer*: death probability by cancer if the stages’ distribution was the same than in 2003–2006.
Discussion
The results of this study show that during the years analysed there were relevant changes in the epidemiology of CRC in the Basque Country that can be associated with the first and second rounds of the organised screening programme. From 2003–2006 to 2011–2014, in patients younger than 70 years old, the incidence began to decrease, cases were diagnosed at earlier stages and survival increased, evidenced by the decline of the HR of death for each stage from the first to the 2011–2014 period. Consistent with these drivers, the five-year RS for the total CRC cases in the Basque Country rose from 0.64 in 2003–2006 to 0.74 in 2011–2014. Besides the differences among four-year periods, the relationship to screening is reinforced by changes that appeared in patients younger than 70 years old. Meanwhile, in those 70 years or more who were not included in the target population, incidence, survival and stage distribution were not altered. Nonetheless, these differences over time between age groups can also be influenced by other determinants such as secular trends, lead time bias, length time bias and changes in the TNM classification. Therefore, our results have to be assessed with caution given the short path achieved by the Basque program in 2014 and the distortion of CRC epidemiology shaped by screening.
The positive trend in incidence and mortality rates observed in the US, Italy, New Zealand and Australia has been linked both to improvement in treatment and to an organised screening programme. 2 , 8 , 25 , 32 , 33 However, the relative fraction attributable to each component and the role of the changing prevalence and distribution of the key risk factors are still not clear. 2 , 8 As these studies lack granularity due to the general approach, patient-level data analysis can be complementary by shedding light on each element separately. The strength of our study relies on its design as a natural experiment comparing populations with screening (<70 years) and without screening (≥70 years). As the joinpoint in 2013 that was associated with a decrease of 14% in CRC incidence in the Basque Country appeared only in the target population, a relationship with the screening programme can be postulated. Nonetheless, although the 4% reduction in the incidence of CRC in people over 70 years of age since 2012 was not statistically significant, we cannot rule out any impact. As the screening program progresses, it shapes the CRC incidence dynamically and determines an unequal relationship with each five-year cohort. An inconsistency with the general analysis appears in the 75–79 cohort which, in contrast to the increase in incidence in the previous stage, shows an annual decrease of 7% from 2012 to 2015. This is worth noting even though not statistically significant. The evolution over time of the incidence by stage and age group did not show any statistically significant trend, possibly due to the small sample sizes. With data from the Basque Country, this work has reproduced the findings of Levin et al. that showed the reduction of incidence in the US due to an organised screening programme. 34 , 35 The explanation relies on the fact that CRC has an ideal natural history for screening, because it allows diagnosing and eliminating precancerous lesions. Because of the short follow-up since the start of the screening programme, this effect is expressed only in those less than 70 years. Results from programmes with longer follow-up have also observed incidence reduction in those 70 years or older. 36 However, given the short follow-up and the slow progression of adenomas, incidence reduction could be the ‘compensatory drop’ observed due to shifting of the date of diagnosis of some cancers to an earlier period due to screening, rather than to prevention of cancer by removal of adenomas.
Cronin et al. 37 indicate in the annual report of the National Cancer Institute that a portion of the lower CRC mortality rate in the US can be attributed to screening. In the Basque Country, a change in the distribution of the stages of CRC cases in association with the screening programme has been found, which is in line with observations in other countries, such as Germany that has had a screening programme since 2002. 20 Moreover, these figures are consistent with those reported in the US for 2010–2014, which measured by joinpoint regression an annual incidence decrease of 1.9%. 37 The association with screening is reinforced by the fact that the significant changes in stage distribution were found only in the younger population. In measuring the impact on incidence of an Italian CRC organised screening programme with the same 70% of test coverage as in the Basque Country, Giorgi Rossi et al. concluded that it reduced both incidence and mortality due to the absence of incidence reduction in the ages excluded from the screening. 25
To our knowledge, this is the first time that RS by TNM stage has been estimated in Spain, since population registries have traditionally used the Surveillance, Epidemiology and End Results (SEER) classification.15–18 However, the trend of RS by stage during the three periods from no screening to full programme implementation consistently reproduces the expected evolution. Thus, in the US in the period 2007–2013, the RS at five years was 0.88 for stage I, 0.80 for II, 0.66 for III and 0.13 for IV. 37 These figures are similar to those observed in our work in 2011–2014 (0.94, 0.87, 0.73 and 0.15) that contrast with those calculated for 2003–2006 (0.91, 0.85, 0.65 and 0.13). In the Netherlands with a screening programme initiated in 2014, from 1989–1997 to 2010–2014 the five-year RS for all CRC cases rose from 0.53 to only 0.62 in the colon and from 0.51 to only 0.65 in the rectum. 38 In agreement with indicators from other populations showing the benefit of screening, in the Basque Country the RS improved significantly from the period with no screening to the period of full implementation.
Besides the lead time bias and the observational design of our study, other limitations should be noted, such as length time bias and changes in the TNM classification. Nonetheless, RS allows us to overcome the lack of information on the specific cause of mortality; it includes in the denominator the general mortality that is calculated specifically for age and sex characteristics of the cancer sample. 30 , 39 Consequently, the comparison of survival probabilities is not affected by the changes in the competitive risk of death from other causes. 29 , 39 During the analysed period, the sixth version of the TNM classification was in use, and, in 2010, the seventh was developed. 40 The criteria based on the new diagnostic techniques incorporated in the current (seventh) version could introduce a selection bias in the classification of the stages. However, as the implementation of TNM classification was progressive, we believe that the results obtained in the different four-year periods are comparable. 41 Length time bias, or the overestimation of survival duration due to the relative excess of cases detected by screening that is slowly progressing, is a limitation that we could not avoid and reduces the scope of our conclusions 42 . Finally, improvements in clinical treatment also contributed to add years of life for patients with CRC. The therapeutic approach by a multidisciplinary team including a colorectal surgeon, a medical oncologist, a gastroenterologist, a radiotherapist, a radiologist and a pathologist has been associated with advances in oncological surgery and an improved use of adjuvant and neoadjuvant chemotherapy. 19
The observation of changes in mortality rates associated with screening entail a long follow-up after the first round of the programme. Meanwhile, our analysis comparing survival trends after the first round according to age group and stage can shed light on the early evaluation of organised CRC screening. After more rounds, when the differences in incidence, stage distribution and survival of cases are disaggregated by age group (<70 years old and ≥70 years old), they will be more difficult to interpret because both populations will be shaped by screening. 19 Also, use of survival as a surrogate indicator in the analysis incorporates more elements that make interpreting results difficult. 10 Our approach takes into account how a specific policy (screening) affects cases of CRC as a whole in terms of population by analysing the Cancer Population Registry. As the RS calculation is based on a comparison with general population survival, the calculation helps to reduce the bias related to misleading survival significance. 8
The programme of the Basque Country constitutes a public health intervention, organised for the whole target population. Cancer detection and quality control indicators included economic evaluation and the analysis of gender and socio-economic status inequalities. 6 , 43 , 44 This work highlights the strong impact of an organised programme on incidence, stage distribution and survival in CRC cases after completion of the first and second rounds of screening when it achieves complete population coverage in invitations and elevated participation (70% of invited target population). The programme was previously evidenced by means of modelling to be cost-effective, since it both increases quality-adjusted survival rates and delivers savings (because avoided cancer treatment costs are greater than screening costs). 43
Supplemental Material
sj-pdf-1-msc-10.1177_0969141320921893 - Supplemental material for Impact of an organised population screening programme for colorectal cancer: Measurement after first and second rounds
Supplemental material, sj-pdf-1-msc-10.1177_0969141320921893 for Impact of an organised population screening programme for colorectal cancer: Measurement after first and second rounds by Javier Mar, Arantzazu Arrospide, Igor Larrañaga, Maria Luisa Iruretagoiena, Liher Imaz, Ania Gorostiza and Oliver Ibarrondo: on behalf of the ETIS investigators* in Journal of Medical Screening
Footnotes
Authors’ contribution
JM designed the study, analysed the results and wrote the draft of the manuscript. AA, LI and OI planned and executed the statistical analysis and wrote the draft of the methods and results. MLI, IL and AG participated in the design, analysed the results and contributed to the writing of the discussion. All authors reviewed and approved the final text.
Acknowledgements
We are indebted to Xavier Castells for his comments on an early draft of this manuscript. The authors also want to acknowledge the rigorous work of the staff of the Basque Hospital and Population Cancer Registries, which made this study possible, and the editorial assistance provided by Sally Ebeling. We also appreciate the contribution of all the volunteers who participated in the collection of funds from the EITB telemarathon.
Declaration of conflicting interests
The author(s) declared no potential conflicts of interest with respect to the research, authorship, and/or publication of this article.
Funding
The author(s) disclosed receipt of the following financial support for the research, authorship and/or publication of this article: The results reported herein correspond to specific aims of grant BIO15/CA/013/BD to investigator Javier Mar from BIOEF cancer research call funded by the ‘EITB Telemarathon’.
Supplemental material
Supplemental material for this article is available online.
References
Supplementary Material
Please find the following supplemental material available below.
For Open Access articles published under a Creative Commons License, all supplemental material carries the same license as the article it is associated with.
For non-Open Access articles published, all supplemental material carries a non-exclusive license, and permission requests for re-use of supplemental material or any part of supplemental material shall be sent directly to the copyright owner as specified in the copyright notice associated with the article.