
Abstract
Objectives
In colorectal cancer screening, randomized clinical trials have shown a 16% mean reduction in colorectal cancer mortality, but the Finnish randomized health services study showed no effect. We quantified spillover (the total indirect effect caused by the programme on the non-invited) and corrected the effectiveness estimate of the Finnish programme.
Methods
We retrieved from the Finnish Cancer Registry data on all non-invited colorectal cancer patients diagnosed in 1999–2013 in municipalities that adopted screening (n = 18,948). Patients were stratified by three 5-year diagnostic periods and two calendar periods of programme adoption in the municipality of residence. Follow-up ended on 31 December 2013. We measured the spillover effect in patient survival, based on differences of adjusted estimates of the colorectal cancer-related hazard of death between pairs of consecutive diagnostic periods.
Results
The spillover effect was estimated as 9 percentage points (95% confidence interval: −1 to 19 percentage points). It was 13 percentage points in men (−1 to 26 percentage points) and 5 percentage points in women (−9 to 20 percentage points). The corrected effect estimate of implementing screening in Finland was 5 percentage points.
Conclusions
The corrected Finnish effectiveness estimate was consistent with estimates from randomized trials. Indirect effects (spillover) bias the invitee–control contrast. In this case, spillover was an inherent benefit of the Finnish programme.
Introduction
Randomized controlled trials (RCTs) on screening for colorectal cancer (CRC) have consistently shown a CRC mortality reducing the effect, although there has been variation in the size of the effect and in the follow-up time this took to materialize. 1 In the individual trials, the effect estimates ranged from 21% at 10 years of follow-up 2 to 6% at 13 years of follow-up. 3 The average reduction in CRC mortality in the RCTs was estimated as 16%. 1
Randomized controlled trials and the Finnish programme and their effectiveness on colorectal cancer mortality using faecal occult-blood test screening.
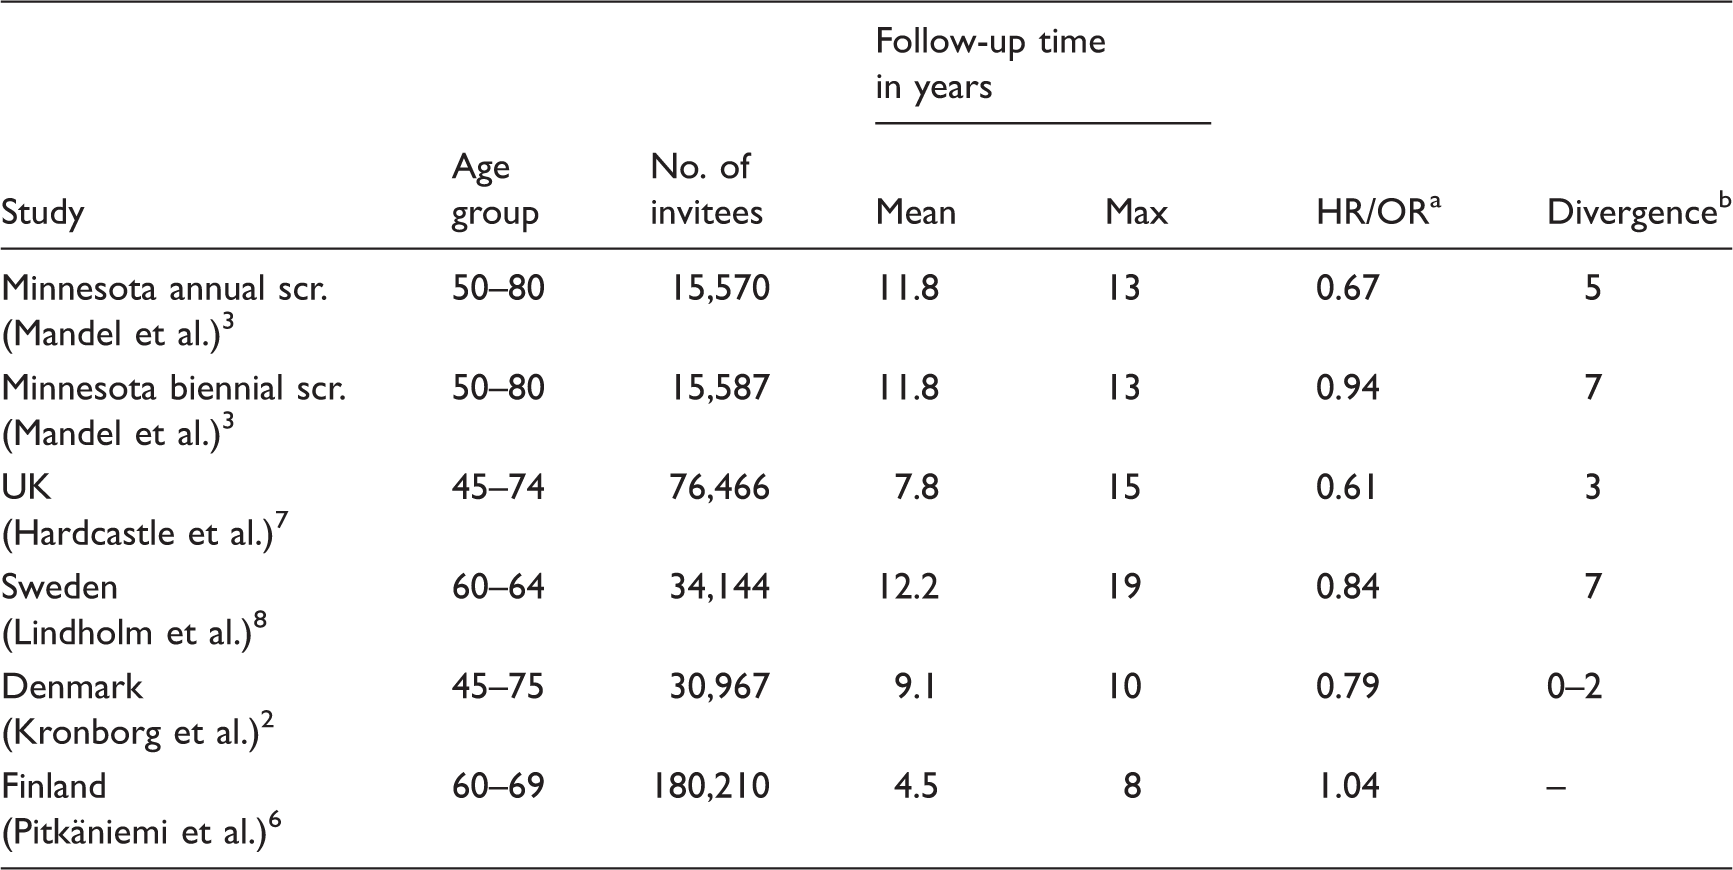
Hazard ratio/odds ratio. All but Hardcastle et al. 7 reported a hazard ratio.
Follow-up time in years before cumulative colorectal cancer mortality in the invited group began to diverge from that in the control group. The follow-up times after which cumulative CRC mortalities began to diverge were approximated from the graphical curves plotted for each study group, and show the times after which a CRC mortality reducing effect began to emerge.
A screening programme can affect persons in the target population via means other than the actual screening process. We here refer to all indirect effects of the programme on the non-invited population as the spillover effect. This includes all changes in attitudes and behaviours of the health personnel and the general population, as well as in the quantity, quality and use of material and human resources that affect the target population.
In our first analysis of the effectiveness of the Finnish CRC screening programme we found no difference in CRC mortality between invitees and controls (HR 1.04). 6 In the current study, we investigated and quantified the spillover effect of the programme, and corrected our previous estimate on effectiveness.
Methods
In the current study, we focused on the non-invited population of municipalities that adopted the programme in 2004–2013. Our data consisted of all CRC patients diagnosed in 1999–2013 who were residents in municipalities that joined the screening programme between 2004 and 2013, and who had not been randomized to the screening arm by the time of diagnosis. Patients were therefore included if they were randomized to the control arm of the programme, or if they were too young or too old be invited for screening. We also included patients randomized to the screening arm who were diagnosed before randomization. The CRC cases were retrieved from the nationwide Finnish Cancer Registry. Patients were categorized by 5-year periods of diagnosis and type of municipality of residence, based on the calendar period of programme adoption. The types of municipalities were early (2004–2008; 132 municipalities) and late (2009–2013; 48 municipalities) adopters of the programme, and the time periods of diagnosis were 1999–2003, 2004–2008 and 2009–2013. The patients were diagnosed before, during or after the period when screening was adopted in the municipality of residence. The two municipality types were well separated, as only 23 of 132 early adopters joined the programme in 2007–2008, and 12 of 48 late adopters joined the programme in 2009–2010. Follow-up started at diagnosis and ended at death, emigration, or on 31 December 2013. The outcome was death from any cause.
To investigate the spillover effect, we defined the crude spillover effect, the period effect and the net spillover effect as follows: The crude spillover effect corresponded to the difference in the excess hazard of death (detailed below) between the two sequential 5-year calendar periods where screening was adopted in the latter period in the municipality. Hence, the crude spillover effect estimates were based on the periods 1999–2003 versus 2004–2008 for early adopters, and 2004–2008 versus 2009–2013 for late adopters. Figure 1 shows the periods of diagnosis by municipality type and the transitions across the periods. The two sequential calendar time periods without a change in adoption status for each municipality type (2004–2008 vs. 2009–2013 for early adopters and 1999–2003 vs. 2004–2008 for late adopters) were used in the same manner to estimate the period effects. The corresponding period effect estimates were then subtracted from the crude spillover effect estimates to yield the net spillover effect estimates.
Colorectal cancer in Finland. Periods of diagnosis by municipality type. Black arrows correspond to transitions where the screening programme is adopted in the subsequent period (crude spillover effect). White arrows denote transitions without change in adoption status (period effect). Shaded boxes correspond to periods of diagnosis when screening was or had been previously adopted. Patient counts of the different strata are reported within the boxes.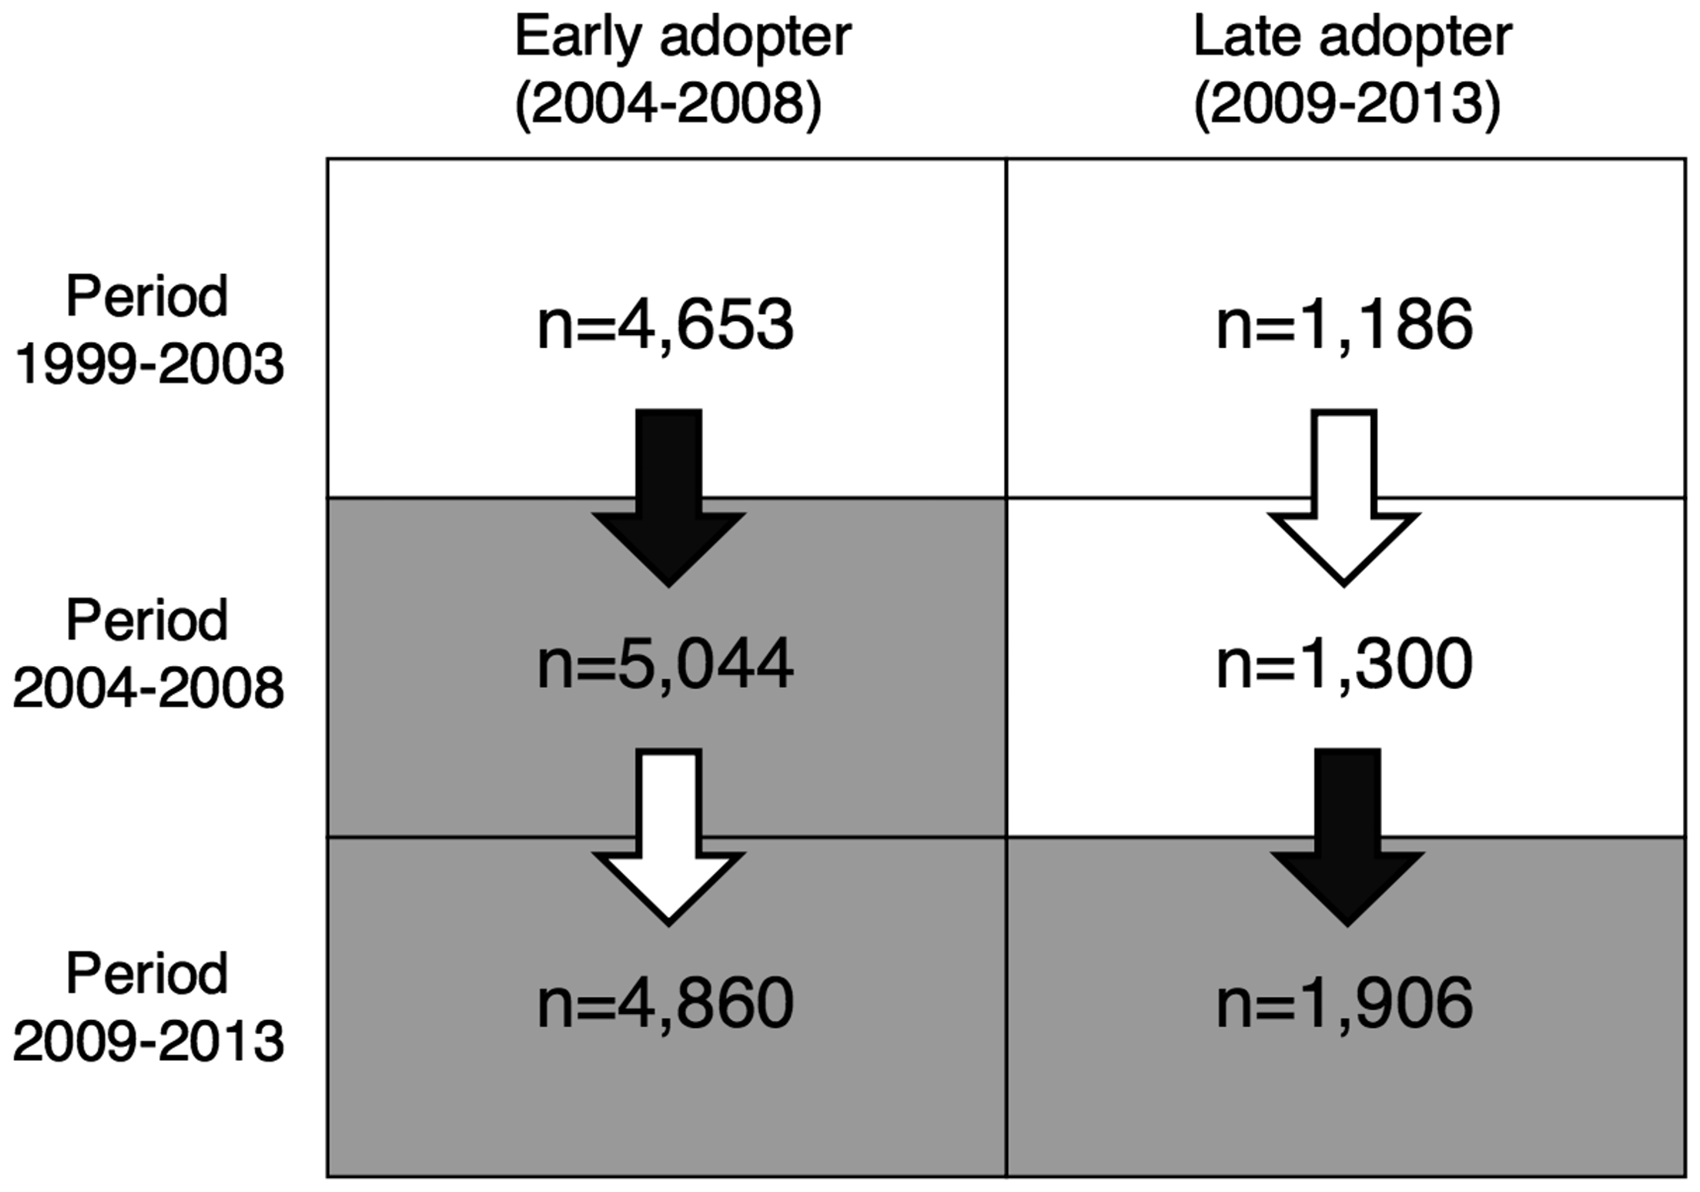
Period and crude spillover effect estimates applicable to the programme as a whole were formed by computing weighted averages of the municipality type-specific effect estimates, where the weights were the counts of patients diagnosed 1999–2013 in each group of municipalities. The average net spillover effect was then the difference between these average period and crude spillover effects. The 95% confidence intervals for all estimates of crude spillover, period and net spillover effects were estimated by the delta method. All effect estimates were derived separately by sex and for both sexes together.
Our spillover effect estimates were derived from estimates of the patient-level hazard of death attributable to CRC. We call this hazard ‘lethality’ to distinguish it from population-level CRC mortality. Lethality was estimated using excess hazard models. Such models use the total hazard of death in patients and the total mortality in the general population to estimate the disease-related hazard of death. 9 Cause-of-death information is therefore not required. Overall mortality rates for the total Finnish population came from Statistics Finland, and were stratified by sex, hospital district, age and calendar year. 10
We fitted flexible parametric excess hazard regression models 9 to estimate the lethality HRs. Two models were fitted by sex and one with both sexes together. The patients diagnosed in 1999–2003 in early adopter municipalities were used as the reference group in each of the three models. Strata defined by the diagnostic periods (1999–2003, 2004–2008 and 2009–2013) as well as the early (2004–2008) and late (2009–2013) adopter municipality types were compared with the reference in each model to estimate HRs. All HR estimates were adjusted for age using the age groups 0–49, 50–59, 60–61, 62–63, 64–65, 66–67, 68–69, 70–74, 75–79, 80–89 and 90 + . The model with both sexes was additionally adjusted for sex. For comparability between the 5-year calendar time periods, follow-up was censored at 5 years when fitting the models. The excess hazard models were fitted using the rstpm2 package (version 1.3.2 11 ) for the R software environment (version 3.2.3 12 ).
For visualization of the results, we fitted relative survival curves using the age-adjusted Ederer II method.13,14 The estimates were adjusted for age by the age groups 0–59, 60–64, 65–69, 70–74, 75–79 and 80 + using the age distribution of all patients diagnosed in 1999–2003 (before randomization). Estimation was stratified by municipality type and 5-year period of diagnosis (1999–2003, 2004–2008 and 2009–2013). The package popEpi (version 0.2.1 15 ) was used to estimate the survival curves.
Results
Our data included 9519 male and 9430 female CRC patients (Figure 1), with 4558 and 4370 deaths from any cause, and 24,660 and 25,028 total years of follow-up accrued in men and women, respectively.
Estimates of excess hazard ratios of death (lethality ratios) for non-invited patients of the Finnish colorectal cancer screening programme.
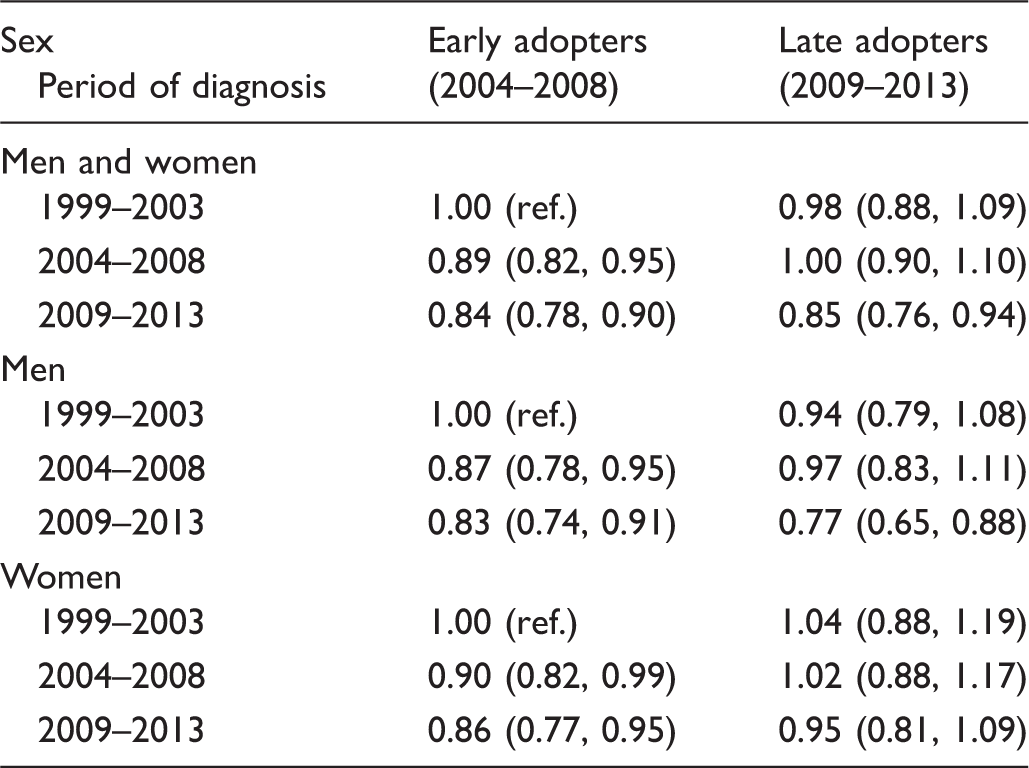
Note: Hazard ratios with 95% confidence intervals are shown by sex, municipality type and 5-year period of diagnosis. Patients diagnosed in 1999–2003 in early adopter municipalities were chosen as the reference in each model.
Patient counts and estimates of the spillover effect of the Finnish colorectal cancer screening programme with 95% confidence intervals by sex and municipality type.
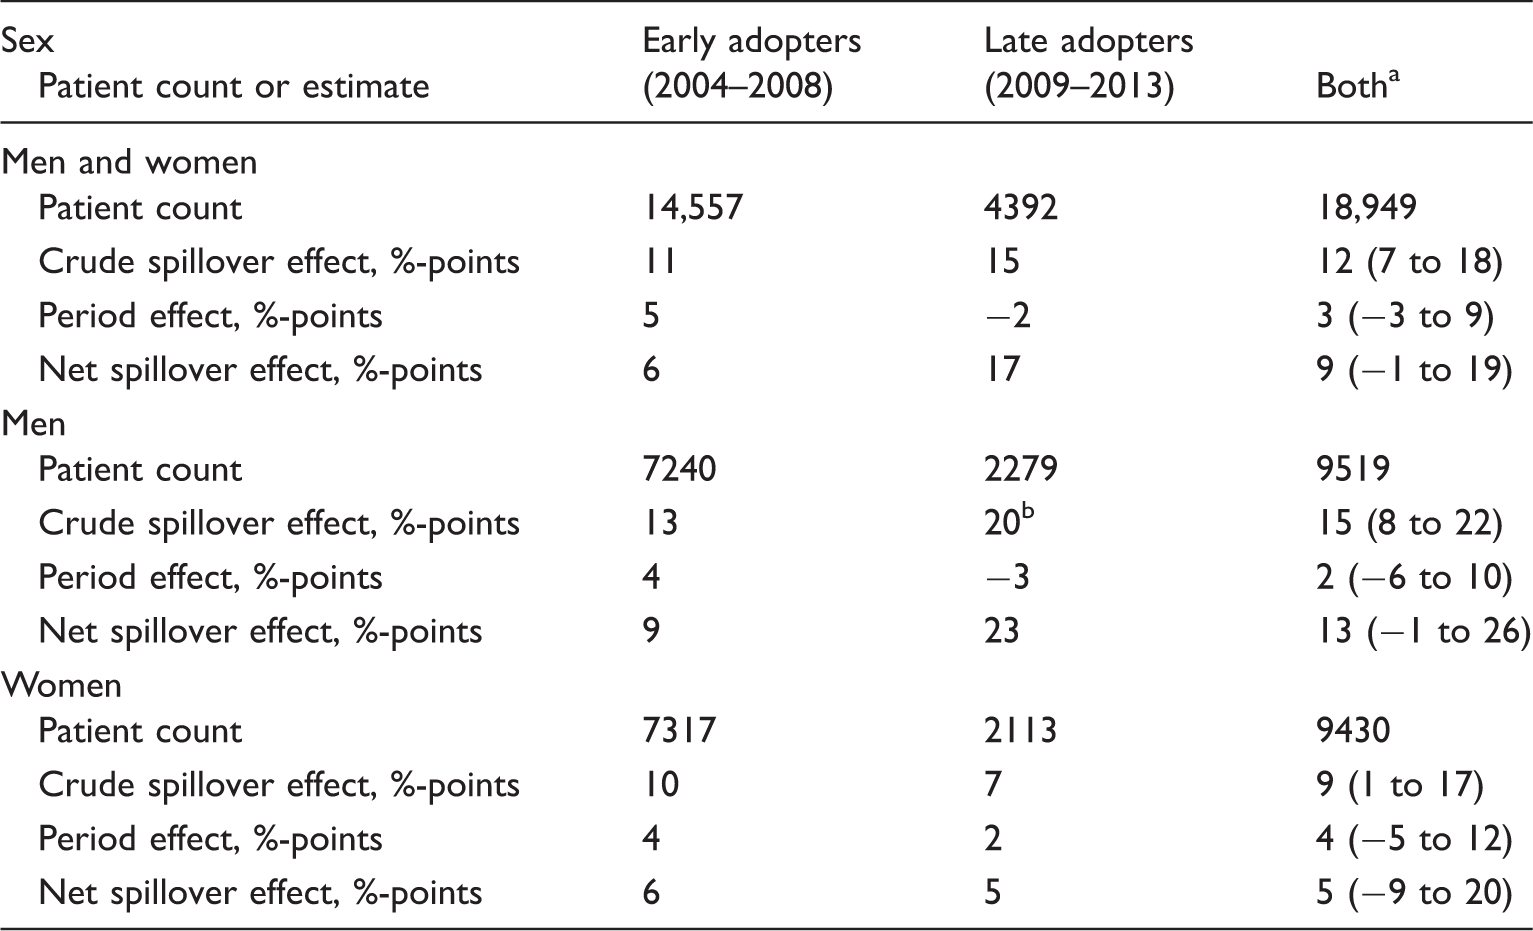
Note: %-points (percentage points) are differences of excess hazard of death between periods of diagnosis. Based on excess hazard ratios of death (see Table 2) with the persons diagnosed in the period 1999–2003 in early adopter municipalities as the reference group.
Here, the patient counts are the counts for early and late adopters added together. The effect estimates are weighted averages based on the municipality-type-specific effect estimates and patient counts. For example, the weighted average crude spillover effect for men and women is 14,557/18,949 × 11 + 4,392/18,949 × 15 = 12. The average net effect is the difference between the average crude spillover effect and average period effect.
As an example, the crude spillover effect for men from late adopter municipalities was calculated as the difference in excess hazard of death between the periods 2004–2008 and 2009–2013 (0.97–0.77 = 20 percentage points – see Table 2).
Relative survival curves for the three 5-year periods (1999–2003, 2004–2008 and 2009–2013) for early and late adopter municipalities are presented in Figure 2. There was practically no difference in survival between the three groups of patients when screening had not yet started in the municipality (1999–2003 for both early and late adopters, and 2004–2008 for late adopters). Early adopters showed a larger improvement in survival between the first two periods, whereas late adopters gained an improvement in survival only in the period of programme adoption (2009–2013).
Colorectal cancer in Finland. Relative survival curves for subjects not invited to screening and diagnosed with colorectal cancer in early (black) and late (grey) adopter municipalities during the periods 1999–2003 (solid lines), 2004–2008 (dashed lines) and 2009–2013 (dotted lines).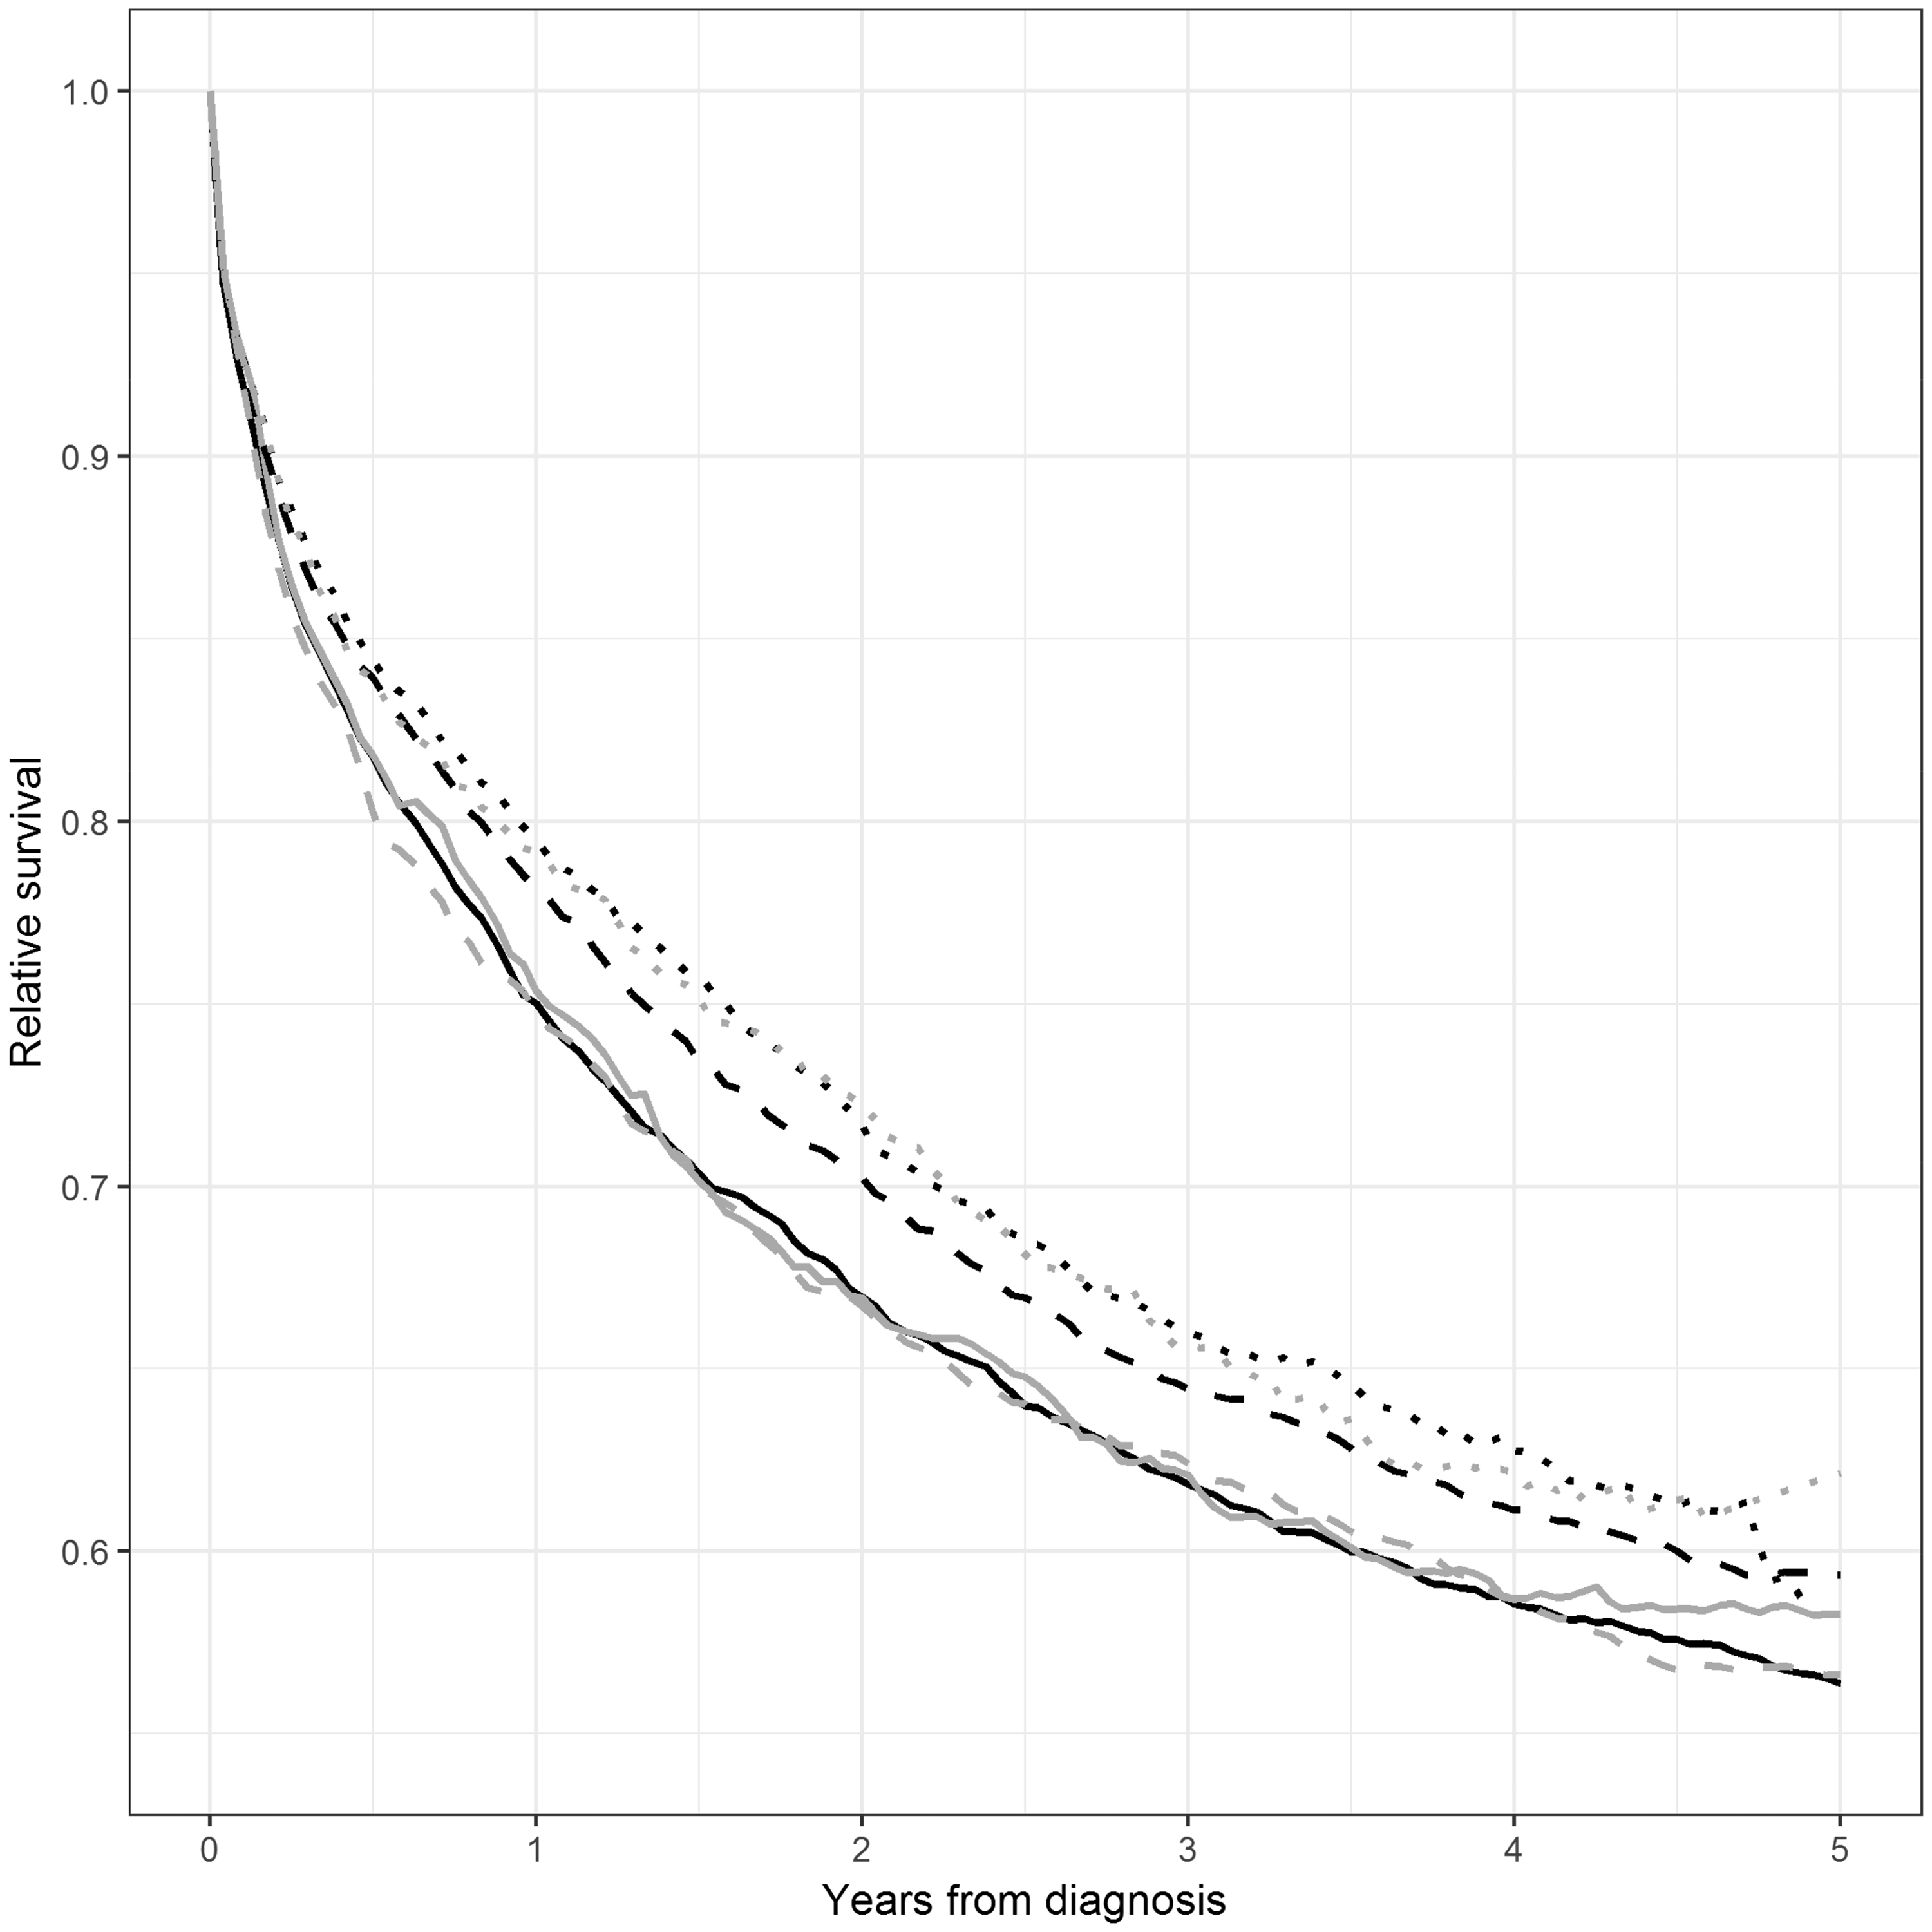
Discussion
The Finnish study on CRC screening was an RHS study, 6 where municipalities decided autonomously whether to adopt the programme. Adoption of the programme in the municipality was associated with indirect benefits for the non-invited population. After adjusting for the trend of improvement in lethality (CRC-related hazard of death in patients) over calendar time, we found a 9 percentage point average difference in lethality in adopter municipalities between adoption and pre-adoption periods. This effect was larger in men than in women (13 vs. 5 percentage points). Because of this indirect benefit, no difference in CRC mortality was observed between the randomized arms in our previous study. 6 When the spillover effect is taken into account, the Finnish RHS result of 5 percentage points CRC mortality reduction at 4.5 years is consistent with RCTs of 16% at about 10 years. 1
The current study has a unique design. Estimating the spillover effect was possible because, unlike RCTs, the Finnish RHS was nested in the general health services. Our analyses were based on non-invitees to the programme, so our estimates are not confounded by the direct screening effect. The analyses were based on a large number of patients (n = 18,948), with no losses to follow-up, because of linkage to Central Population Register data for death and emigration. The patient data were also population-based, and had high coverage (the estimated coverage of Finnish Cancer Registry data is 97.4% for colon, rectum and anus). 16
The age distribution of patients was slightly different in the present study from that in our earlier paper. 6 We additionally focused on the non-invited, and measured lethality in patients, as opposed to population-level mortality as in our previous study. 6 We also could not specify all the mechanisms through which spillover operates, and could not separately quantify the impacts of even the known determinants of survival. However, none of these limitations affects our conclusion. Survival is a valid indicator because screen-detected cases with lead time bias were excluded. The final outcome of death is more conclusive than any of the intermediate indicators.
The current study is observational, as we simply compared lethality estimates of different calendar time periods. Despite the observational design, our results were likely not confounded by indication, as it is unlikely that the decision to adopt the programme in the municipality was correlated with the trend of survival improvement. Confounding by other changes in survival is likely to be small, as municipalities adopted the programme independently and over a long time period. Because we used three instead of two diagnostic periods, our spillover estimates are more stable and less biased in the event of nationwide changes in survival.
The indirect effects of screening and other health care interventions are referred to as contamination, spillover 17 and the halo effect, 18 as well as other terminology. This includes even the placebo effect. Whether the effect is a confounder or a genuine part of the intervention depends on the specific purpose of the study. Contamination and other indirect effects should be taken into account when investigating the effect of an intervention by comparing invitees with controls. At the same time, in a public health policy the indirect effects are an inherent part of the overall effectiveness of the programme. Indirect effects caused by health insurance policies in the USA have received substantial attention in the literature and are called spillover effects. 17 Indirect effects have also been shown to operate in screening for neuroblastoma in infants in Quebec (materializing as increased non-screening findings) 18 and among those attending a colonoscopy following a positive FOBT in the UK CRC screening pilot (arising as changes in smoking, exercise and nutrition behaviour). 19 While our aim was to evaluate spillover with regard to the final outcome (CRC-related death), we note that preliminary inspection of annual colonoscopy use in controls in 1999–2013 indicates an upward trend starting from 2004, with men starting from a lower level of colonoscopy use and gaining on women over the years (Suvi Mäklin, personal communication, May 2017). To our knowledge, the current study is the first to evaluate spillover in the context of effectiveness of an RHS, here measured in patient survival.
In the Finnish RHS, the sensitivity of screening using the guaiac FOBT was reported to be 54.6%, 20 which is in line with other screening trials2,7 and is therefore unlikely to have been instrumental to the HR of 1.04, indicating no effect. 6 Several other factors have been suggested as contributors to the finding. 6 For example it is to be expected that, the higher the survival when the programme is initiated, the more difficult it is to achieve additional reductions in mortality. For the Swedish 8 and Danish 2 trials, the initial survivals were 43% and 39%, as measured by survival in all Swedish patients diagnosed in 1979–1983 and all Danish patients diagnosed in 1984–1988, respectively. 21 In Finland, survival was 45% and 58% for patients diagnosed in 1979–1983 and 1999–2003, respectively. 21 Achieving the screening effect of 16% 1 has become more difficult in Finland over time due to marked improvements in CRC survival over time. However, our present estimate of 5 percentage points reduction in CRC mortality is consistent with the RCTs, given the average of 4.5 years of follow-up.
All RCTs had also substantially longer mean follow-up times (the shortest was 7.8 years 7 ) than the Finnish RHS (4.5 years). Additionally, in the Swedish trial 8 and the Minnesota biennial screening group, 3 an effect began to emerge after 7 years of follow-up. These facts suggest longer follow-up, but in the presence of spillover no amount of additional follow-up will secure an unbiased comparison of invitees with controls.
In our terminology, the spillover effect includes all changes in attitudes and behaviours of the health personnel and the general population, as well as in the quantity, quality and use of material and human resources that affect the target population. However, in the present study, we estimated spillover with regard to the final outcome of CRC related death, and not the changes in specific factors such as colonoscopy resources. Our study cannot disclose all the possible causes for the spillover effect, but several factors have made improvements to the patient pathway. For example a heightened awareness of CRC among medical personnel and the public might lead to earlier diagnostics in the symptomatic. Adopting a screening programme is also likely to lead to an increase in diagnostic and treatment resources, which would benefit all CRC patients alike.
The Finnish screening study was nested in the general health services as an RHS, which makes the spillover credible, although the confidence interval of our main result (9 percentage points reduction in lethality) marginally overlapped with zero.
Individual randomization was performed in the Finnish programme. Controls had the same access to health care as invitees, so randomization of municipalities instead of individuals would probably have resulted in less spillover. A cluster-based design, using organizational units with homogenous patient pathways, should therefore be considered in future screening programmes nested in the general health services. Additionally, a staggered entry design, similar to that performed in Finland, 5 is recommended. This gives health care providers time to adapt to the new task.
In the first evaluation of the Finnish RHS, we found a 12% reduction in CRC mortality in men but a 33% increase in women when invitees were compared with controls. 6 In the present study, we found a larger spillover effect in men (13 percentage points) than in women (5 percentage points). Therefore, the difference between men and women was increased. We currently have no explanation for the difference.
Conclusion
The comparison of invitees with controls in the Finnish CRC screening programme resulted in a 4% increase in CRC mortality at a maximum follow-up of 8 years. 6 After correcting for the spillover effect of 9 percentage points, we derived an estimated net reduction of 5 percentage points (9 − 4 = 5). This is the corrected effect estimate on the invitees of the programme that resulted from adopting screening in the municipality. The corrected estimate was consistent with that from randomized screening trials. Although indirect effects in controls bias the invitee–control contrast, our results indicate that spillover was an inherent benefit of the Finnish programme.
Footnotes
Declaration of conflicting interests
The author(s) declared no potential conflicts of interest with respect to the research, authorship, and/or publication of this article.
Funding
The author(s) received no financial support for the research, authorship, and/or publication of this article.