
Abstract
Objective
Over the last decade, cervical intraepithelial neoplasia (CIN) detection has increased in the Netherlands. We investigated the underlying mechanism by quantifying the increase, and analyzing patterns of CIN and cervical cancer detection over time.
Methods
We observed annual CIN and cervical cancer detection rates (DRs) per 10,000 primary smears within the Dutch screening programme for 2000–2011. Joinpoint analyses were performed to determine changes in time trends, logistic regression analyses to assess the relative risk of calendar time on histological outcomes, adjusted for demographic factors and type of primary cytology test used.
Results
Trends of increased detection occurred for all CIN grades (ie. DRs increased from 17.8 to 36.1, from 21.0 to 35.5, and from 43.4 to 64.6 for CIN I, II, and III from 2003 to 2009). After adjusting for demographic factors, DRs were still 2.11 (95% confidence interval (CI): 1.95, 2.29), 1.79 (95% CI: 1.66, 1.92) and 1.59 (95% CI: 1.50, 1.67) times larger in 2009. When also adjusting for the type of cytology test, DRs were 1.90 (95% CI: 1.62, 2.22), 1.48 (95% CI: 1.22, 1.79) and 1.55 (95% CI: 1.39, 1.73) times larger. No trends in cervical cancer DRs were found.
Conclusions
The implementation of liquid-based cytology contributed to the CIN increase. If some of these extra detected CIN are regressive this leads to overdiagnosis. Other factors, such as an increased cervical cancer risk, and implementation of imaging-assisted reading, could also have contributed.
Introduction
Cervical intraepithelial neoplasia (CIN) is considered a preclinical precursor of cervical cancer and is graded (CIN I, II and III) by the severity of the dysplasia.1,2 The long total duration of the detectable preclinical dysplastic stage (ie. more than 10 years on average3–5) means that screening is an appropriate approach for cervical cancer prevention. A national cervical cancer screening programme has existed in the Netherlands since the 1980s, with women aged 30--60 invited every 5 years since 1996. Despite its limited sensitivity, 6 cytology is still utilized as the primary screening and triage test. After a borderline or mildly dyskaryotic (BMD) result (ie. corresponding to ASC-H of the Bethesda classification), women are invited for triage cytology tests six (with or without high-risk human papillomavirus (HPV) testing) and 18 months later (see Appendix for a detailed triage protocol). For a worse result (ie. >BMD), women are immediately referred to a gynaecologist. According to the guidelines, CIN II and III are always treated, while CIN I is only treated when persistent. 7 The Dutch screening programme achieves a cervical smear coverage of almost 80%. 8
During the last decade, CIN detection rates (DRs) have rapidly increased in the Dutch screening programme. 8 It is important to reveal the underlying mechanism, so that possible adjustments to the screening programme can be made to ensure its effectiveness. We therefore quantified the increase in CIN DRs, unadjusted and adjusted for differences in demographic factors and types of cytology tests used over time. In addition, we analyzed patterns of CIN detection by age, screening region, and the cytological classification of smears. Furthermore, we studied cervical cancer DRs and the cytological classification of smears over time.
Methods
Data collection
Information on all cervix uteri cytological and histological tests in the Netherlands registered from January 2000 until March 2013 were retrieved from the nationwide network and registry of histology and cytopathology (PALGA). 9 Women were invited every 5 years in the year they turned 30, 35, ., 60 so that attendance occurs in age groups 29–33, 34–38,…, 59–63. These women are identified through their birth date and the first eight letters of their (maiden) family name. This identification code enables linkage of the woman’s tests, allowing us to follow individual screening histories. We identified primary smears (ie. first smear of an episode) taken within the national screening programme between January 2000 and December 2011, which ensures a minimum follow-up of 15 months after a primary smear. Histologically confirmed CIN lesions or cervical cancer cases following primary smears were identified by selecting all PALGA records that included corresponding pathology codes. Detection of these conditions was assigned to the calendar year of the primary smear. Age was defined as the age at the primary smear, and was categorized as: 29–33, 34–38, … , 59–63. The cervical cancer screening programme is organized by five different organizations, each accounting for a geographical region (ie. screening region) (North, South-West, Middle-West, South, and East). Screening regions were coded corresponding with the place of residence at the time of the primary smear. Women were stratified to low, intermediate or high socio-economic status (SES) according to their status score, which is an ecological variable based on the four-digit postal code of the woman's place of residence at the time of the primary test.10 Status scores per four-digit postal code were provided by the Netherlands Institute for Social Research based on 1) mean income, 2) percentage of households with a low income, 3) percentage of households with, on average, a low education, and 4) unemployment rate in 2010. These variables were merged into one score (ie. status score) by a principal components analysis. Low SES corresponded with a status score lower than −1 (ie. average status score minus standard deviation), intermediate SES with a score of ≥−1 and ≤1, and high SES with a score higher than 1 (ie. average status score plus standard deviation). The type of primary cytology test used (ie. conventional cytology, SurePath, or ThinPrep) was based on the date of the primary smear, the laboratory involved, and the date of conversion from the laboratory. This conversion date was retrieved from the laboratories and fixed to one of the quarters per year, as most laboratories had a phase in-phase out transition period of 2–4 months, and this information was linked to PALGA as a proxy for which type of primary cytology test was used.
Statistical analyses
Annual CIN and cervical cancer DRs were calculated as the number of diagnoses per 10,000 primary smears, allocated to the calendar year of the primary smear, unstratified and stratified by cytological classification (ie. BMD or >BMD). CIN was defined as all histological neoplastic lesions in the cervix similar to CIN I, CIN II or CIN III, including glandular neoplasia (such as adenocarcinoma in situ). The annual rate of smears classified as BMD and >BMD were also calculated.
Joinpoint analyses were performed to identify time trends, using the Joinpoint Regression Programme (version 4.0.4.) from the Statistical Research and Applications Branch of the US National Cancer Institute. 11 Annual percent changes (APCs) with their corresponding 95% confidence intervals (CIs) were calculated by fitting a regression line to the natural logarithm of the rates, using calendar time as independent variable (ie. y = ax + b where y = ln(rate) and x = calendar year, then APC = 100 * (e^a-1)).
We performed logistic regression analyses to examine whether the rate of smears classified as BMD or >BMD increased over time (ie. for the period depicted by joinpoint analysis), unadjusted and adjusted for differences in demographic factors (ie. age, screening region, and SES) and differences in types of cytology tests used over time. As the effect of the type of primary cytology test used could differ between age groups 12 and laboratories, we included two-way interaction terms between the type of primary cytology test and age, and between the type of primary cytology test and screening region (ie. as proxy for the laboratories involved). Similar analyses were performed to assess whether CIN and cervical cancer DRs increased over time. Missing values were imputed with 10 multiple imputations for the type of primary cytology test used, screening region, and SES (ie. 15.2% of the cases had one or more missing values). The odds ratio (OR) was interpreted as relative risk if the prevalence of the outcome was <10%. 13 The software programme SPSS (version 20) was used to perform statistical analyses.
Results
Out of 6,470,400 primary cytology tests in the screening programme from 2000 to 2011, there were 16,837 CIN I (26.0 per 10,000 primary smears), 17,193 CIN II (26.6 per 10,000 primary smears), 34,380 CIN III (53.1 per 10,000 primary smears) and 2,180 cervical cancer (3.4 per 10,000 primary smears) diagnoses.
The average CIN I DR decreased from 2000 to 2004 by 6.3% (95% CI: -10.7, -1.6) per year (Figure 1), followed by an average increase of 15.7% (95% CI: 10.7, 20.9) per year from 2004 to 2009. CIN II DRs increased from 2000 to 2005 by 3.8% (95% CI: 1.4, 6.3) annually, and from 2005 to 2009 by 11.8% (95% CI: 6.9, 16.9). Average CIN III DRs decreased by 5.6% (95% CI: -10.6, -0.3) from 2000 to 2003, then increased by 6.6% (95% CI: 4.2, 9.1) per year from 2003 to 2009. From 2009 onwards, no significant annual changes were detected for all CIN grades. There were no significant trends for cervical cancer detection over the studied period (APC of 1.2 (95% CI: -0.3, 2.8)).
Trends in crude CIN and cervical cancer detection rates as observed in the national screening programme.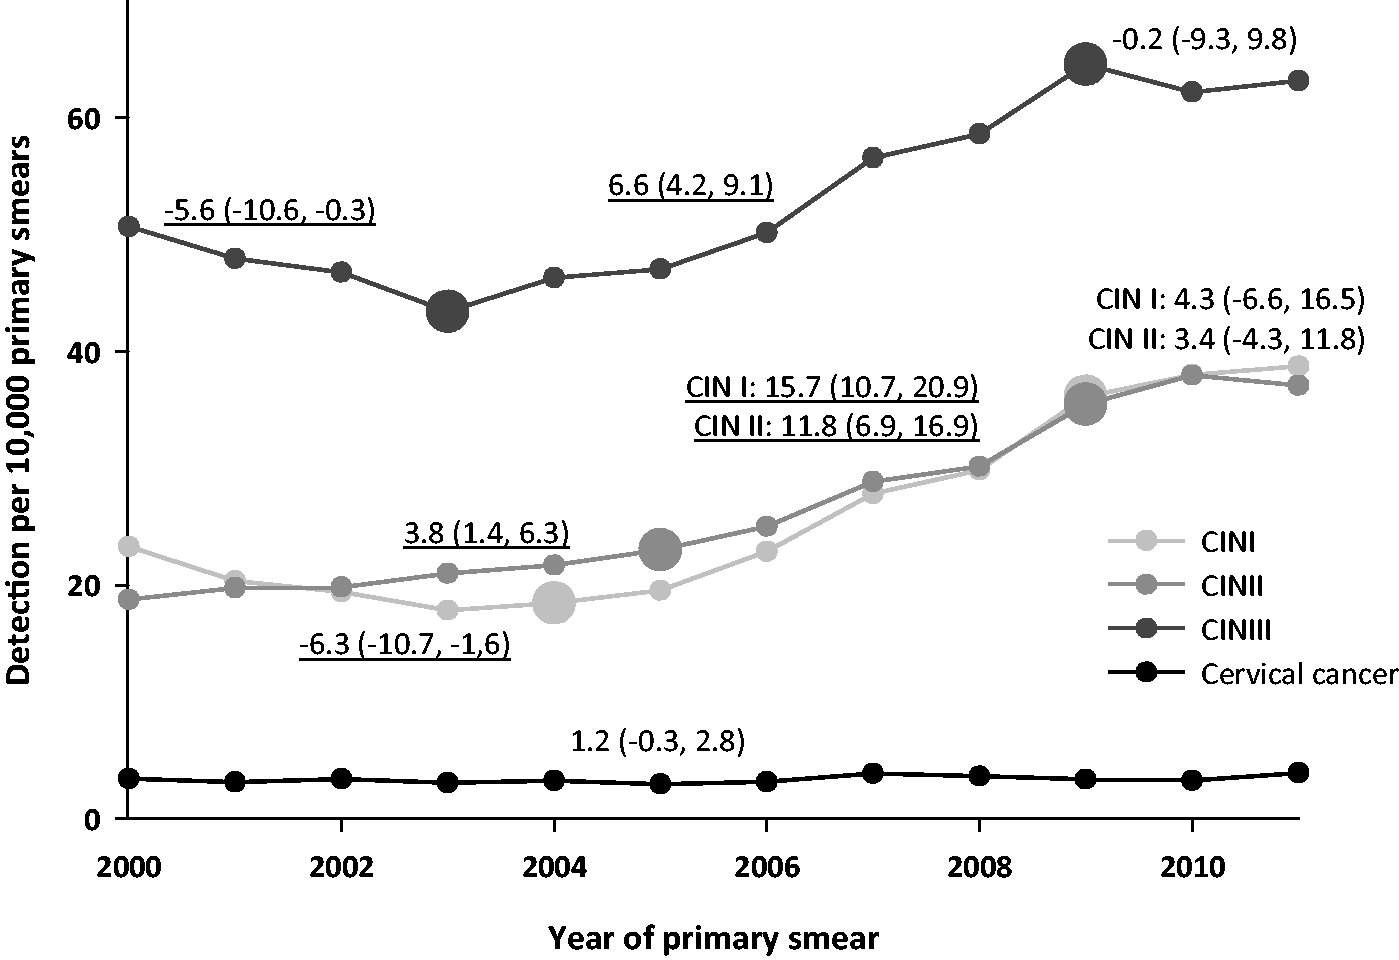
Relative risk of CIN I, CIN II, CIN III and cervical cancer in 2009 compared with 2003, unadjusted and adjusted for confounding factors.
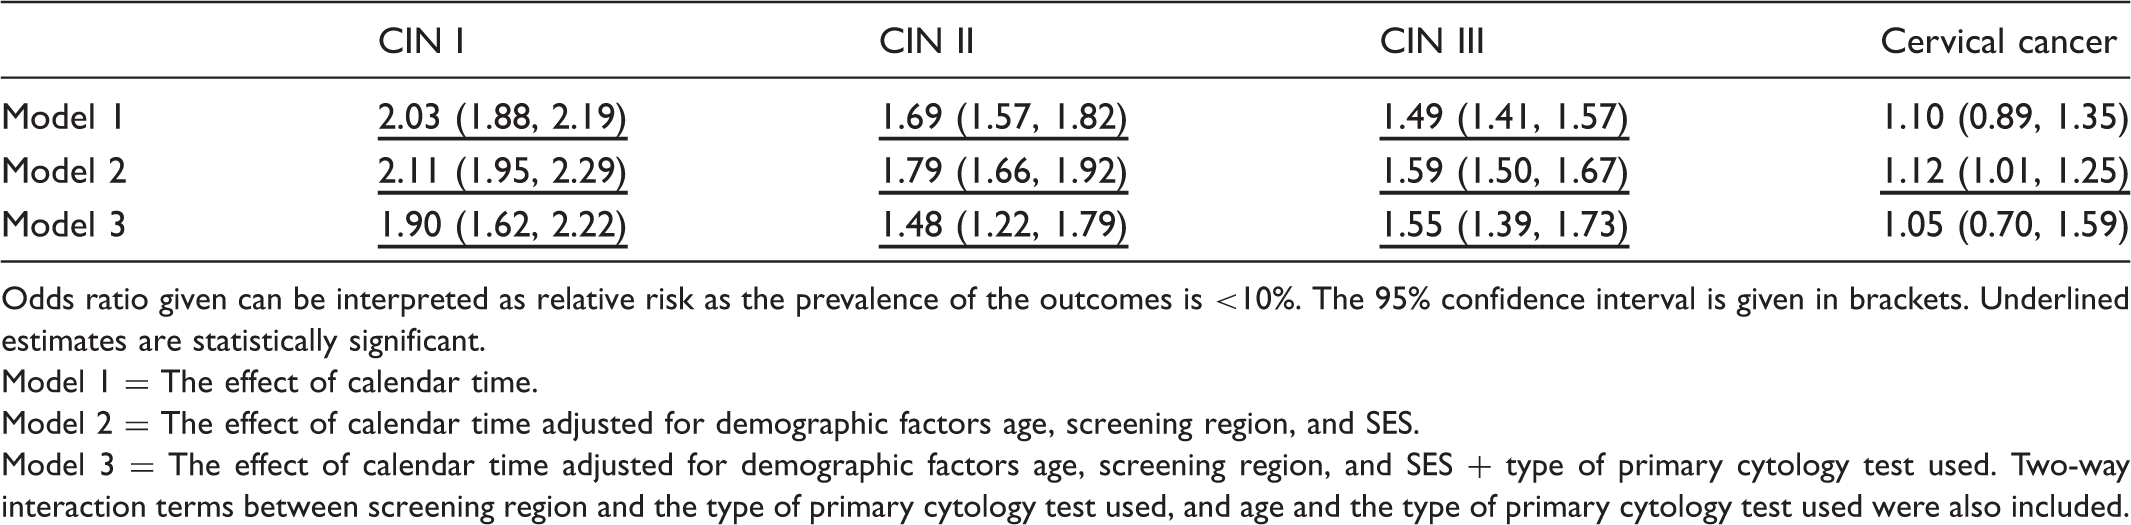
Odds ratio given can be interpreted as relative risk as the prevalence of the outcomes is <10%. The 95% confidence interval is given in brackets. Underlined estimates are statistically significant.
Model 1 = The effect of calendar time.
Model 2 = The effect of calendar time adjusted for demographic factors age, screening region, and SES.
Model 3 = The effect of calendar time adjusted for demographic factors age, screening region, and SES + type of primary cytology test used. Two-way interaction terms between screening region and the type of primary cytology test used, and age and the type of primary cytology test used were also included.
Relative risk of CIN I, CIN II, and CIN III in 2009 compared with 2003, per age group and screening region.
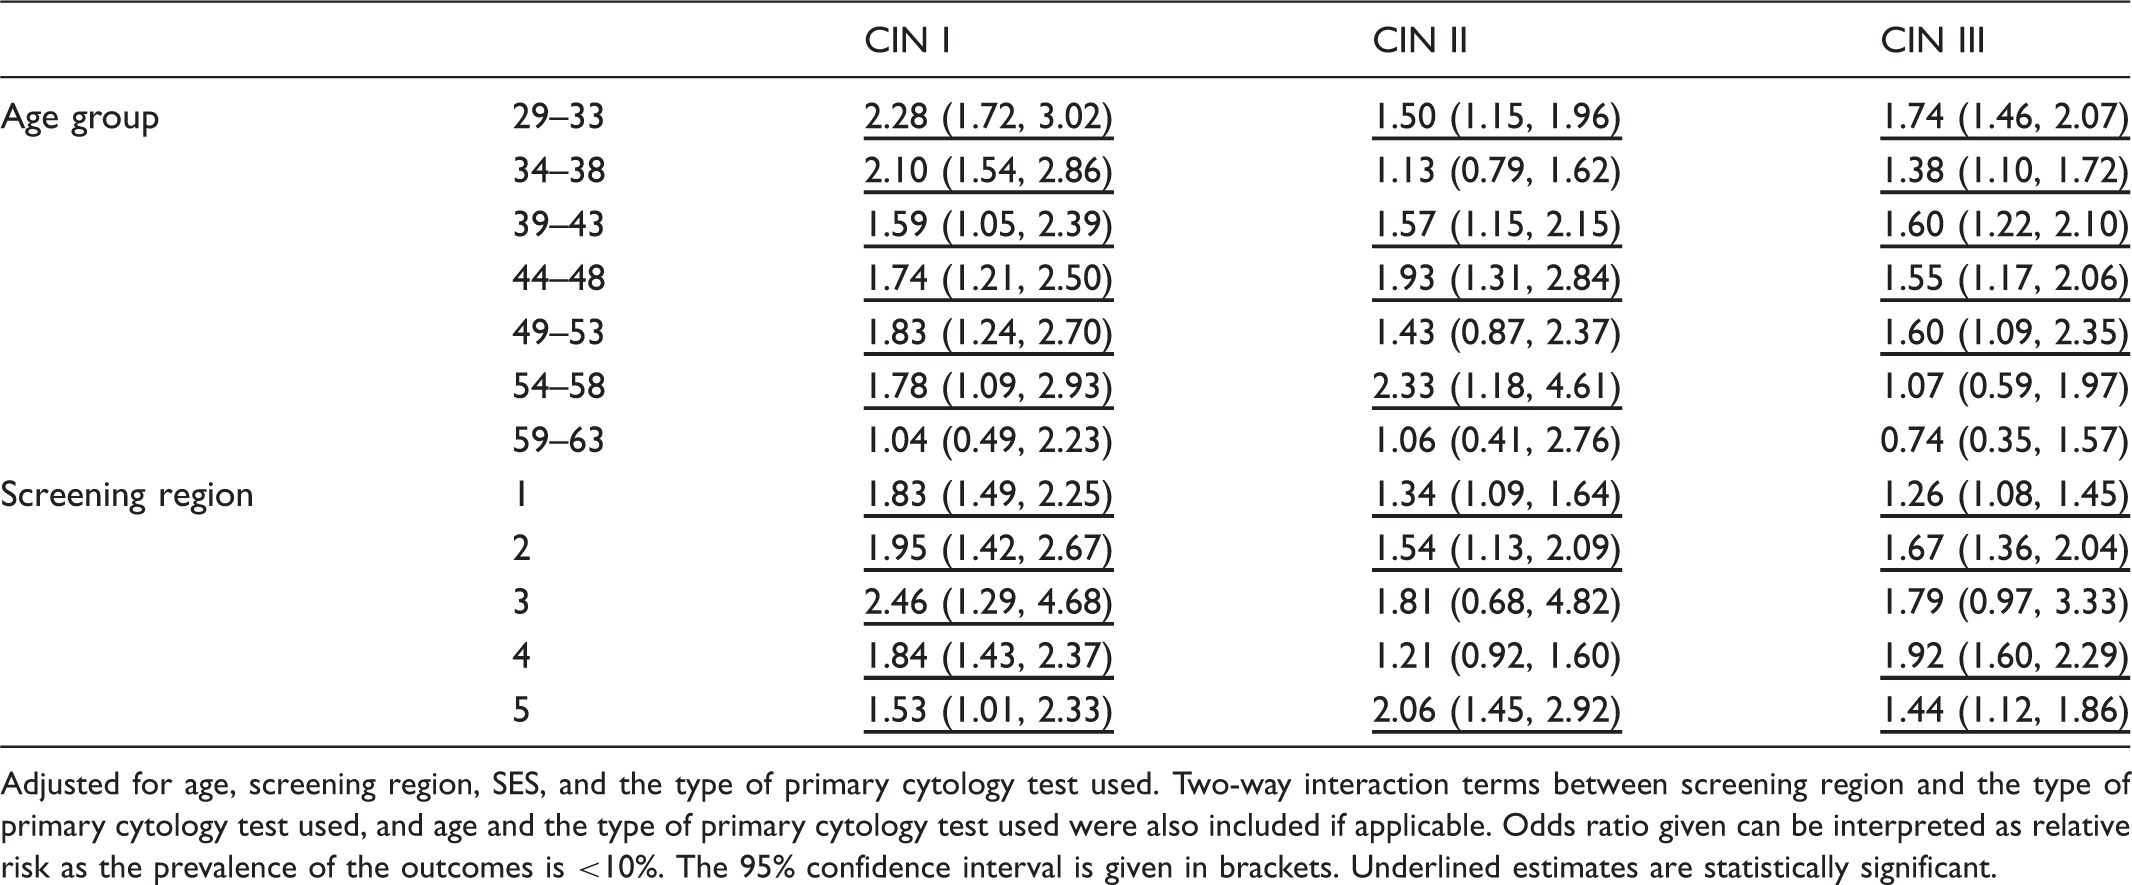
Adjusted for age, screening region, SES, and the type of primary cytology test used. Two-way interaction terms between screening region and the type of primary cytology test used, and age and the type of primary cytology test used were also included if applicable. Odds ratio given can be interpreted as relative risk as the prevalence of the outcomes is <10%. The 95% confidence interval is given in brackets. Underlined estimates are statistically significant.
When restricting analyses to CIN detected via triage, trends of increased CIN I, CIN II, and CIN III detection occurred over time (Figure 2a). After adjustment for confounders, the probability of a CIN I, II, or III diagnosis was 1.94 (95% CI: 1.62, 2.32), 1.56 (95% CI: 1.25, 1.96), and 1.76 (95% CI: 1.44, 2.15) times higher in 2009 compared with 2003 (data not shown). The detection of cervical cancer via triage did not increase over time (OR of 0.69 (95% CI: 0.21, 2.27)). The increase in CIN detected via triage was mainly explained by a 77% increased probability of primary smears being classified as BMD (OR of 1.77 (95% CI: 1.59, 1.98)) (data not shown - see Figure 3 for BMD DRs per year and results of the joinpoint analysis). A BMD smear did not lead to a significant change in CIN I (OR of 1.11 (95% CI: 0.95, 1.30)), CIN II (OR of 0.84 (95% CI: 0.69, 1.03)), or CIN III DRs (OR of 0.99 (95% CI: 0.80, 1.23)) (data not shown).
Trends in crude CIN and cervical cancer detection rates as observed in the national screening programme via A) triage (indirect referral to the gynaecologist) or via B) direct referral to the gynaecologist. Trends in crude abnormal cytological detection rates (BMD and >BMD) as observed in the national screening programme.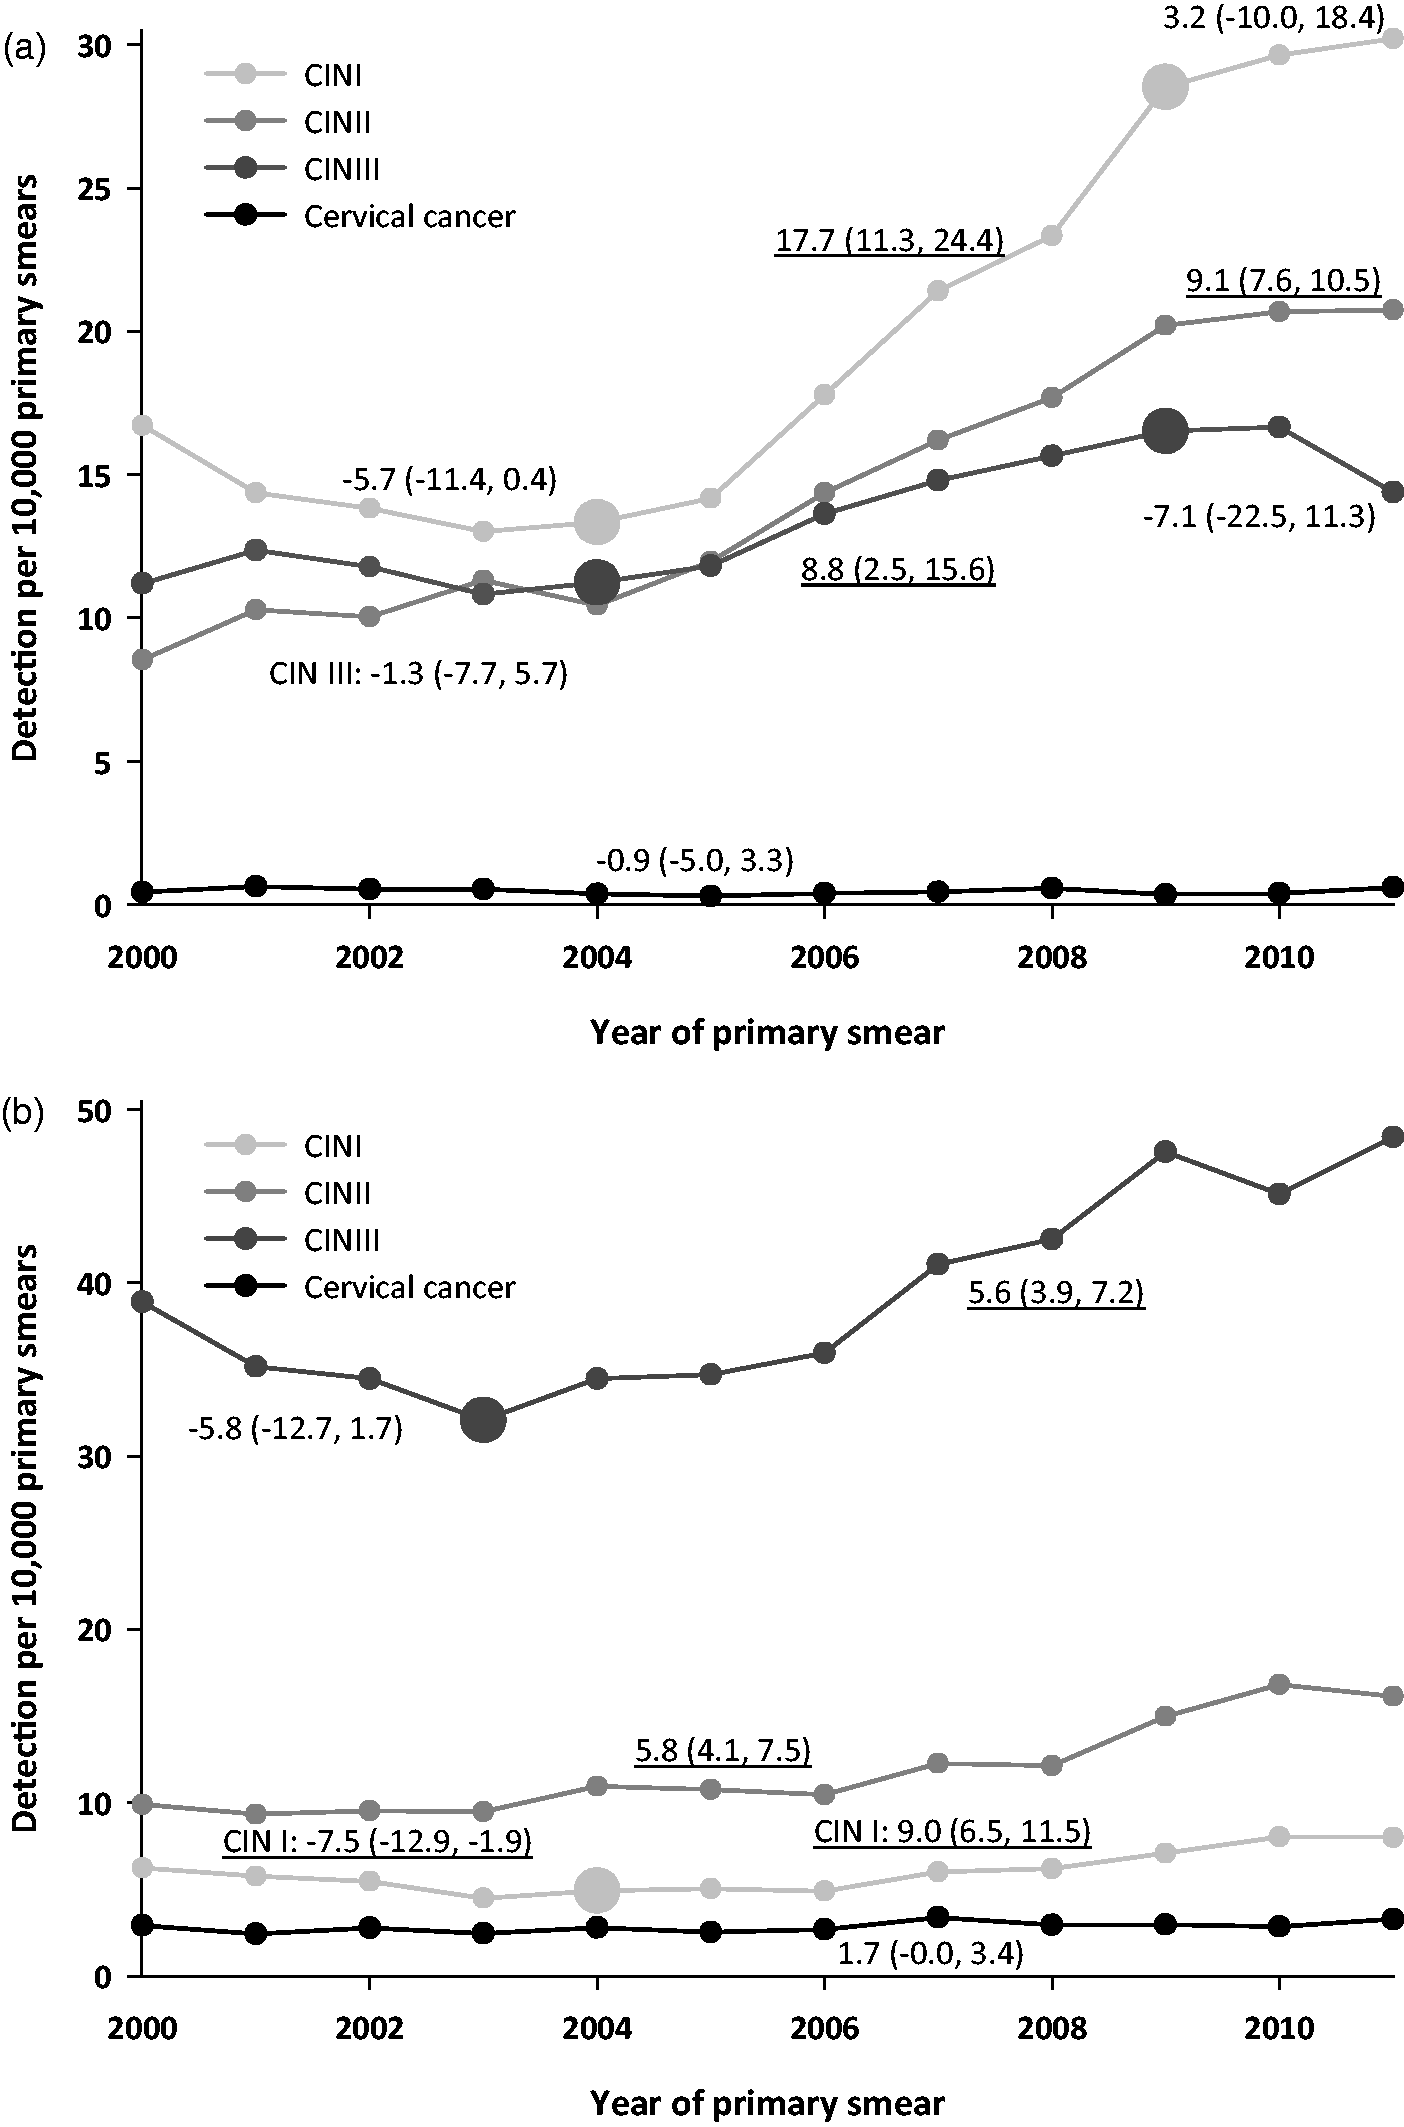
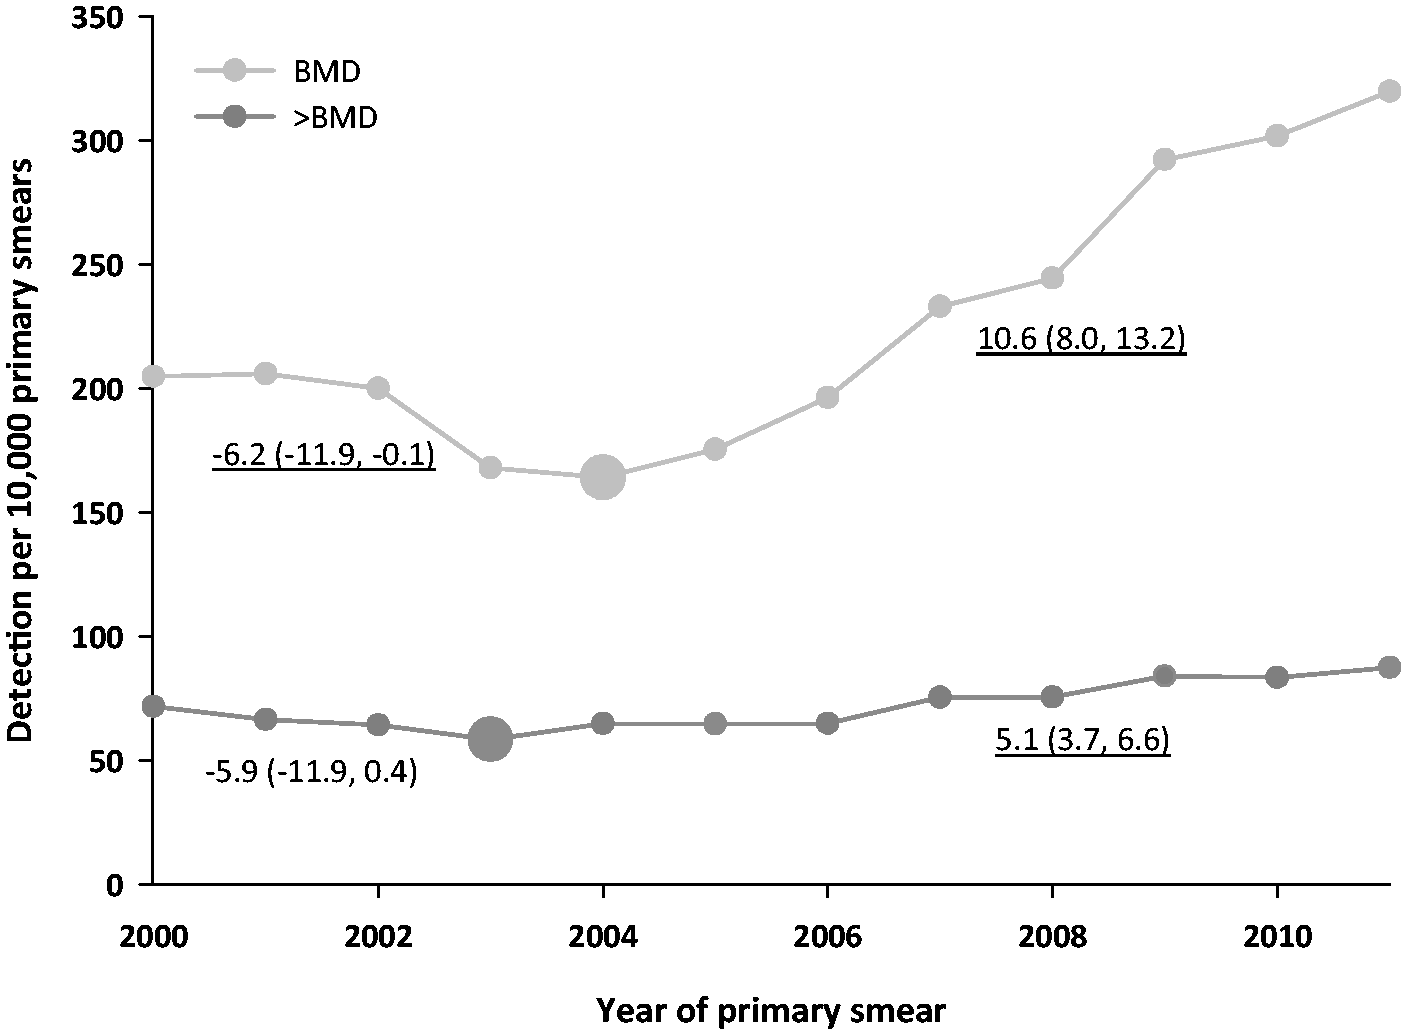
Restricting analyses to CIN detected via direct referral yielded similar results. Trends of increased CIN I, II, and III detection occurred (Figure 2b). The probability of being diagnosed with CIN I, II, or III increased from 2003 to 2009 (ORs of 1.66 (95% CI: 1.26, 2.20), 1.33 (95% CI: 1.04, 1.71), and 1.47 (95% CI: 1.30, 1.67) respectively), but the probability of being diagnosed with cervical cancer was unaffected (OR of 1.06 (95% CI: 0.68, 1.65)) (data not shown). The increase in CIN detected via direct referral was mainly explained by a 41% increased probability of primary smears being classified as >BMD (OR of 1.41 (95% CI: 1.27, 1.58)) (data not shown – see Figure 3 for >BMD DRs per year and results of the joinpoint analysis). A >BMD smear did not lead to increased CIN I (OR of 1.19 (95% CI: 0.89, 1.58)), CIN II (OR of 0.93 (95% CI: 0.74, 1.17)), or CIN III detection rates (OR of 1.08 (95% CI: 0.91, 1.27)) (data not shown).
Discussion
In the Dutch screening programme trends of increased detection occurred for all CIN grades from 2003–2005 to 2009. When adjusted for differences in the distribution of demographic factors, the probability of having a CIN I (i.e. OR of 2.11 (95% CI: 1.95, 2.29)), CIN II (i.e. OR of 1.79 (95% CI: 1.66, 1.92)) or CIN III diagnosis (i.e. OR of 1.59 (95% CI: 1.50, 1.67)) was still considerably higher in 2009 as compared with 2003. When also adjusting for the type of primary cytology test used, these relative risks were 1.90 (95% CI: 1.62, 2.22)), 1.48 (95% CI: 1.22, 1.79) and 1.55 (95% CI: 1.39, 1.73) respectively. Overall, the increase in CIN detection did not seem to significantly differ between age groups and screening regions, except for the increase in CIN III DRs among the screening regions. Trends of increased CIN detection still existed when restricting analyses to CIN detected via triage or via direct referral, mainly explained by increased probabilities of smears being classified as BMD or >BMD (ie. increased probabilities of women receiving a triage or direct referral advice). No trends in CIN DRs were found from 2009 to 2011, and no significant trends have yet been detected for cervical cancer over time.
Although the increasing trend of CIN DRs seems to have been temporary (ie. until 2009), CIN DRs remained at this increased level afterwards. As a consequence, the number of treated CIN lesions increased from approximately 3500 in 2000 (70 per 10,000 primary smears) to 5000 in 2011 (100 per 10,000 primary smears) (ie. assuming that all CIN II and III lesions are treated, and 500,000 women attend screening each year).
The total increase in CIN detection is probably caused by multiple factors, including an increased risk of developing cervical cancer. However, it is unlikely that the strong increase in CIN DRs could have been caused solely by an increased prevalence of risk factors (eg. changes in sexual behaviour, smoking, or long-term oral contraceptive use). The gradual implementation of liquid-based cytology contributed to a small extent to the CIN increase, although this effect could be underestimated if the effect of switching to liquid-based cytology differed between laboratories. The interaction between screening region (ie. proxy for the laboratories involved) and the type of primary cytology test used seems to confirm this, and could partly explain the increase in the number of cytological smears classified as BMD or >BMD, although the implementation of imaging-assisted reading could also have contributed. 12 Increased attendance of previously unscreened women may also have contributed to the CIN increase, although coverage rates of the screening population did not increase from 1998 to 2006. 14 Increased CIN DRs may have been a compensation for the observed previous decrease in CIN detection. This decrease was probably the effect of a period with increased screening intensity from 1996 to 1998, when the age range eligible for screening was extended from 35–53 years to 30–60 years and several extra birth cohort were invited.15,16 Finally, the screening protocol may occasionally be violated by performing co-testing (ie. primary cytology combined with primary high-risk HPV-testing), which could explain a small part of the CIN increase. 17
Changes in the distribution of demographic factors (age, screening region, and SES) did not explain the increase in CIN detection. Changes in registration method or completeness are also unlikely explanations, as definitions and methods of data collection in PALGA are unchanged over the past decade. Although the interobserver agreement among pathologists is lower for CIN I and CIN II than for CIN III,18,19 there are currently no data that suggest any changes over time. In addition, the positive predictive value of a direct referral did not significantly increase. It is unlikely that a late effect of a higher cytology cut-off (ie. due to the introduction of the CISOE-A classification in 1996) 20 has contributed to the CIN increase, as the increase was also observed in new participants of the screening programme (ie. aged 29–33). In addition, no significant differences in increased CIN DRs have been observed between age groups.
Contrary to CIN trends, trends in cervical cancer DRs have not yet been observed. Future trends of cervical cancer incidence may help to understand the underlying mechanism causing increased CIN DRs. An increased sensitivity to detect, and therefore treat, CIN will eventually lead to lower cervical cancer incidence and mortality, assuming that a proportion of the extra detected CIN is clinically relevant. If not, it would only lead to increased burden and harms through overdiagnosis (and treatment) of regressive CIN lesions. An increased background risk of cervical cancer and, therefore, progressive CIN lesions, will probable lead to increased cervical cancer incidence and mortality.
Our results agree with those of a Danish study which found a strong increase in the number of CIN I, II, and III diagnoses. 21 The Danish authors concluded that the increase was too sudden and strong to be caused by biological factors, such as an increase in HPV prevalence. In Finland the CIN DR decreased from 37.8 per 10,000 primary smears in 2006 to 32.5 in 2009. 22 In the UK the percentage of abnormal smears in women aged 25–64 increased from 5.2% in 2004–2005 to 6.7% in 2009–2010, and decreased to 5.8% in 2011–2012. 23 These variations in trends among European countries do not explain the observed trend in the Netherlands, and may indicate regional and national changes in the screening programme (eg. a new primary screening test), rather than changes in biological factors.
A limitation of our study was that we could not correct for differences in follow-up time after a positive primary smear. The individual follow-up period varied from 48 (ie. primary smear taken before April 2009) to 15 months (ie. primary smear taken in December 2011). The latter follow-up might have been too short for women with a primary BMD smear who were invited for multiple repeat cytology testing 6 and 18 months later. As the number of CIN I, II, and III detected after these multiple repeat tests were 27.2, 16.5, and 7.4% of the total CIN I, II, and III detection, low-grade CIN rates might have been somewhat underestimated in 2011. Also, we could not correct for differences in lost to follow-up (ie. women who did not comply with the given advice) over time, but its effect on the CIN increase would be negligible as the increase in CIN DRs is mainly explained by an altered distribution of cytological classifications.
In the Netherlands, trends of increased detection were present for all CIN grades from 2003–2005 to 2009, although they were not (yet) detected for cervical cancer. The gradual implementation of liquid-based cytology caused some of the increase in CIN DRs. This could lead to lower incidence and mortality of cervical cancer, if a proportion of the extra detected CIN are clinically relevant. If they are not, it would only lead to increased burden and harms through overdiagnosis (and treatment) of regressive CIN lesions. Other factors, such as an increased risk of developing cervical cancer and implementation of imaging-assisted reading, could also have contributed to the increased CIN DRs.
Footnotes
Acknowledgements
This study was funded by the Dutch National Institute for Public Health and the Environment (007/12 V&Z NvdV/EM), a non-profit organization with no involvement in the study design or collection, analysis, or interpretation of the data, writing of the report, or in the decision to submit the paper for publication. We thank C. Looman for statistical advice.
Conflict of interest statement
No conflict of interest to declare.
References
Supplementary Material
Please find the following supplemental material available below.
For Open Access articles published under a Creative Commons License, all supplemental material carries the same license as the article it is associated with.
For non-Open Access articles published, all supplemental material carries a non-exclusive license, and permission requests for re-use of supplemental material or any part of supplemental material shall be sent directly to the copyright owner as specified in the copyright notice associated with the article.