
Abstract
Meta-analysis (forest) plots are widely used to show the results from multiple individual randomized trials or observational studies that address the same question, including the assessment of screening markers. They show the between study spread of results and provide a summary estimate of the results from all the studies combined. We here illustrate the advantage of ordering study results by the magnitude of the effect and including a vertical shaded band encompassing the summary 95% confidence interval of the summary estimate to emphasize the uncertainty of the estimate in a way that is more prominent than only displaying a “diamond” around its value.
Meta-analysis (forest) plots 1 are widely used to present data from randomized trials (eg. on anti-platelet treatment 2 ) and observational studies (eg. studies on antenatal screening markers 3 ) as a simple way of illustrating the results from multiple individual studies that address the same question. Such plots are often used to assess the discriminatory value of possible screening markers. The plots typically show a summary estimate of the results from all the studies combined, presented as a “diamond”, with the width of the diamond representing the 95% confidence interval of the summary estimate based on all the results combined. It is customary to produce a central vertical line designating “no effect”, either at 1 for measures such as relative risk estimates, or at zero for absolute differences. We here illustrate the advantage of ordering study results by the magnitude of the effect and including a vertical shaded band encompassing the summary 95% confidence interval to emphasize the uncertainty in the summary estimate in a more prominent way.
We use as an example a meta-analysis on studies of inhibin-A as a screening marker for Down’s syndrome, which summarized the results of 20 studies.4–25 Figure 1 shows this plot in a standard format. There is a vertical line designating no difference (ie. a multiple of the median [MoM] for unaffected pregnancies of 1.00) and a separate vertical line through the summary estimate of the observed median MoM value in Down’s syndrome pregnancies (1.93), so that it is possible to see whether the individual studies have confidence intervals that include the summary estimate (although this is too strict a test, because it ignores the uncertainty around the overall summary estimate). The size of the squares showing the estimate from each study reflects the statistical “weight” of that study, ie. the relative contribution of that study to the summary estimate. When combining relative risks (or odds ratios) or relative differences as in our example, it is best to present the horizontal axis on a doubling (log scale) because the confidence intervals for each individual study and the confidence interval for the summary estimate are then expected to be symmetrical about the point estimate.
Meta-analysis plot ordered chronologically: early second trimester median Inhibin-A concentrations in Down’s syndrome pregnancies expressed as the multiple of the median (MoM) in unaffected pregnancies of the same gestational age.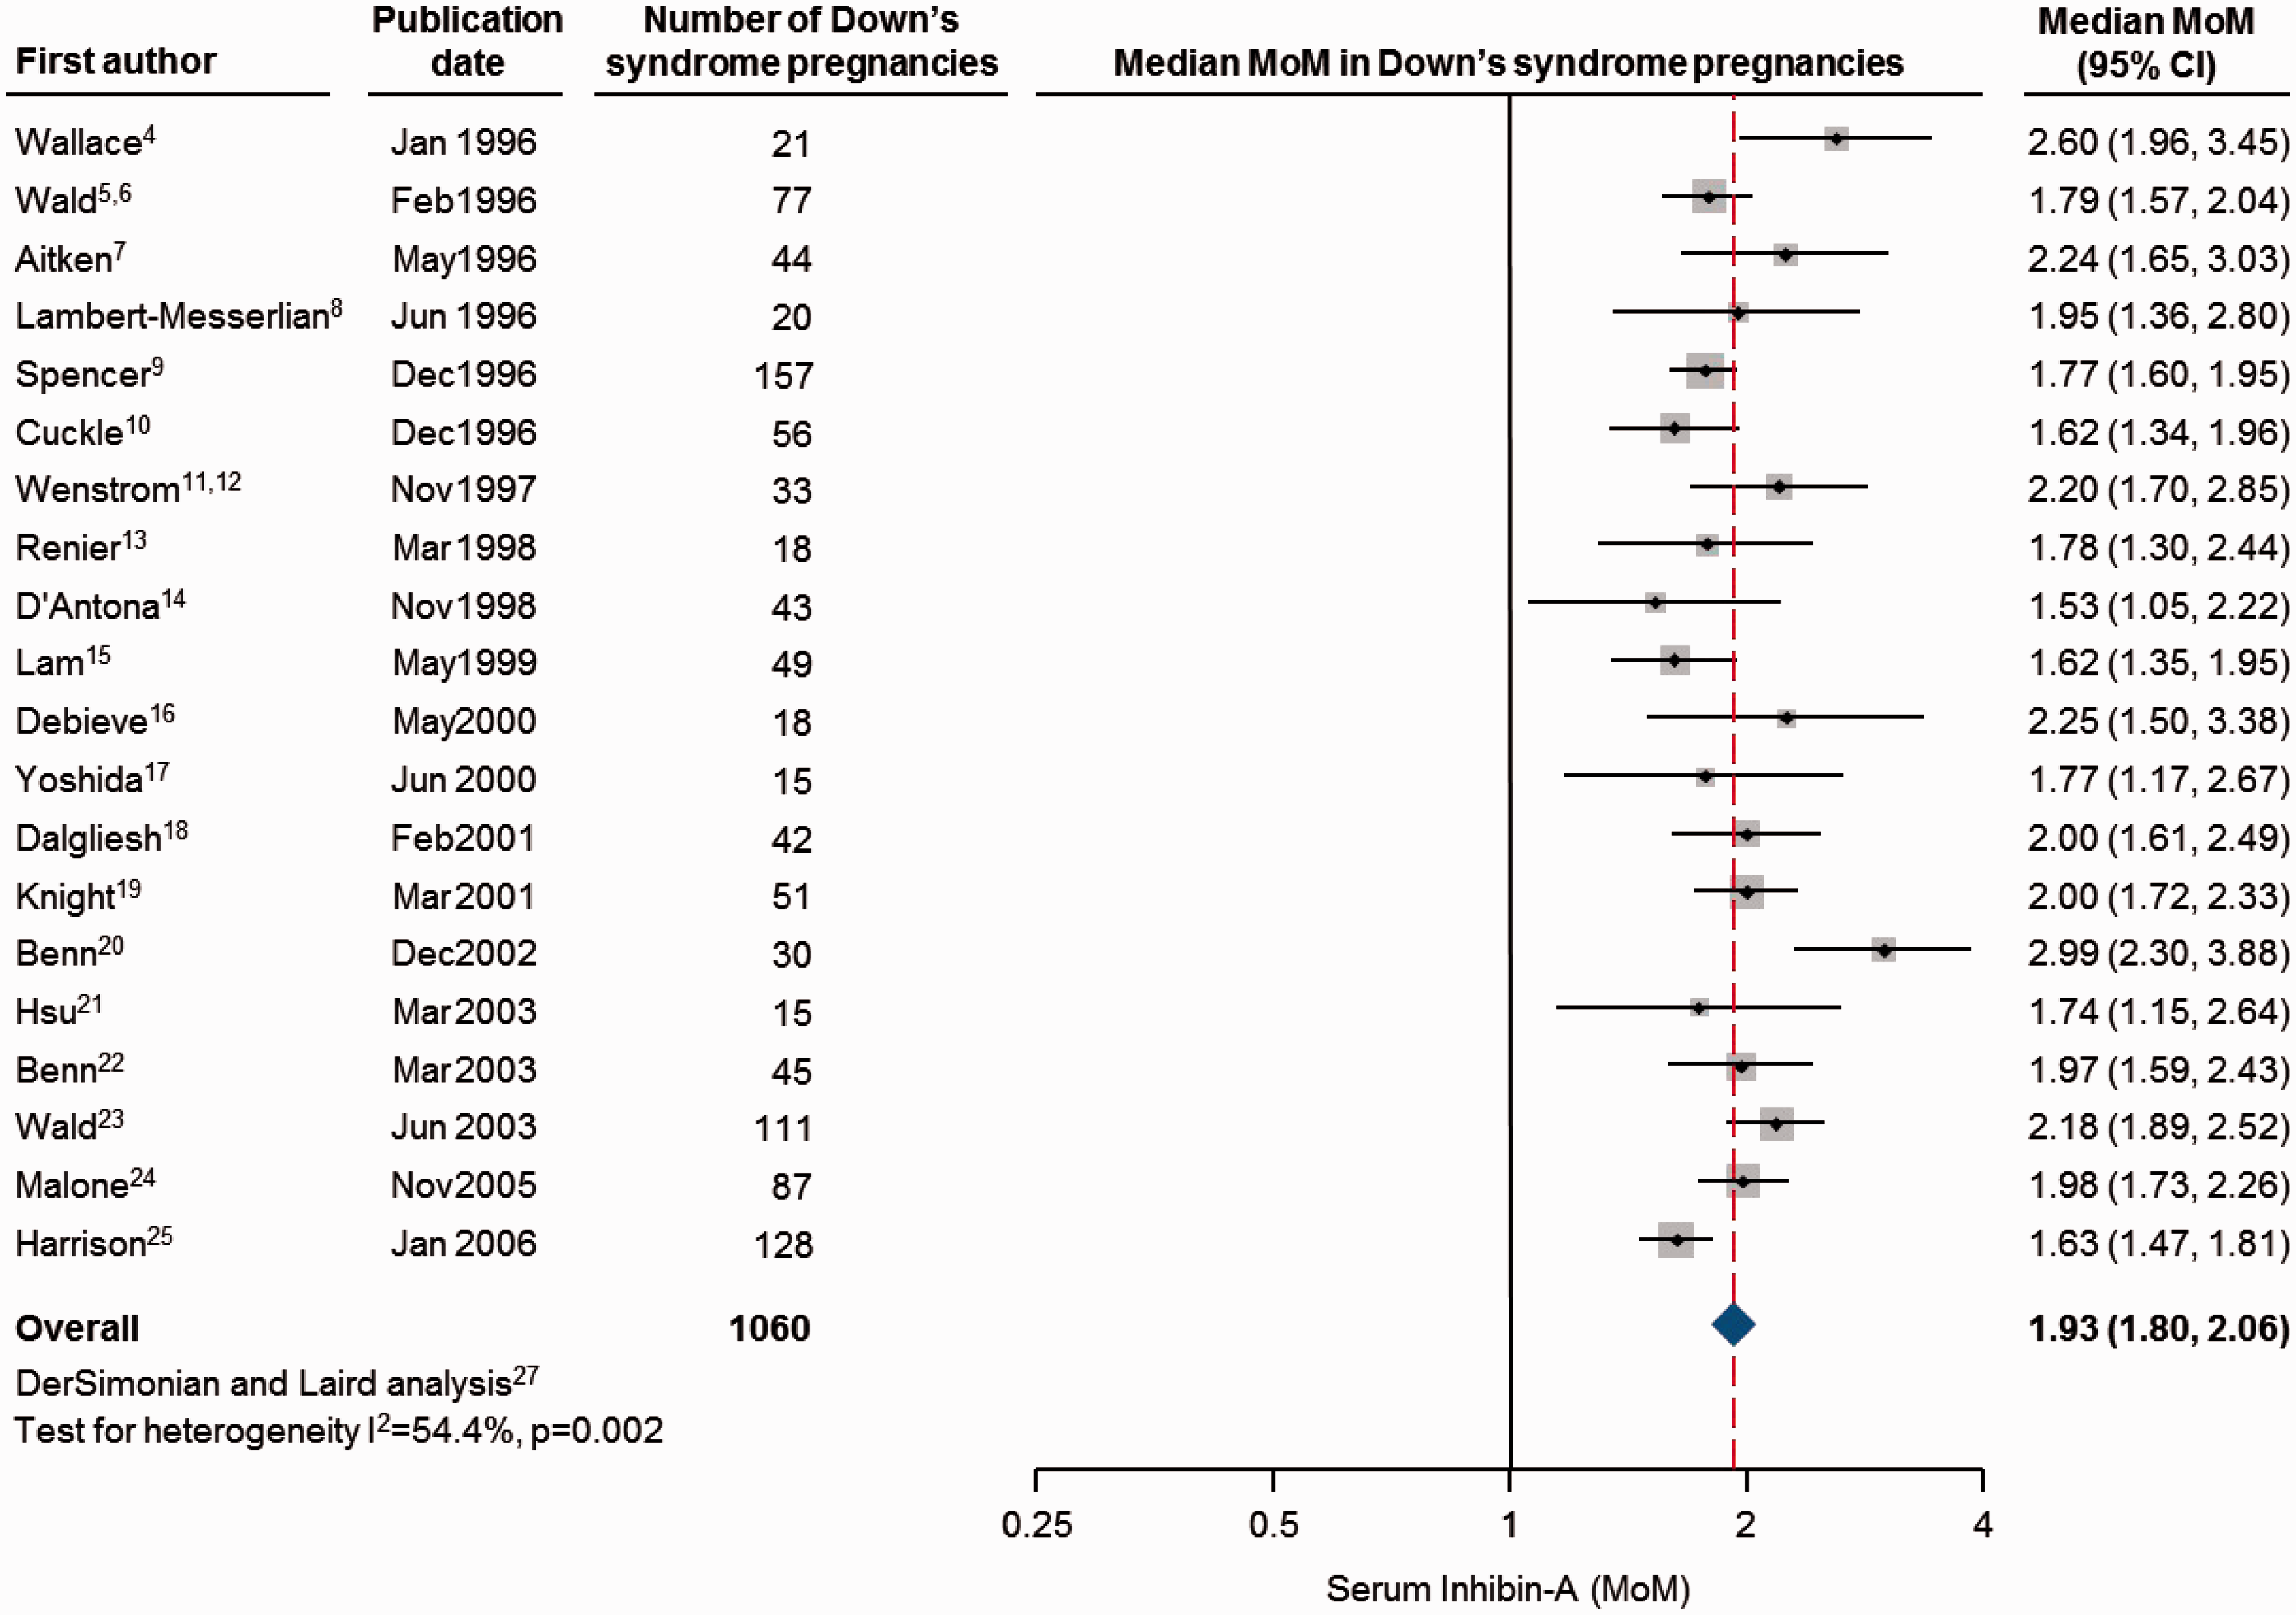
It is usual to present the results in chronological order, as in figure 1. This produces a plot in which the point estimates are scattered randomly, with the exception that often the result from the first study published tends to be more extreme since, had that study not shown a striking result, it may not have been published. Cumulative chronological meta-analysis plots can be useful to determine if and when the point estimates become stable. Sub-group meta-analysis plots can be useful in determining whether an effect varies according to the sub-groups selected. 26 Different ordering sequences or groupings can be used, depending on the intended purpose.
Figure 2 shows the individual results ordered according to the magnitude of the effect. In our example the result with the highest estimate is at the top, and the one with the lowest is at the bottom. This format brings out the distribution of the point estimates, that is, the extent of the variation in estimates between studies which can help to indicate whether it is due to chance differences between studies giving different estimates of the true effect by chance, or whether other explanations may apply. It also reveals whether the spread of estimates is symmetrical, raising, for example, the suspicion of publication bias if the variation is obviously asymmetrical.
Meta-analysis plot ordered by effect size showing summary 95% confidence interval band: early second trimester median Inhibin-A concentrations in Down’s syndrome pregnancies expressed as the multiple of the median (MoM) in unaffected pregnancies of the same gestational age.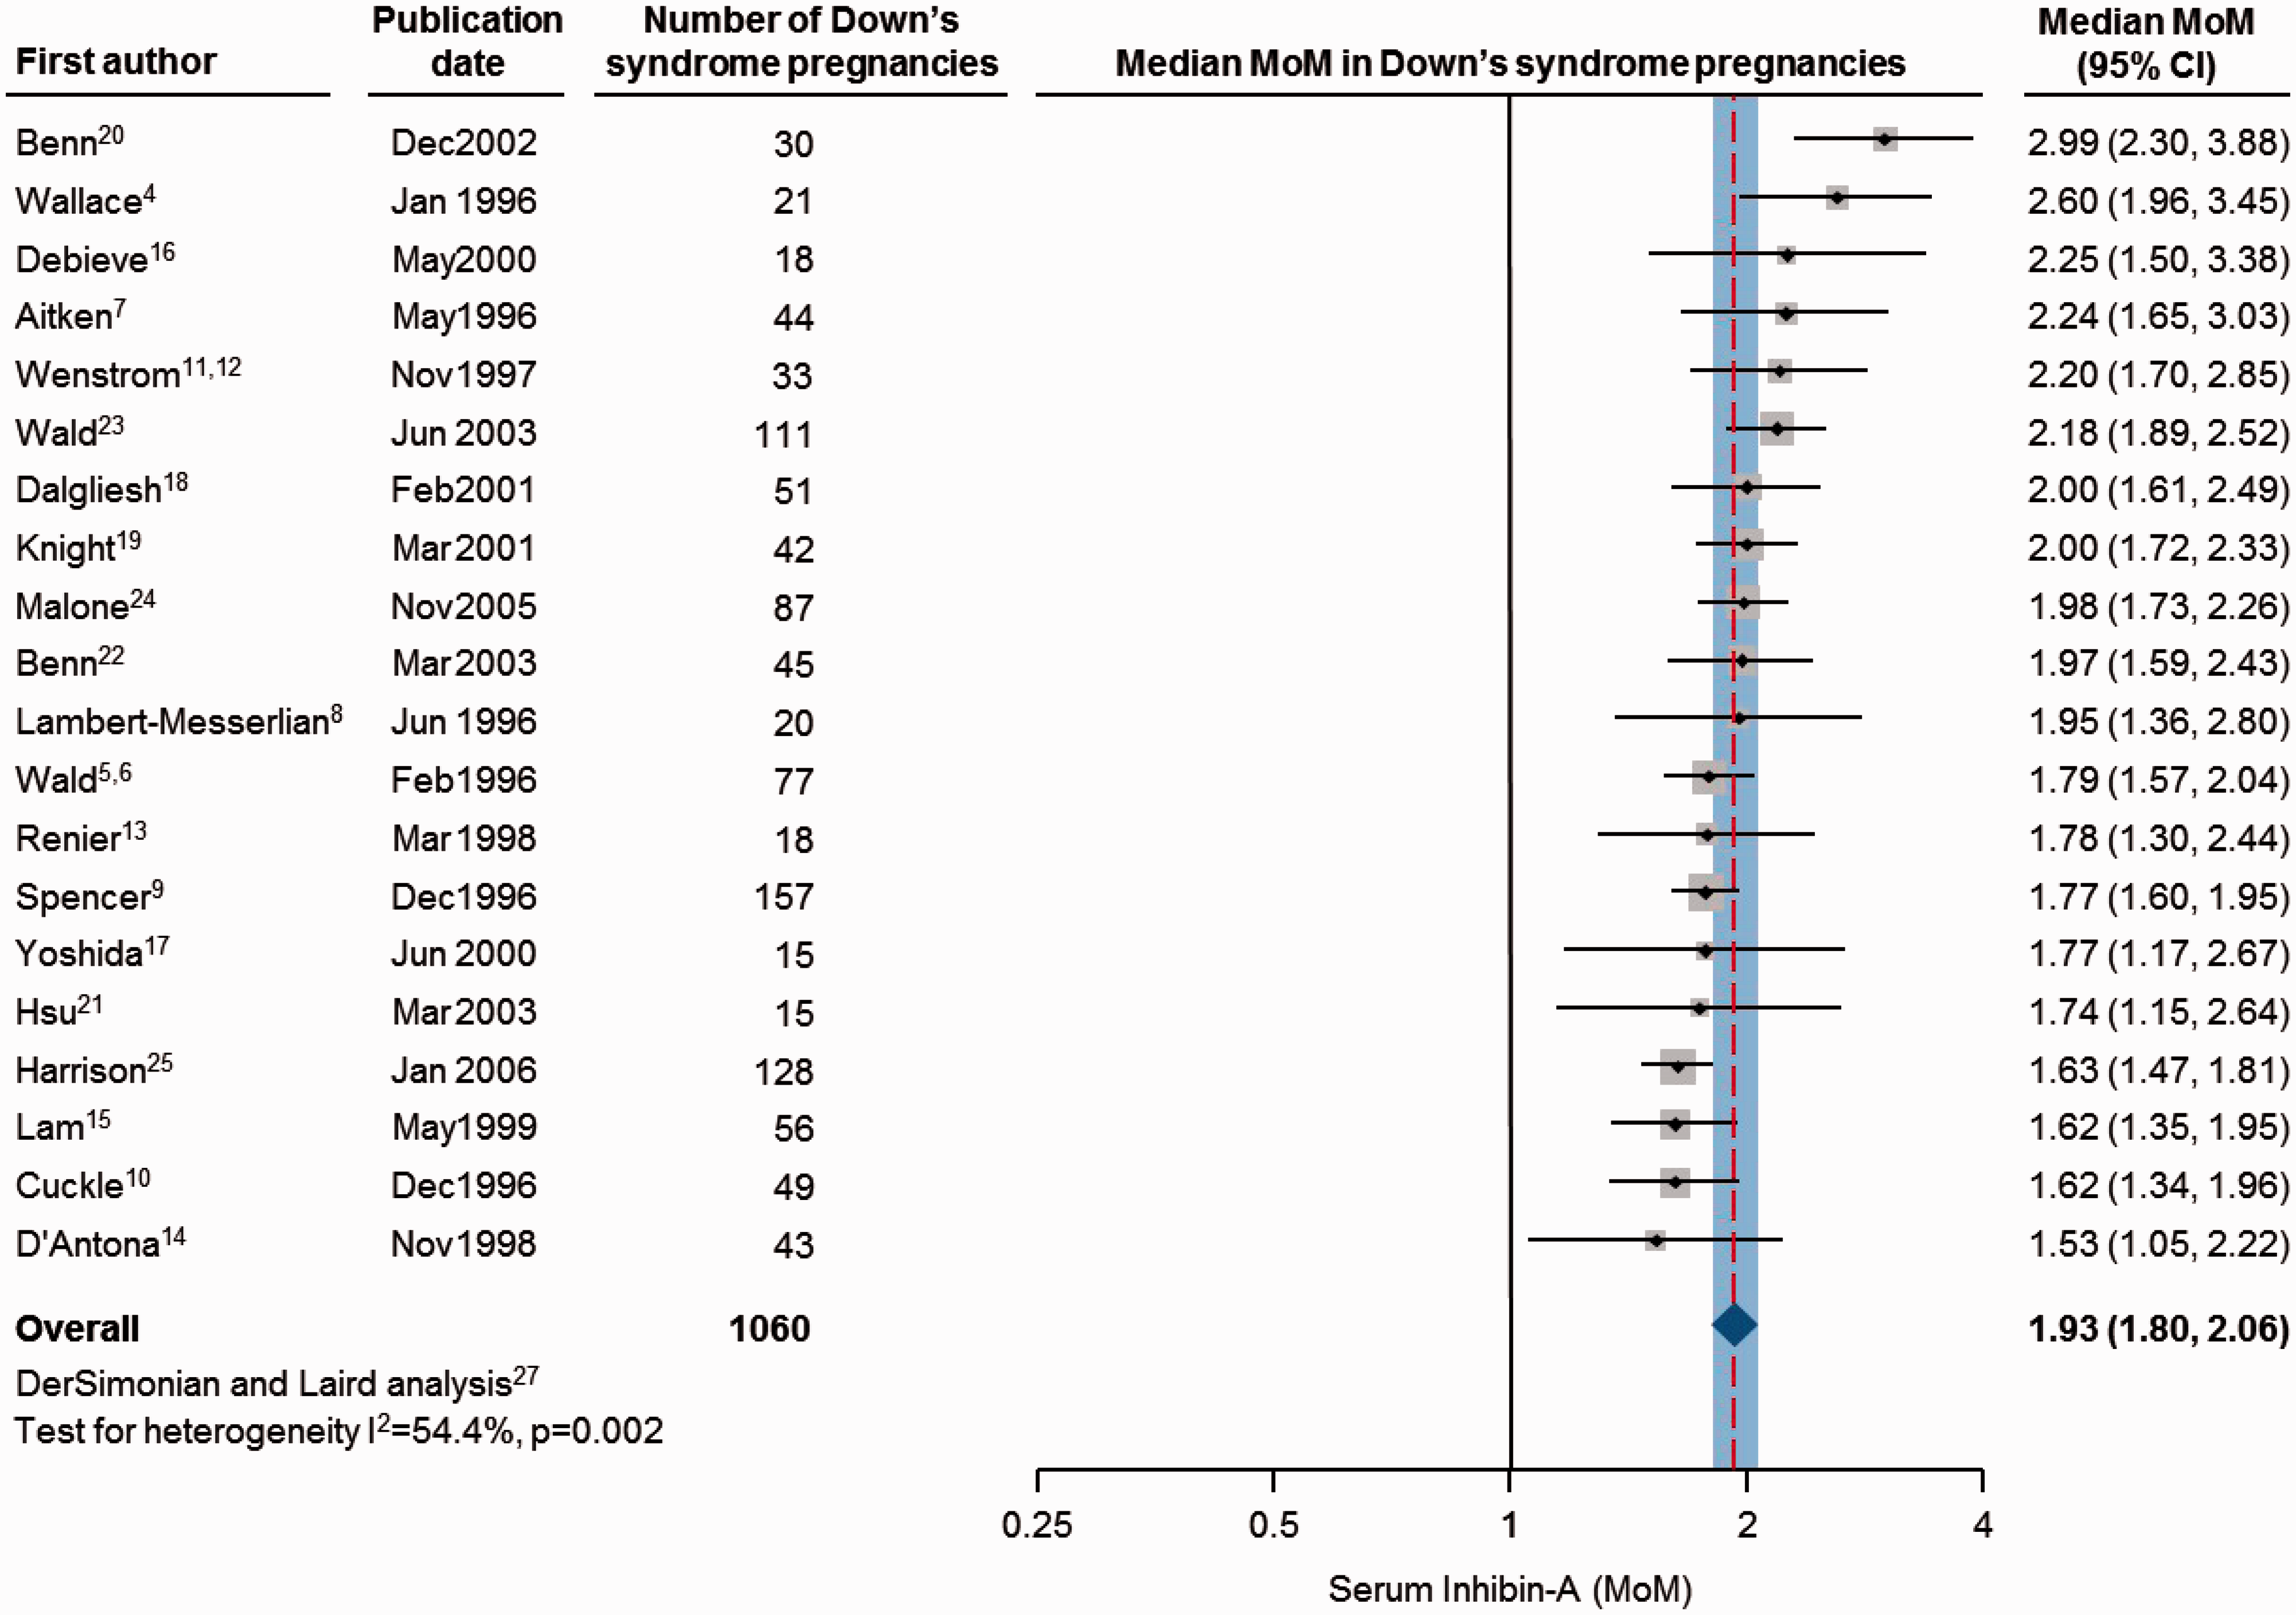
Figure 2 also shows a vertical shaded band around the 95% confidence interval based on all the studies combined. This brings out the uncertainty in the overall result in a way that is more prominent than only displaying a “diamond” around the estimate, and helps to provide a visual guide to outliers with confidence intervals that do not enter the band, rather than touch the line representing the overall summary estimate.
We here illustrate the ordering of individual study estimates according to effect size, together with the summary 95% confidence interval band in relation to the median differences of the antenatal screening marker inhibin-A in affected and unaffected pregnancies. The same approach could be adopted whenever a meta-analysis plot is considered appropriate.
Footnotes
Funding
This research received no specific grant from any funding agency in the public, commercial, or not-for-profit sectors.