
Abstract
Nuchal translucency (NT) is a useful marker in antenatal screening for Down’s syndrome in the late first trimester of pregnancy. NT measurements increase with increasing crown rump length (CRL) so multiple of the median (MoM) values are used to allow for this. Log-linear and log-quadratic regressions of NT in relation to CRL have previously been proposed to calculate MoM values. Using data on 288,079 women, these models were compared with a log-sigmoid regression. The log-linear regression overestimated the median NT above a CRL of 75 mm; for example, 1.9 mm versus 1.8 mm observed at 75–79 mm, and 2.0 mm versus 1.8 mm at 80–84 mm. The log-quadratic regression underestimated the median NT below a CRL of 45 mm at 1.03 mm versus 1.2 mm observed. The sigmoid regression provided the best overall fit to the data across the range of CRL values (40–84 mm) corresponding to gestational ages of 76 to 99 days. The differences between the three models are small. If a log-linear regression appears to be a poor fit using local data, a log-sigmoid regression could be considered.
Introduction
Nuchal translucency (NT) is a useful marker in antenatal screening for Down’s syndrome in the late first trimester of pregnancy. NT increases with increasing crown rump length (CRL), so multiple of the median (MoM) values for the same CRL are used to standardize measurements for use in Down’s syndrome risk estimation. MoM values are calculated by dividing the observed NT measurement by the expected NT for the same CRL, the expected measurement being estimated using regression. The increase in NT with increasing CRL has been described previously using linear 1 or quadratic 2 regression (with log NT values). With increasing data available from screening programmes, it emerged that the log-linear model did not fit the observed data well, at CRL values of 75 mm or more, and the log-quadratic model did not fit the observed data well at CRL values less than 45 mm. This prompted us to seek a better mathematical function that would fit the data better at these CRL values.
Methods
We used data from 288,079 women who had singleton pregnancies with a CRL between 40 and 84 mm (corresponding to gestational ages of 76 to 99 days 3 ), screened at the Wolfson Institute of Preventive Medicine in London between February 2003 and March 2013.
Figure 1 shows the median NT measurements in 5 mm CRL categories. The top part of Figure 1 (labelled a) uses a log-linear regression, the middle part (labelled b) uses a log-quadratic regression, and the bottom part (labelled c) uses a log-sigmoid regression. Each regression was weighted by the number of women in each CRL category, as is the standard practice in antenatal screening programmes. The weighting was performed to avoid the influence of outliers, especially when local data may be sparse, as outliers can have a big influence on the regression line.
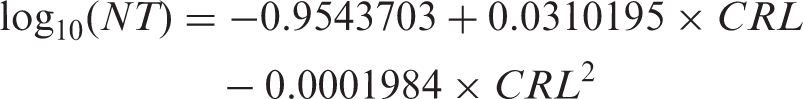
The equation for the log-linear regression was:

Results
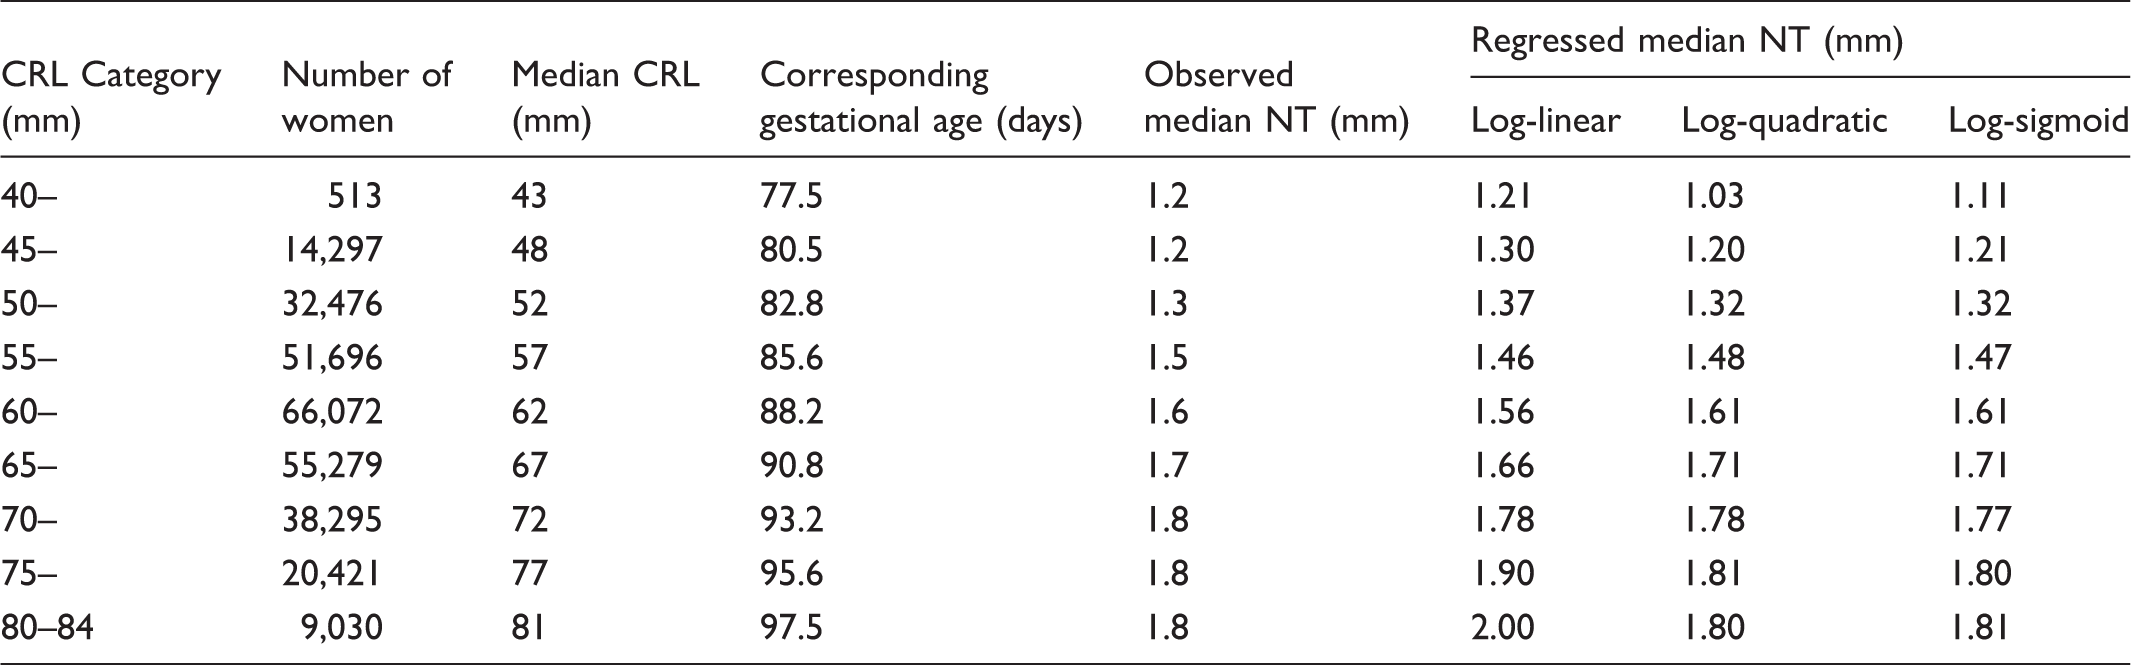
Table 1 shows the number of women, the observed median NT, and the expected NT, for each regression model according to CRL category. The log-linear regression fitted the data least well, especially above CRL measurements of 74 mm, where the observed and regressed NT values differed by up to 11%, and in the 45 to 54 mm CRL range, where they differed by up to 8%. Both the log-quadratic and log-sigmoid regressions fitted the data reasonably across the range of CRL (observed and expected less than 2% different). Neither fitted the data well at CRL measurements less than 45 mm (observed and expected differ by 14% and 7% respectively), however, only 0.2% of the data is in this CRL category. The Akaike information criterion (AIC) for each regression model confirmed that the log-linear regression fitted least well, with the highest AIC value of the three regression models (−43.8). However, there was little difference between the log-quadratic (AIC = −62.1) and log-sigmoid (AIC = −62.4) regression models. Regression models based on all data points were similar to those based on grouped data presented here, and the sigmoid relationship was apparent in earlier (before 2006) as well as more recent (after 2009) data.
The relative effect of the different regression models on MoM values and risk estimation is minor, apart from at low values of CRL with high NT measurements. For example the MoM values for an NT measurement of 2 mm at a CRL of 40 mm (approximate gestation 10 weeks, 5 days) would be 1.75, 2.15, and 1.86 using the log-linear, log-quadratic, and log-sigmoid regressions respectively, with corresponding early-second trimester risks in a woman aged 25 (calculated using published parameters 4 ) of 1 in 360, 1 in 65, and 1 in 220. There are also differences at high CRL values with high NT values, but these are less marked. With the addition of other screening markers, such as free β-human chorionic gonadotropin and pregnancy associated plasma protein-A, relative differences between risk estimates using NT MoM values calculated from the three regression models are diminished.
Discussion
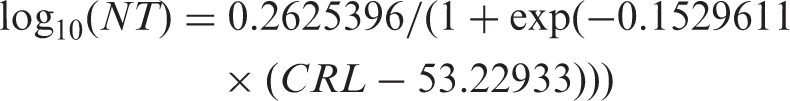
The log-quadratic model has the disadvantage that the direction of the regression curve reverses, which occurs in Figure 1 at a CRL of about 80 mm. Table 1 shows that the expected NT is 1.81 at a CRL of 77 mm, and 1.80 at a CRL of 81 mm. For this reason, the sigmoid regression may be preferred. If a log-quadratic were chosen, a constraint could be used so that, for CRL measurements beyond the inflexion point of the quadratic curve, the expected NT at the point of inflexion would be used to calculate the MoM value for greater CRL values. The CRL at which the inflexion point occurs is found by differentiating the log-quadratic regression equation with respect to CRL and finding the value of CRL such that the resulting equation equals zero i.e. finding the value of CRL such that
The differences between the three models are small, however if a log-linear regression appears to be a poor fit using local data, a log-sigmoid regression could be considered.
Median nuchal translucency (NT) measurements according to 5 mm categories of crown rump length (CRL) together with regression lines for a (a) log-linear regression, (b) log-quadratic regression, and (c) log-sigmoid regression. Observed and regressed nuchal translucency (NT) measurements according to categories of crown rump length (CRL).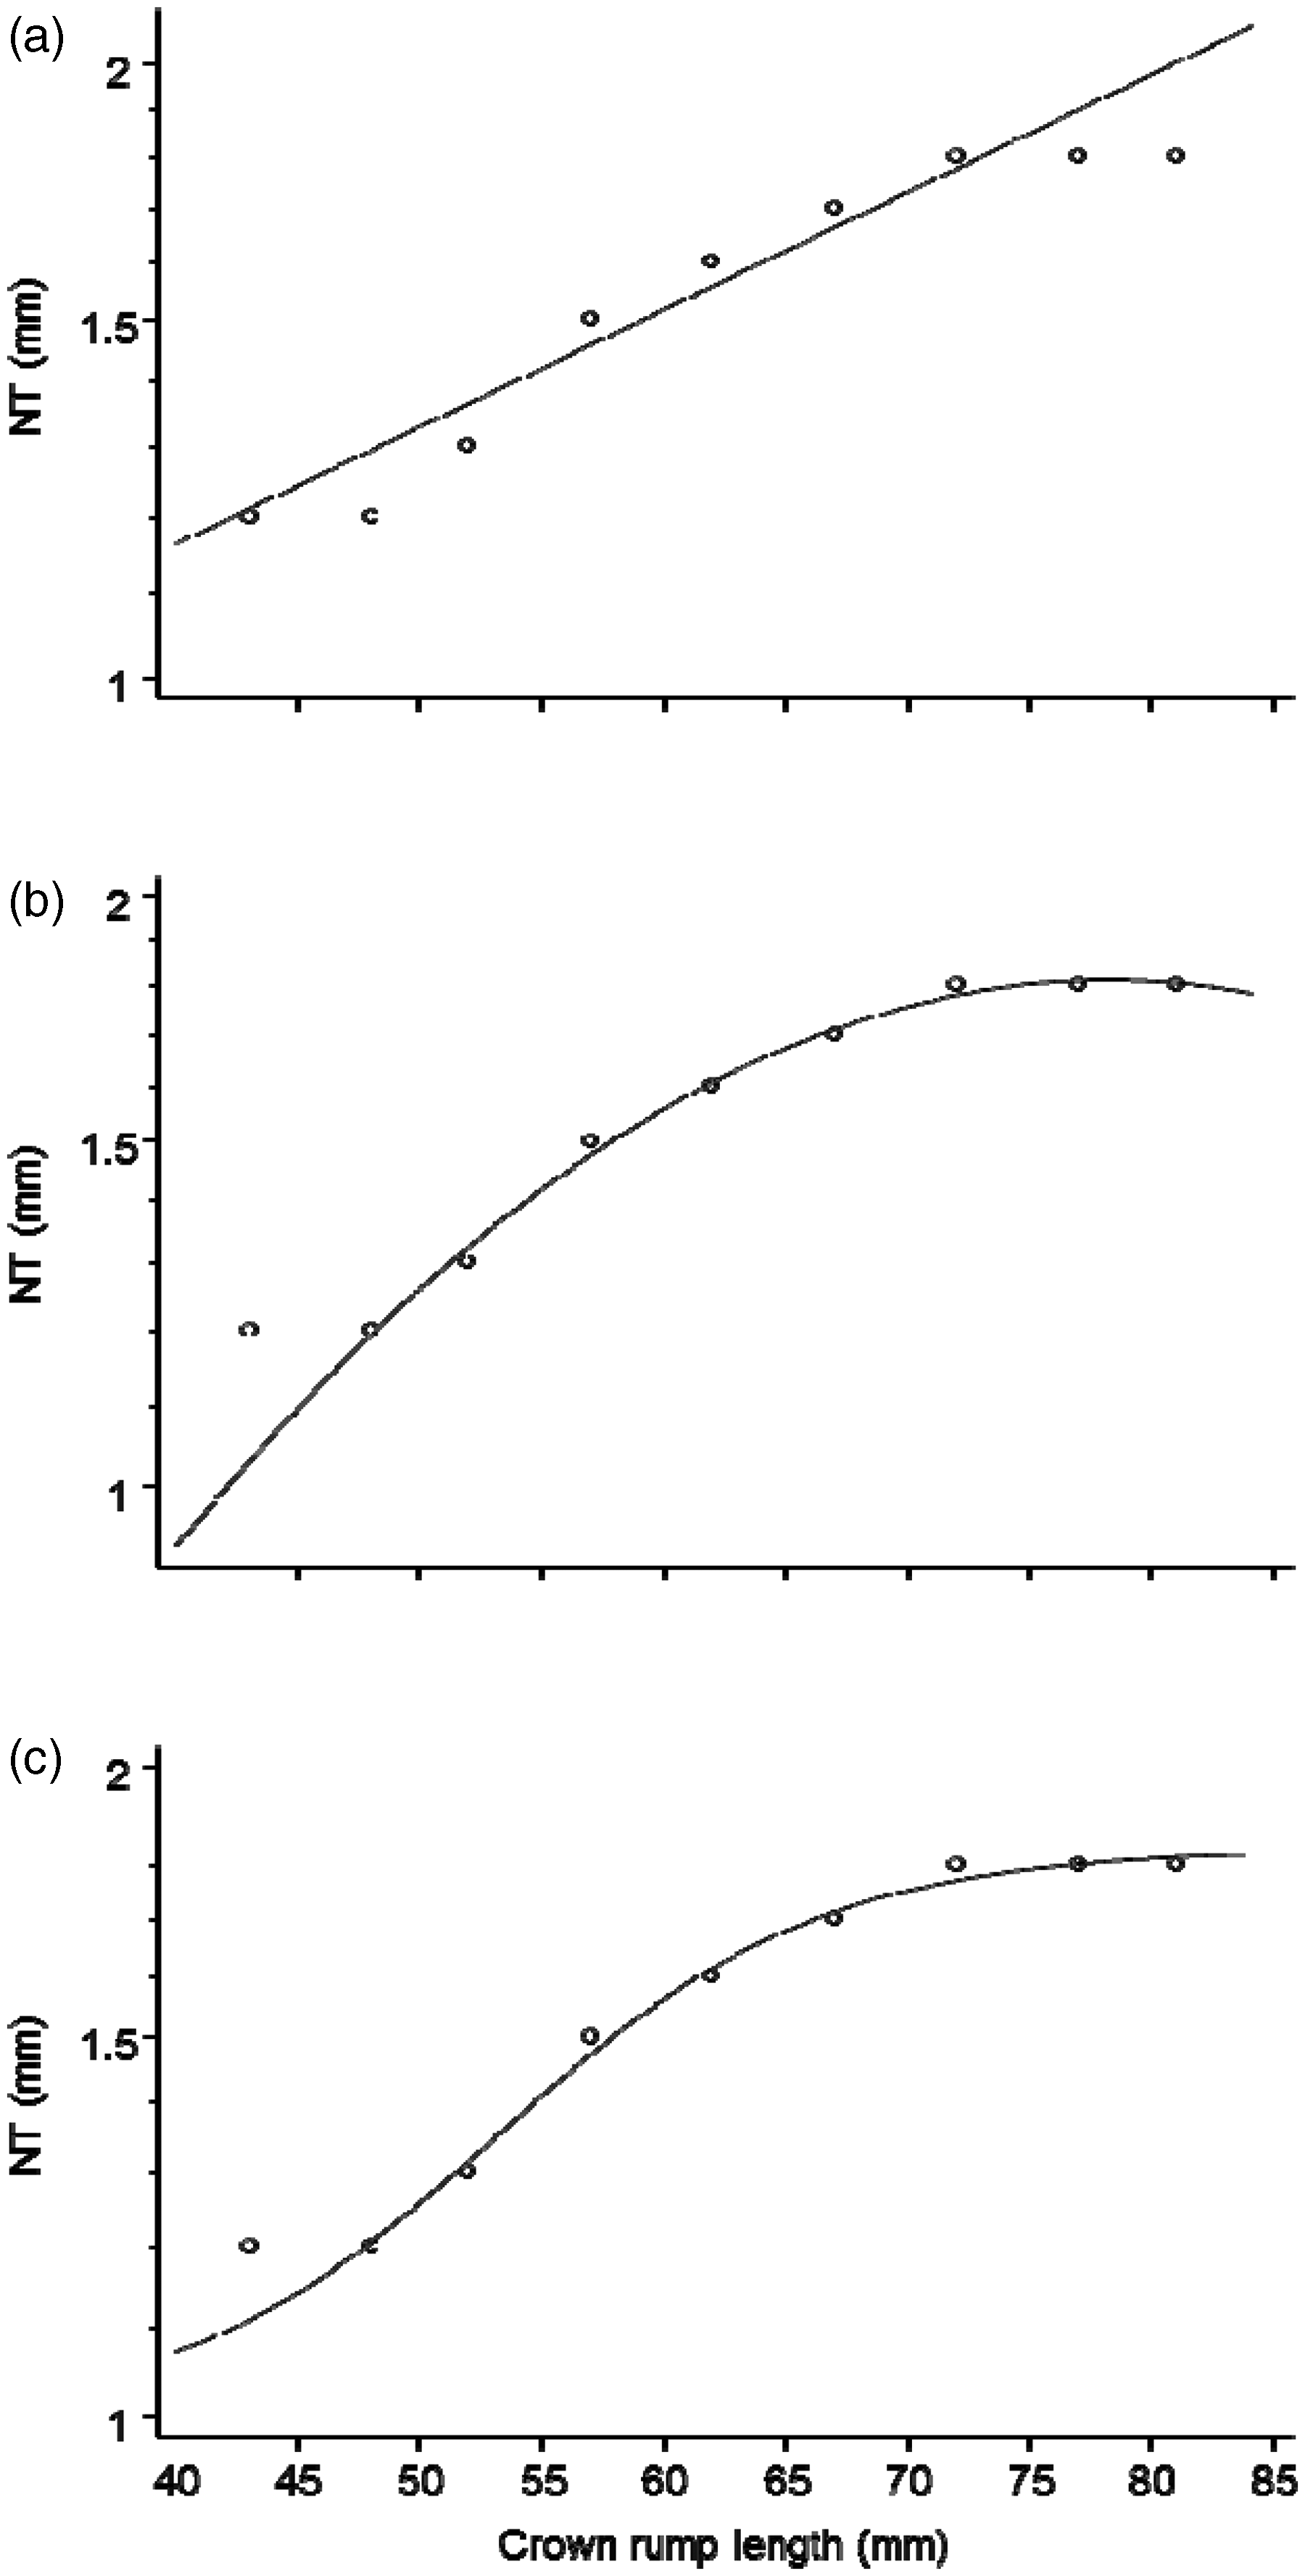
Footnotes
Funding
This research received no specific grant from any funding agency in the public, commercial, or not-for-profit sectors.
Declaration of interest
Nicholas Wald is a Director of Logical Medical Systems Ltd, which produces software for the interpretation of Downs Syndrome screening tests.