
Abstract
The National Lung Screening Trial (NLST) reported a 20% reduction in lung cancer specific mortality using low-dose chest CT (LDCT) compared with chest radiograph (CXR) screening. The high number of false positive screens with LDCT (around 25%) raises concerns. NLST radiologists reported LDCT screens as either positive or not positive, based primarily on the presence of a 4+ mm non-calcified lung nodule (NCN). They did not explicitly record a propensity score for lung cancer. However, by using maximum NCN size, or alternatively, radiologists’ recommendations for diagnostic follow-up categorized hierarchically, surrogate propensity scores (PSSZ and PSFR) were created. These scores were then used to compute ROC curves, which determine possible operating points of sensitivity versus false positive rate (1-Specificity). The area under the ROC curve (AUC) was 0.934 and 0.928 for PSFR and PSSZ, respectively; the former was significantly greater than the latter. With the NLST definition of a positive screen, sensitivity and specificity of LDCT was 93.1% and 76.5%, respectively. With cutoffs based on PSFR, a specificity of 92.4% could be achieved while only lowering sensitivity to 86.9%. Radiologists using LDCT have good predictive ability; the optimal operating point for sensitivity and specificity remains to be determined.
Introduction
The National Lung Screening Trial (NLST) reported a statistically significant 20% reduction in lung cancer specific mortality using low-dose chest CT (LDCT) compared with single-view posteroanterior chest radiograph (CXR) screening. 1 However, the high rate of false positive screens with LDCT (around 25%) raises concerns, as this contributes to considerable follow-up diagnostic testing, cost, and anxiety. 2
In NLST, radiologists reported each LDCT screen as positive or not, based primarily on whether a non-calcified lung nodule (NCN) 4 mm or larger was identified. Readers did not record a propensity score for lung cancer, as was done for breast cancer and mammography in the Digital Mammographic Imaging Screening Trial (DMIST) trial. 3 However, by using maximum NCN size, or alternatively, radiologists’ recommendations for diagnostic follow-up, a surrogate propensity score can be created. These surrogate propensity scores can then be used to compute ROC curves, which, in theory, determine which possible operating points of sensitivity versus false positive rate are feasible for radiologists’ interpretations. Knowing such possible operating points, one can analyze which tradeoffs of increased specificity for decreased sensitivity may be worthwhile.
Methods
The NLST study design has been described previously. 4 Subjects aged 55-74 were enrolled from 2002-2004 and randomized to undergo lung cancer screening with either LDCT or CXR annually for three years. Eligibility criteria included a 30+ pack year history of cigarette smoking and current smoking status or having quit smoking within the past 15 years. NLST radiologists were required to be certified by the American Board of Radiology or equivalent, have documented training and experience and to complete training in image quality and interpretation. 4
Each NLST LDCT examination was interpreted by a single radiologist. The NLST protocol defined LDCT screens containing a ≥4 mm NCN as positive. For each NCN ≥4 mm, radiologists reported the greatest transverse and perpendicular diameter. Other abnormalities could also trigger a positive screen classification, including enlarged lymph nodes, an endobronchial lesion or a pleural effusion. Radiologists additionally recorded their recommendations for diagnostic follow-up, which included LDCT surveillance at various time intervals, diagnostic contrast-enhanced CT, PET, and biopsy. There was no trial-wide required or recommended diagnostic algorithm employed to manage positive screens. Radiologists generally utilized their clinical judgment concerning the level of suspicion for lung cancer and in keeping with locally accepted medical practice.
Positive screens were tracked for subsequent diagnostic procedures performed and cancer diagnoses. In addition, subjects were followed with yearly status update forms to ascertain cancers diagnosed in the absence of a positive screen. All reported cancers were verified with medical records.
Statistical Methods
A surrogate propensity score, denoted PSFR, was created from radiologists’ follow-up recommendations for positive exams, with hierarchical categories in descending order as follows: 5 - biopsy, 4 - diagnostic CT, PET, or contrast-enhanced CT scan, 3 - LDCT at 3 months, 2 - LDCT at 6 or 3-6 months, and 1 - positive screen with no higher procedure (includes LDCT at 12 months, clinical exam and comparison with prior screens). A negative exam had a score of 0. A second surrogate propensity score (PSSZ) was created based on the maximum diameter (DM) of the largest NCN. For DM of 4-10 mm, each integer value was a distinct PSsz score; for DM > 10, the categories of 11-14 mm, 15-19 mm, 20-29 mm and 30+ mm constituted distinct scores, with the score 0 again for a negative screen.
Scores were converted into a ROC curve by considering sensitivity and specificity over the range of possible propensity score cutoffs. For this purpose, a subject at a given screen was classified as having lung cancer if they had a lung cancer diagnosis within a year of the screen. Using a cutoff score of ≥1 for either propensity score gives sensitivity and specificity for the NLST definition of a positive screen. The area under the ROC curve (AUC) was computed non-parametrically. 5 Confidence limits were generated by bootstrapping.
Results
A total of 26,022 NLST subjects received at least one LDCT screen; 75,126 LDCT screens were performed in all, of which 642 were followed by a lung cancer diagnosis within one year. The overall sensitivity and specificity of LDCT screening was 93.1% and 76.5%, respectively.
Among false positive screens, 67.9% had PSFR = 1 or 2, and 22%, 7.4% and 2.7% had PSFR scores of 3, 4 and 5, respectively. Among true positive screens 6.7% had PSFR = 1 or 2, 18.4% had PSFR = 3, 31.9% had PSFR = 4 and 43.0% had PSFR = 5. Examining false positives by nodule size, 37.1% had maximum size of 4-5 mm and 28.9% had maximum size of 6-7 mm; among true positives, 3.2% and 7.5% had maximum size of 4-5 and 6-7 mm, respectively.
Figure 1 shows the ROC curves based on the two propensity scores, PSFR (follow-up recommendations) and PSSZ (nodule size). AUCs were 0.934 (95% CI: 0.922-0.946) for PSFR and 0.928 (95% CI: 0.914-0.939) for PSSZ. The AUC derived from PSFR was statistically significantly greater than that derived from PSSZ (95% CI for difference 0.003-0.010, p < 0.001). Among positive screens, the rank correlation of PSFR and PSSZ was 0.37 (p < 0.001); for 6, 10 and 20-29 mm maximum NCN size, average PSFR scores were 1.9, 2.6 and 3.4, respectively.
ROC Curves for Two Propensity Scores.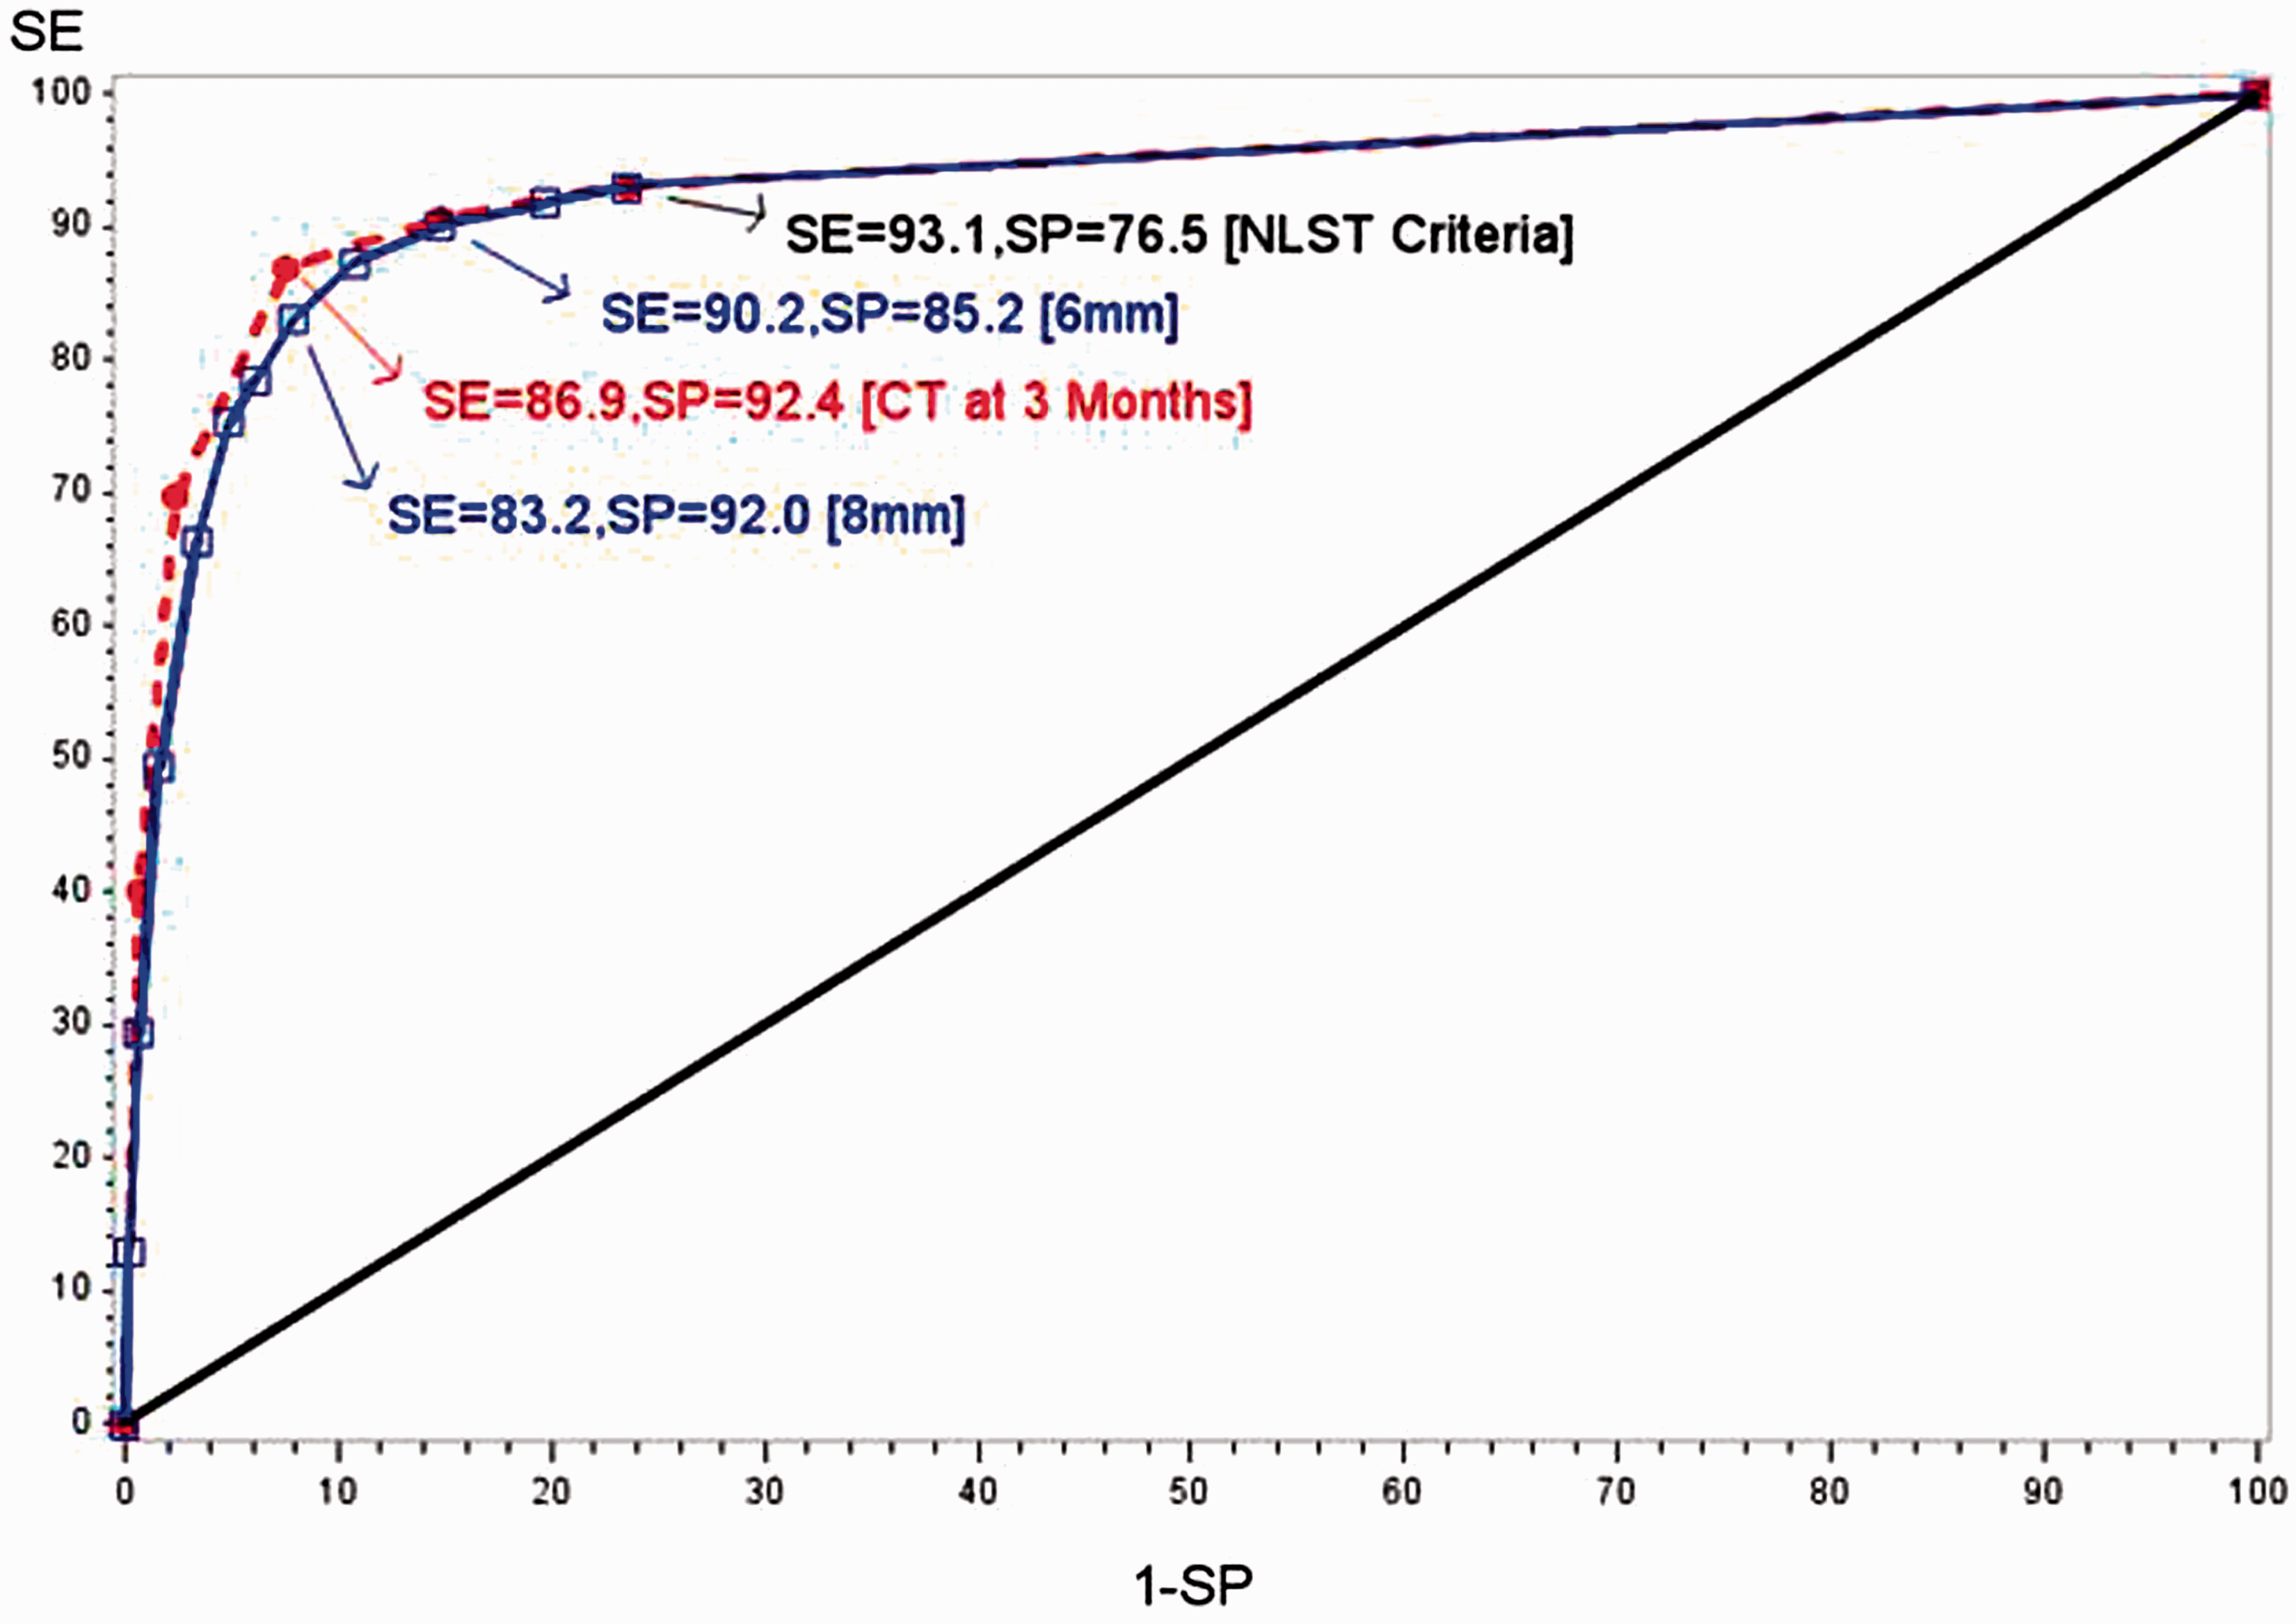
Figure 1 also highlights potential sensitivity/specificity combinations at various cutpoints of PSFR and PSSZ. For PSFR, using a cutpoint of ≥3 to define a positive screen (eg, CT within 3 months, diagnostic CT, contrast-enhanced CT, PET or biopsy) gave sensitivity of 86.9% and specificity of 92.4%. For PSSZ, defining a positive screen as maximum NCN size of at least 6 mm yielded a sensitivity of 90.2% and a specificity of 85.2%; increasing to an 8 mm threshold resulted in sensitivity decreasing to 83.2% and specificity increasing to 92.0%.
Discussion
The ROC AUCs derived from both radiologists’ follow-up recommendations and NCN size measurements were very high, around 0.93, indicating that radiologists using LDCT have very high predictive ability. As a comparison, the DMIST trial evaluated digital versus analog mammography using a 7 point propensity score. 3 Using a cancer status definition as used in this study of diagnosis within one year of the screen, we computed (non-parametrically) from the DMIST data an AUC of 0.828 (95% CI: 0.798-0.858) for digital mammography. Note the reported primary DMIST outcome, an AUC for digital of 0.78, was based on cancers diagnosed within 455 days. 3 Using a two year definition in NLST of cancer present at a screen, the AUCs were lower, 0.834 (PSRF) and 0.832 (PSSZ). However, with annual screening currently considered the standard, a one year definition fits best into that framework.
The ROC curves show that, in theory at least, radiologists could operate at substantially higher specificities (ie. lower false positive rates), while sacrificing only small amounts of sensitivity. For example, if only those screens with a recommended follow-up of at least repeat CT at 3 months (ie. PSFR score of 3+) were considered positive, a specificity of 92.4% could be achieved while only lowering sensitivity to 86.9% (from 93.2% with the NLST definition of a positive screen). Alternatively, increasing the size cutoff to 8 mm (instead of 4) yielded a specificity of 92.0% and sensitivity of 83.2%. These results can be compared with similar recent findings from the International Early Lung Cancer Action Program. There, among 21,316 subjects with a baseline LDCT screen, increasing the size threshold for a positive screen from 5 to 8 mm decreased the screen positivity rate from 16.1% to 5.1% while decreasing the yield of screen-detected cancers only minimally, from 119 to 112. 6 Whether such tradeoffs, even if shown to be desirable, could actually be achieved in clinical practice, given real world constraints, is another issue that would need to be carefully studied.
NLST radiologists varied substantially in false positive rates. Among 112 radiologists reading 100+ LDCT exams in NLST, the mean (SD) false positive rate was 28.7% (13.7%), with a range of 3.8-69%. 7 Radiologists with high false positive rates (above the median), had an aggregate false positive rate of 39.7%, compared with 18.2% for those with low false positive rates (below the median). 7
Using the follow-up recommendations propensity score PSFR, the AUCs for the high and low false positive rate radiologists were 0.943 and 0.932, respectively (difference = 0.011, 95% CI: -0.012, 0.034; p = 0.35). This shows that the two groups had similar predictive ability in interpreting LDCT scans, but were likely to be operating at different points along similar ROC curves.
Radiologists using LDCT for lung cancer screening have very good predictive ability. The ROC curve operating points (paired sensitivity and specificity values) derived here from maximum nodule diameter or follow up recommendations can help frame the discussion concerning appropriate clinical algorithms for determining when a LDCT screening examination should be considered positive.
Footnotes
Funding
This research received no specific grant from any funding agency in the public, commercial, or not-for-profit sectors.